NARRBEGIN: SA_80_83
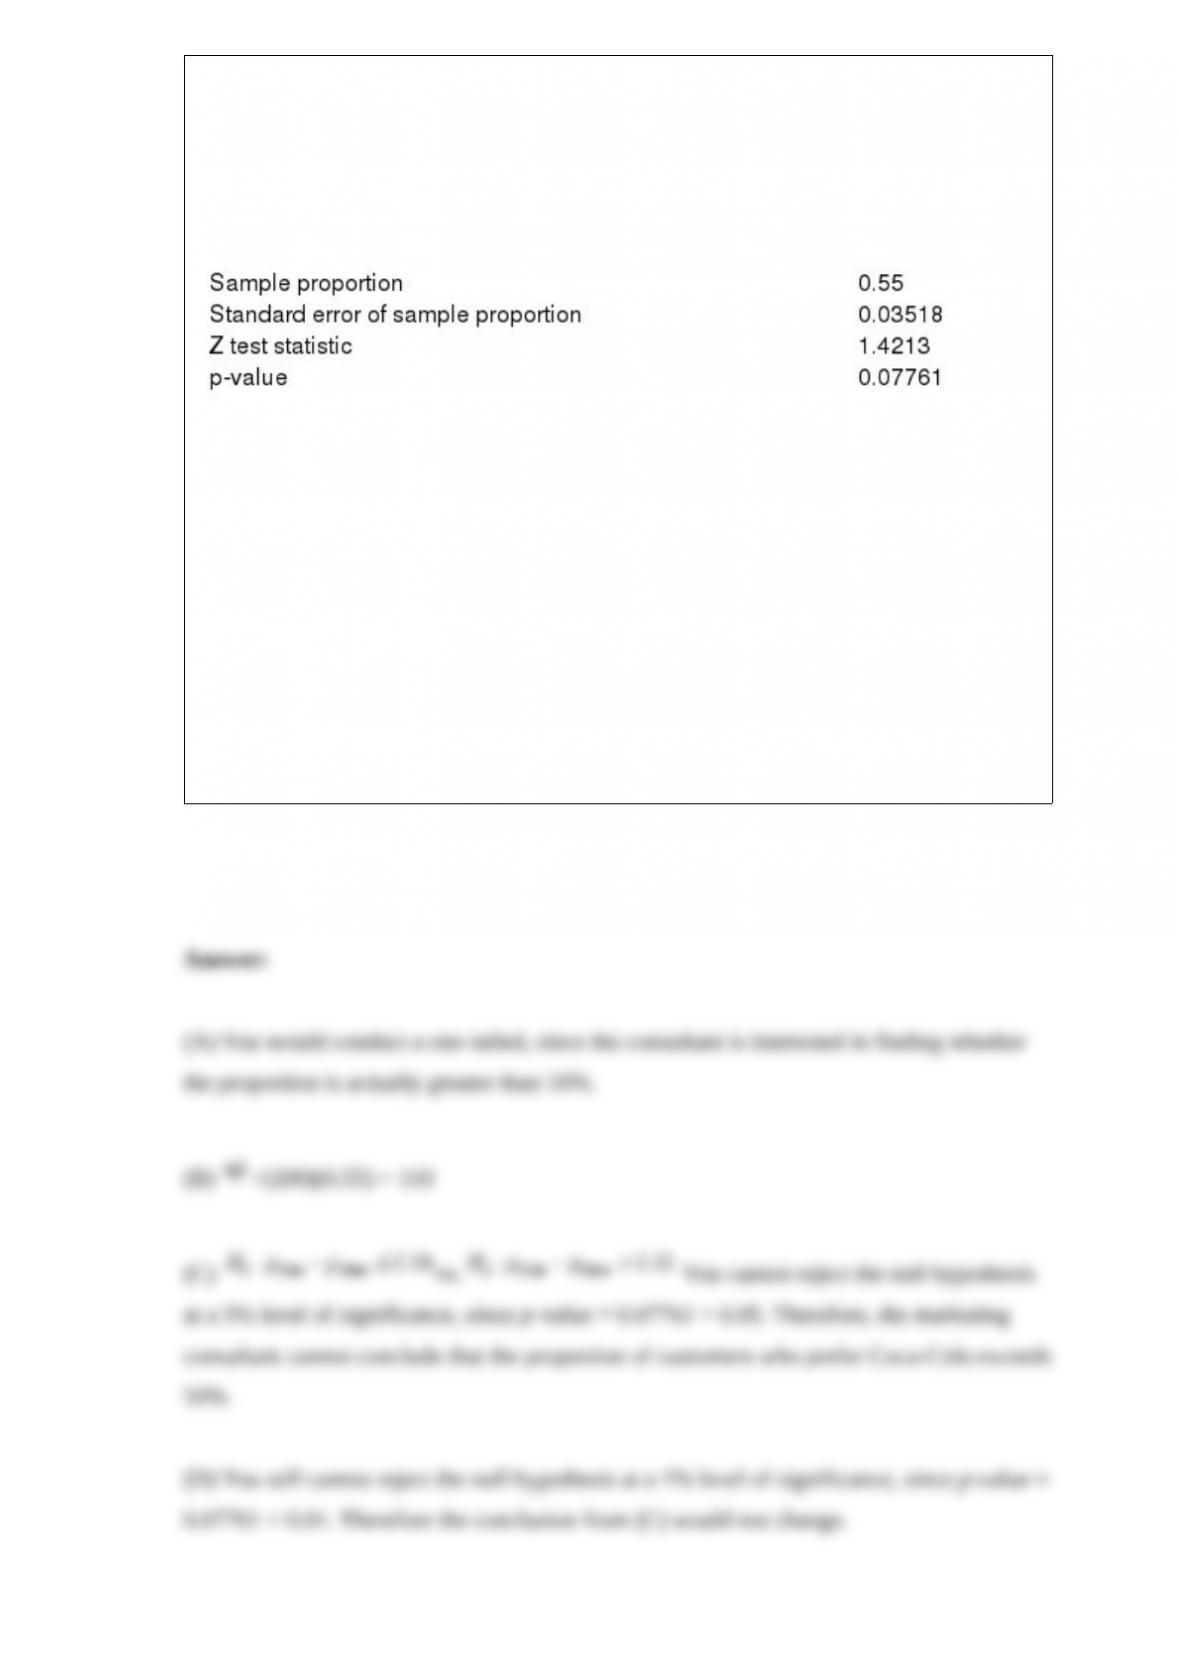
A marketing research consultant hired by Coca-Cola is interested in determining if the
proportion of customers who prefer Coke to other brands is over 50%. A random
sample of 200 consumers was selected from the market under investigation, 55%
favored Coca-Cola over other brands. Additional information is presented below.
NARREND
(A) If you were to conduct a hypothesis test to determine if greater than 50% of
customers prefer Coca-Cola to other brands, would you conduct a one-tail or a two-tail
hypothesis test? Explain your answer.
(B) How many customers out of the 200 sampled must have favored Coke in this case?
(C) Using a 5% significance level, can the marketing consultant conclude that the
proportion of customers who prefer Coca-Cola exceeds 50%? Explain your answer.
(D) If you were to use a 1% significance level, would the conclusion from Question
82change? Explain your answer.

Which of the following statements are true?
a. Three important themes run through the book. Two of them are in the title: data
analysis and decision making. The third is dealing with uncertainty.
b. Data analysis includes data description, data inference, and the search for
relationships in data
c. Decision making includes optimization techniques for problems with no uncertainty,
decision analysis for problems with uncertainty, and structured sensitivity analysis.
d. Dealing with uncertainty includes measuring uncertainty and modeling uncertainty
explicitly into the analysis.
e. All of these options
NARRBEGIN: SA_83_87
THE FOLLOWING ITEMS REQUIRE THE USE OF EXCEL:
NARREND
(A) Compute has a t-distribution with 15 degrees of freedom.
(B) Compute has a t-distribution with 150 degrees of freedom.
(C) How do you explain the difference between the results obtained in (A) and (B)?
(D) Compute where Z is a standard normal random variable.
(E) Compare the results of (D) to the results obtained in (A) and (B). How do you
explain the difference in these probabilities?

NARRBEGIN: SA_104_106
A large retailer has purchased 10,000 DVDs. The retailer is assured by the supplier that
the shipment contains no more than 1% defective DVDs (according to agreed
specifications). To check the supplier’s claim, the retailer randomly selects 100 DVDs
and finds six of the 100 to be defective.
NARREND
(A) Assuming the supplier’s claim is true, compute the mean and the standard deviation
of the number of defective DVDs in the sample.
(B) Based on your answer to (A), is it likely that as many as six DVDs would be found
to be defective, if the claim is correct?
(C) Suppose that six DVDs are indeed found to be defective. Based on your answer to
(A), what might be a reasonable inference about the manufacturer’s claim for this
shipment of 10,000 DVDs?

The chi-square goodness-of-fit test can be used to test for:
a. significance of sample statistics
b. difference between population means
c. normality
d. difference between population variances
NARRBEGIN: SA_66_68
A construction company has obtained a contract for a highway project and will need to
lease an additional road grader for a month to fill out its equipment fleet. The company
is trying to decide between two different lease options for the grader: 1) lease an older
grader for $8,500, or 2) lease a newer grader for $10,000. The newer grader is still
under warranty, so the lease cost covers all repair expenses. However, the company
would be responsible for any repair expenses if it leases the older grader. The
construction company’s maintenance foreman believes there is a 30% chance that there
will be no need for repairs with the older grader, but also thinks there is a 45% chance
that some repairs ($2,000) could be needed, and a 25% chance that significant repairs
($5,000) might be required.
NARREND
(A) Construct a decision tree to help the company make its decision. Make sure to label
all decision and chance nodes and include appropriate costs, payoffs and probabilities.
(B) What is the best lease option? Why?
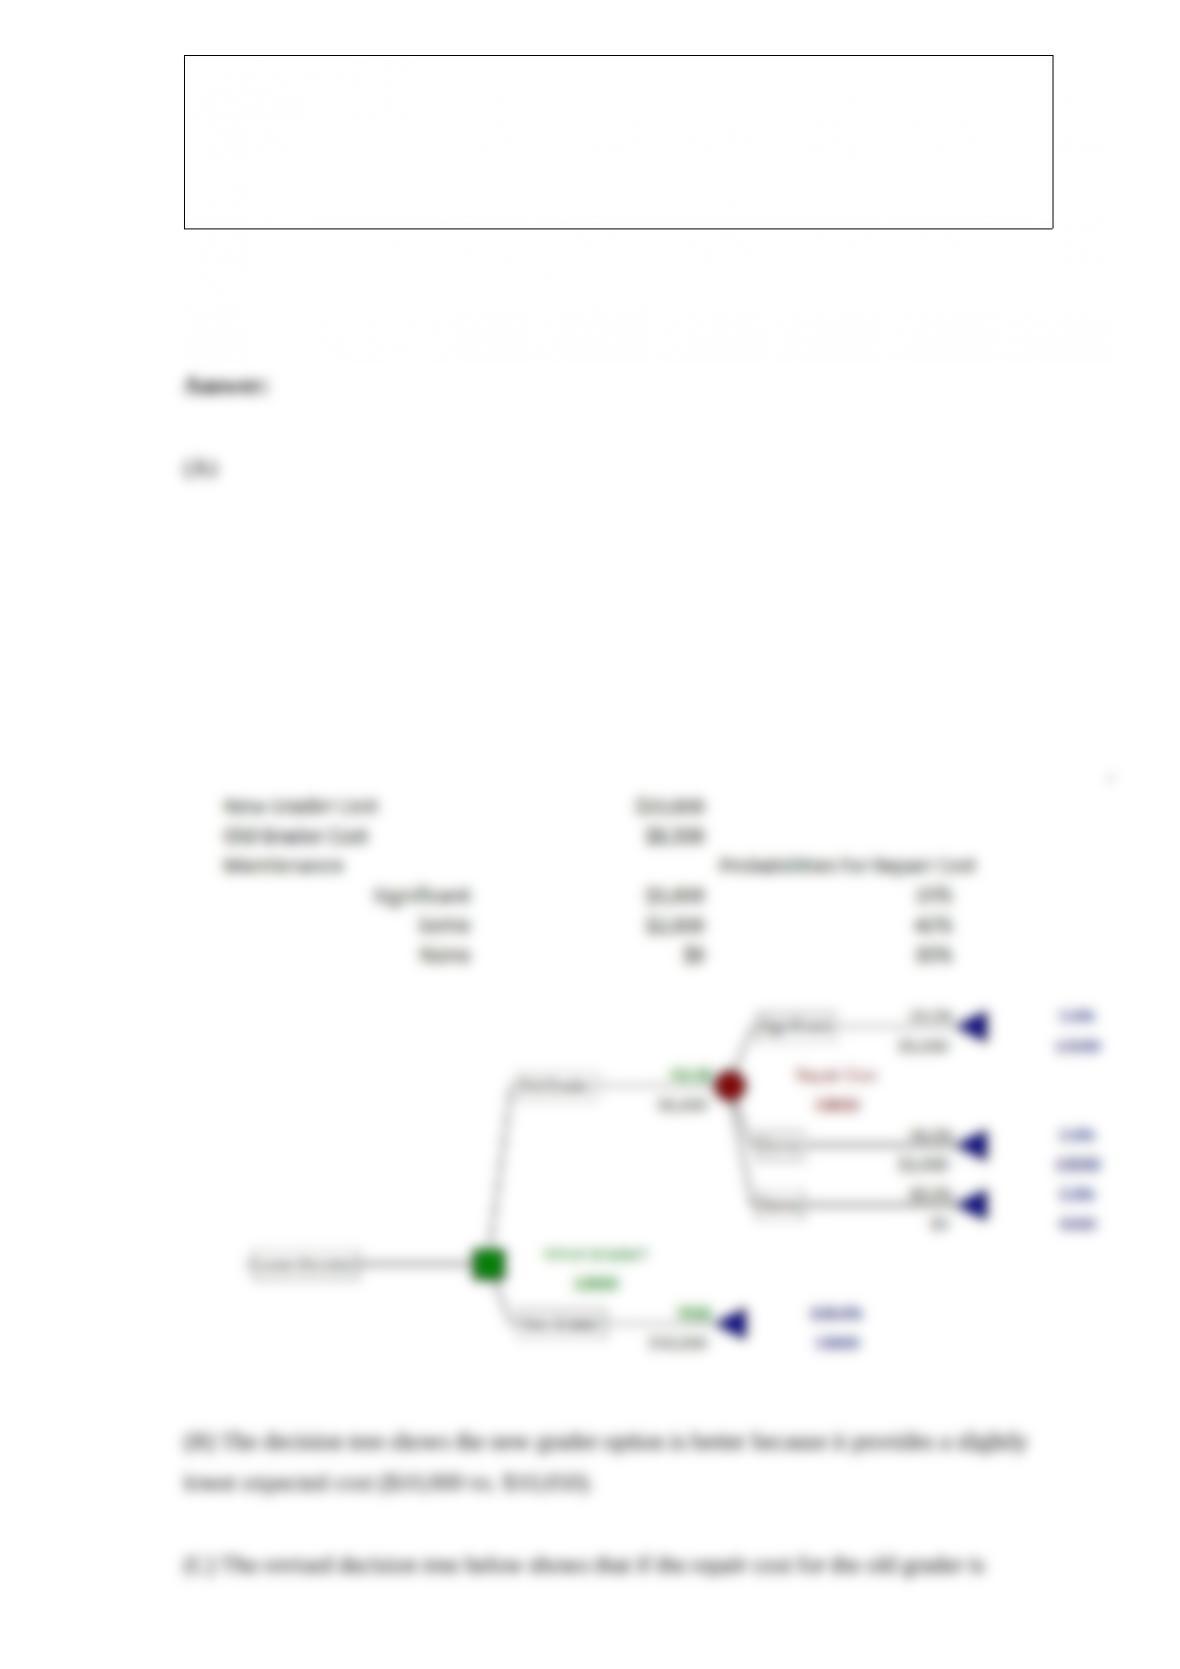
(C) Suppose the company could hire an experienced mechanic to inspect the old grader
to determine the repair cost before the company makes its final decision. If the
mechanic is always correct in his assessments, what is the most the company would pay
for the inspection?
NARRBEGIN: SA_82_87
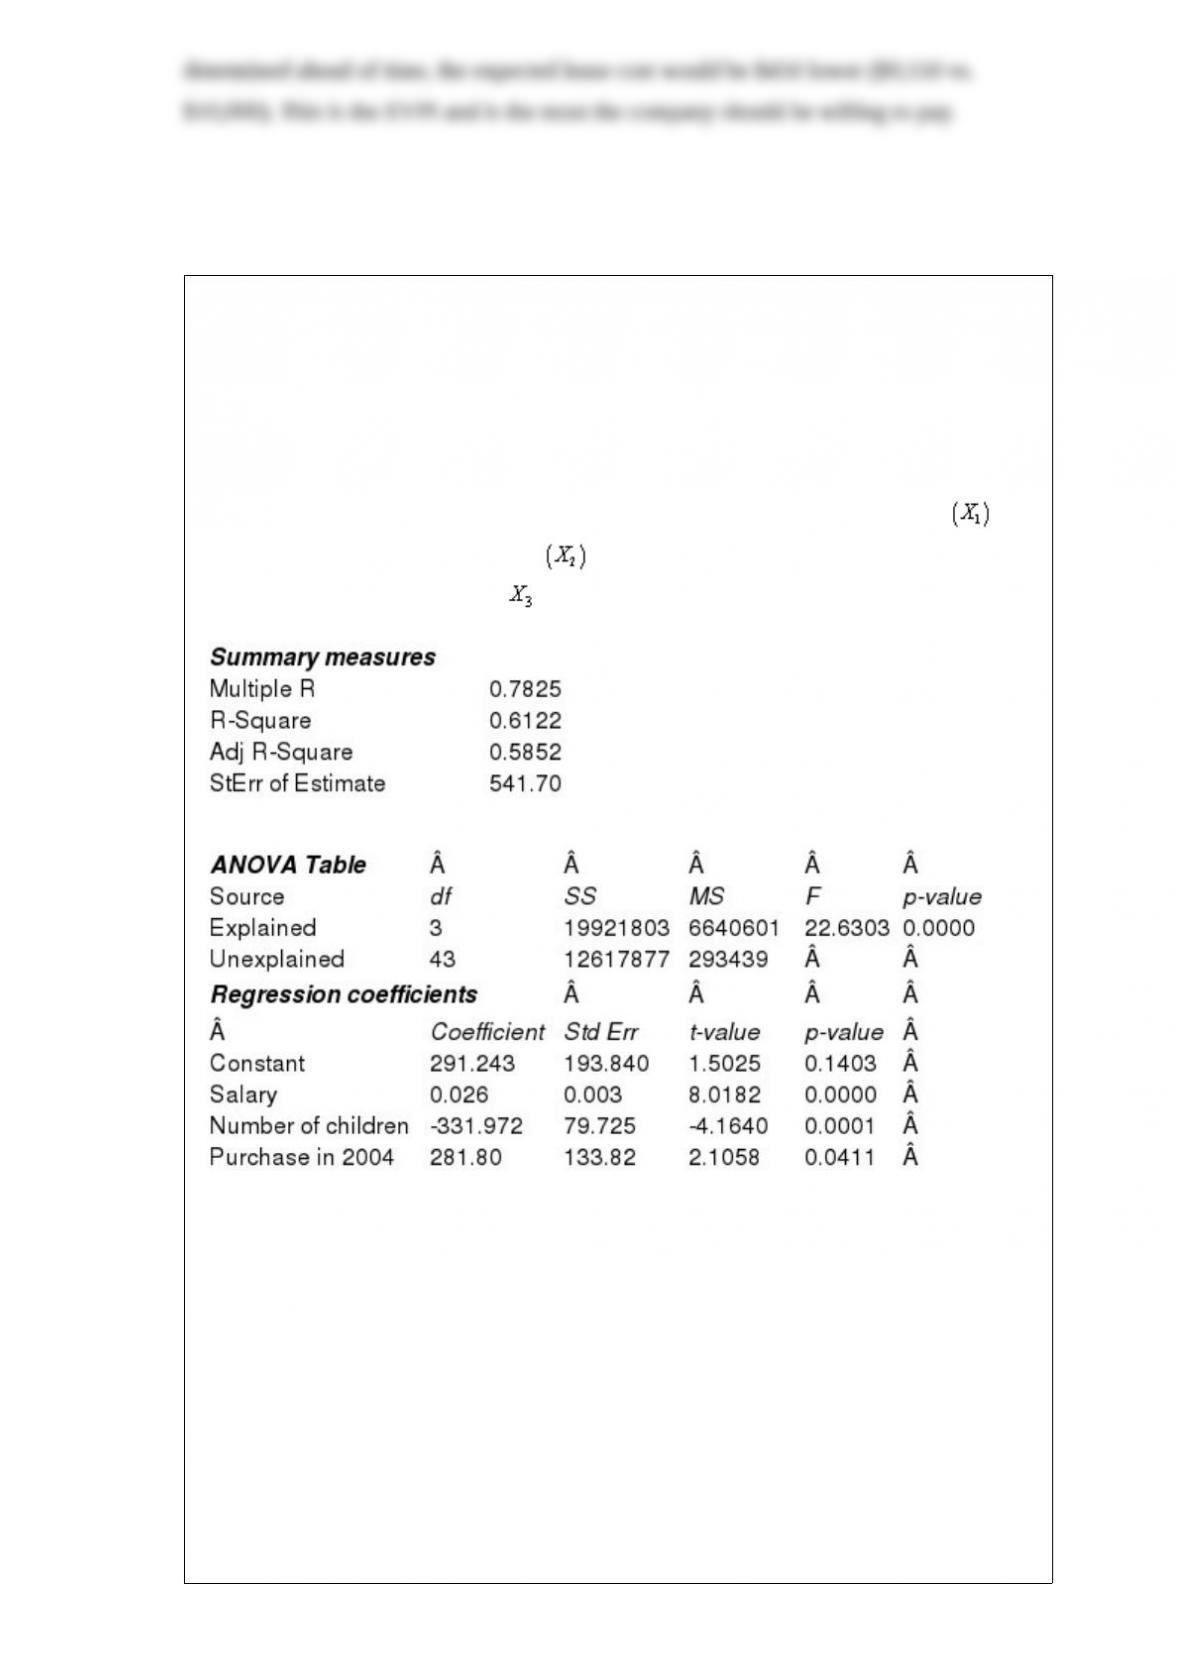
An internet-based retail company that specializes in audio and visual equipment is
interested in creating a model to determine the amount of money, in dollars, its
customers will spend purchasing products from them in the coming year. In order to
create a reliable model, this company has tracked a number of variables on its
customers. Below you will find the Excel output related to several of these variables.
This company has tried using the customer’s annual salary for entire household , the
number of children in the household , and if the customer purchased merchandise
from them in the previous year ( in 2004).
NARREND
(A) Estimate the regression model. How well does this model fit the data?
(B) Is there a linear relationship between the explanatory variables and the dependent
variable? Explain how you arrived at your answer at the 5% significance level.
(C) Use the estimated regression model to predict the amount of money a customer will
spend if their annual salary is $45,000, they have 1 child and they were a customer that
purchased merchandise in the previous year (2004).
(D) Find a 95% prediction interval for the point prediction calculated in (C). Use a
t-multiple = 2.02.
(E) Find a 95% confidence interval for the amount of money spent by all customers
sharing the characteristics described in (C). Use a t-multiple = 2.02.
(F) How do you explain the differences between the widths of the intervals in (D) and
(E)?
NARRBEGIN: SA_122_123
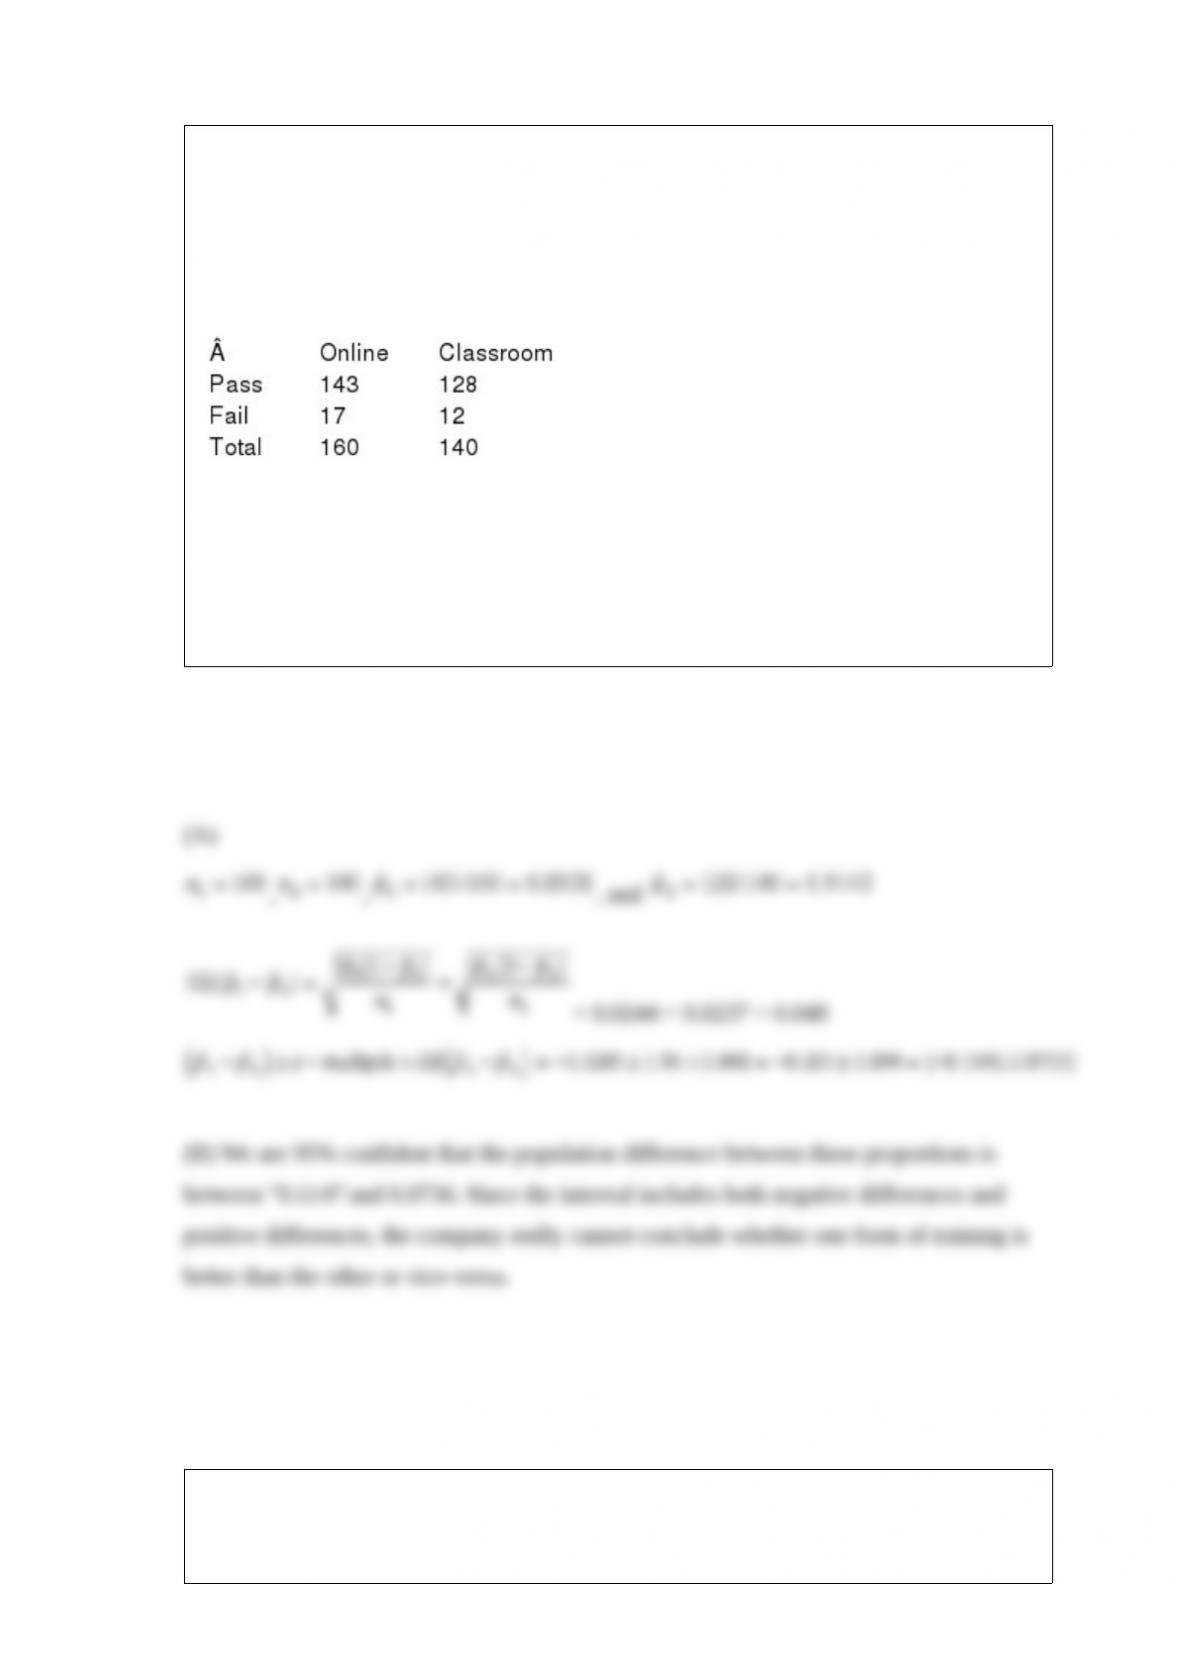
A defensive driving training company is interested in evaluating the relative
effectiveness of its two main modes of training; online and traditional classroom. The
company has collected a random sample of 300 customers in a particular area, with the
following results:
NARREND
(A) Construct a 95% confidence interval for the difference between the proportions of
online and classroom customers who pass the final exam.
(B) Interpret the confidence interval obtained in (A).
A the correlation is close to 0, then we expect to see
a. An upward sloping cluster of points on the scatterplot

b. A downward sloping cluster of points
c. A cluster of points around a trendline
d. A cluster of points with no apparent relationship
e. We cannot say what the scatterplot should look like based on the correlation
Data analysis includes
a. data description
b. data inference
c. the search for relationships in data
d. All of these options
Which of the following does not represent a broad class of applications of linear
programming models?
a. Blending models
b. Financial portfolio models
c. Logistics models
d. Set covering models
e. Forecasting models

An unbiased estimator is a:
a. sample statistic used to approximate a population parameter
b. sample statistic, which has an expected value equal to the value of the population
parameter
c. sample statistic whose value is usually less than the population parameter
d. standard error of the mean
Which of the following would notbe included under data analysis?
a. Measuring uncertainty
b. Data description
c. Data inference
d. Search for relationships

A list of all members of the population is called a:
a. sampling unit
b. probability sample
c. frame
d. relevant population
The accuracy of the point estimate is measured by its:
a. standard deviation
b. standard error
c. sampling error
d. nonsampling error
The error term represents the vertical distance from any point to the
a. estimated regression line
b. population regression line
c. value of the Y‘s
d. mean value of the X’s
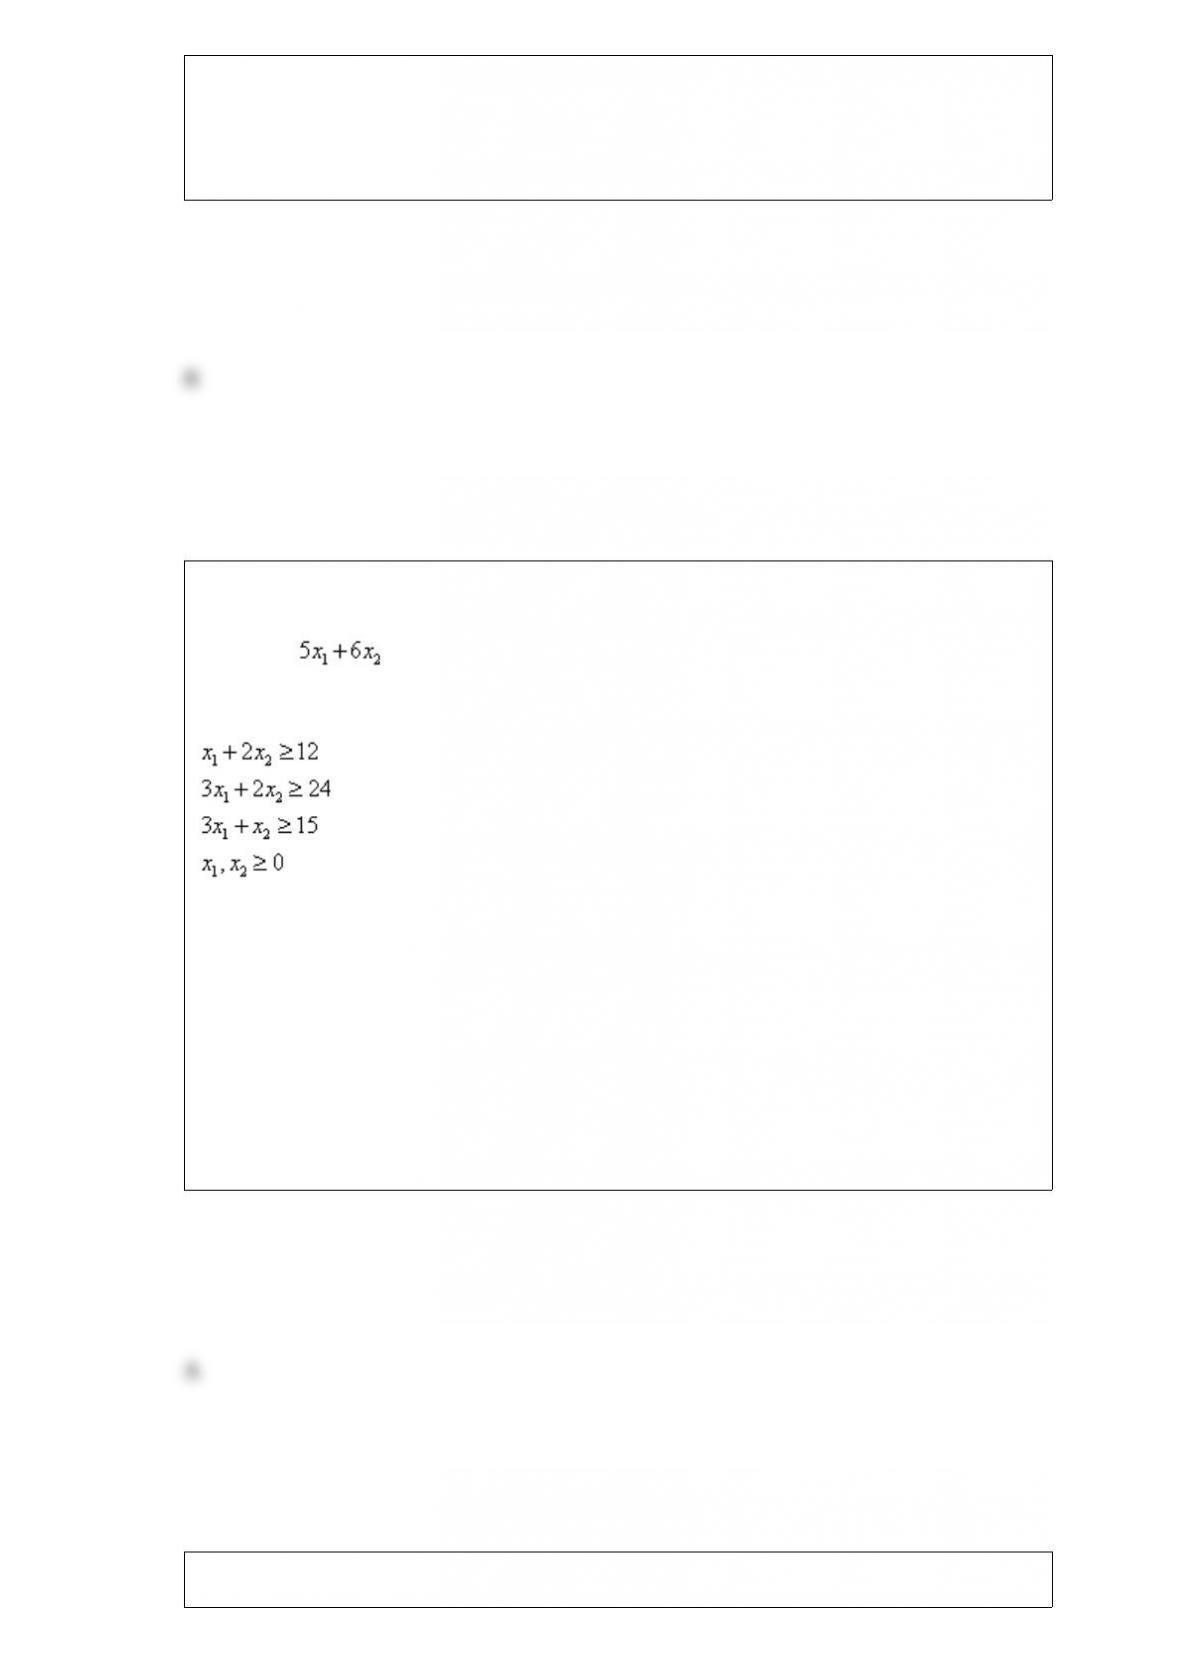
Consider the following linear programming problem:
Minimize
Subject to
The above linear programming problem:
a. has only one optimal solution
b. has more than one optimal solution
c. exhibits infeasibility
d. exhibits unboundedness
In a random walk model the

a. series itself is random
b. series itself is not random but its differences are random
c. series itself and its differences are random
d. series itself and its differences are not random
If A and B are mutually exclusive events with P(A) = 0.70, then P(B):
a. can be any value between 0 and 1
b. can be any value between 0 and 0.70
c. cannot be larger than 0.30
d. Cannot be determined with the information given
NARRBEGIN: SA_99_102
We are trying to determine the proper capacity level for a new electric car. A unit of
capacity gives us the potential to produce one car per year. It costs $10,000 to build a
unit of capacity and the cost is charged equally over the next 5 years. It also costs $400
per year to maintain a unit of capacity (whether or not it is used). Each car sells for
$14,000 and incurs a variable production cost of $10,000. The annual demand for the
electric car during each of the next 5 years is believed to be normally distributed with

mean 500,000 and standard deviation 100,000. The demands during different years are
assumed to be independent. Profits are discounted at a 10% annual interest rate. We are
working with a 5-year planning horizon. Capacity levels of 300,000, 400,000, 500,000,
600,000, and 700,000 are under consideration. (Assume that no more than the demand
is ever produced, so that no ending inventory ever occurs.)
NARREND
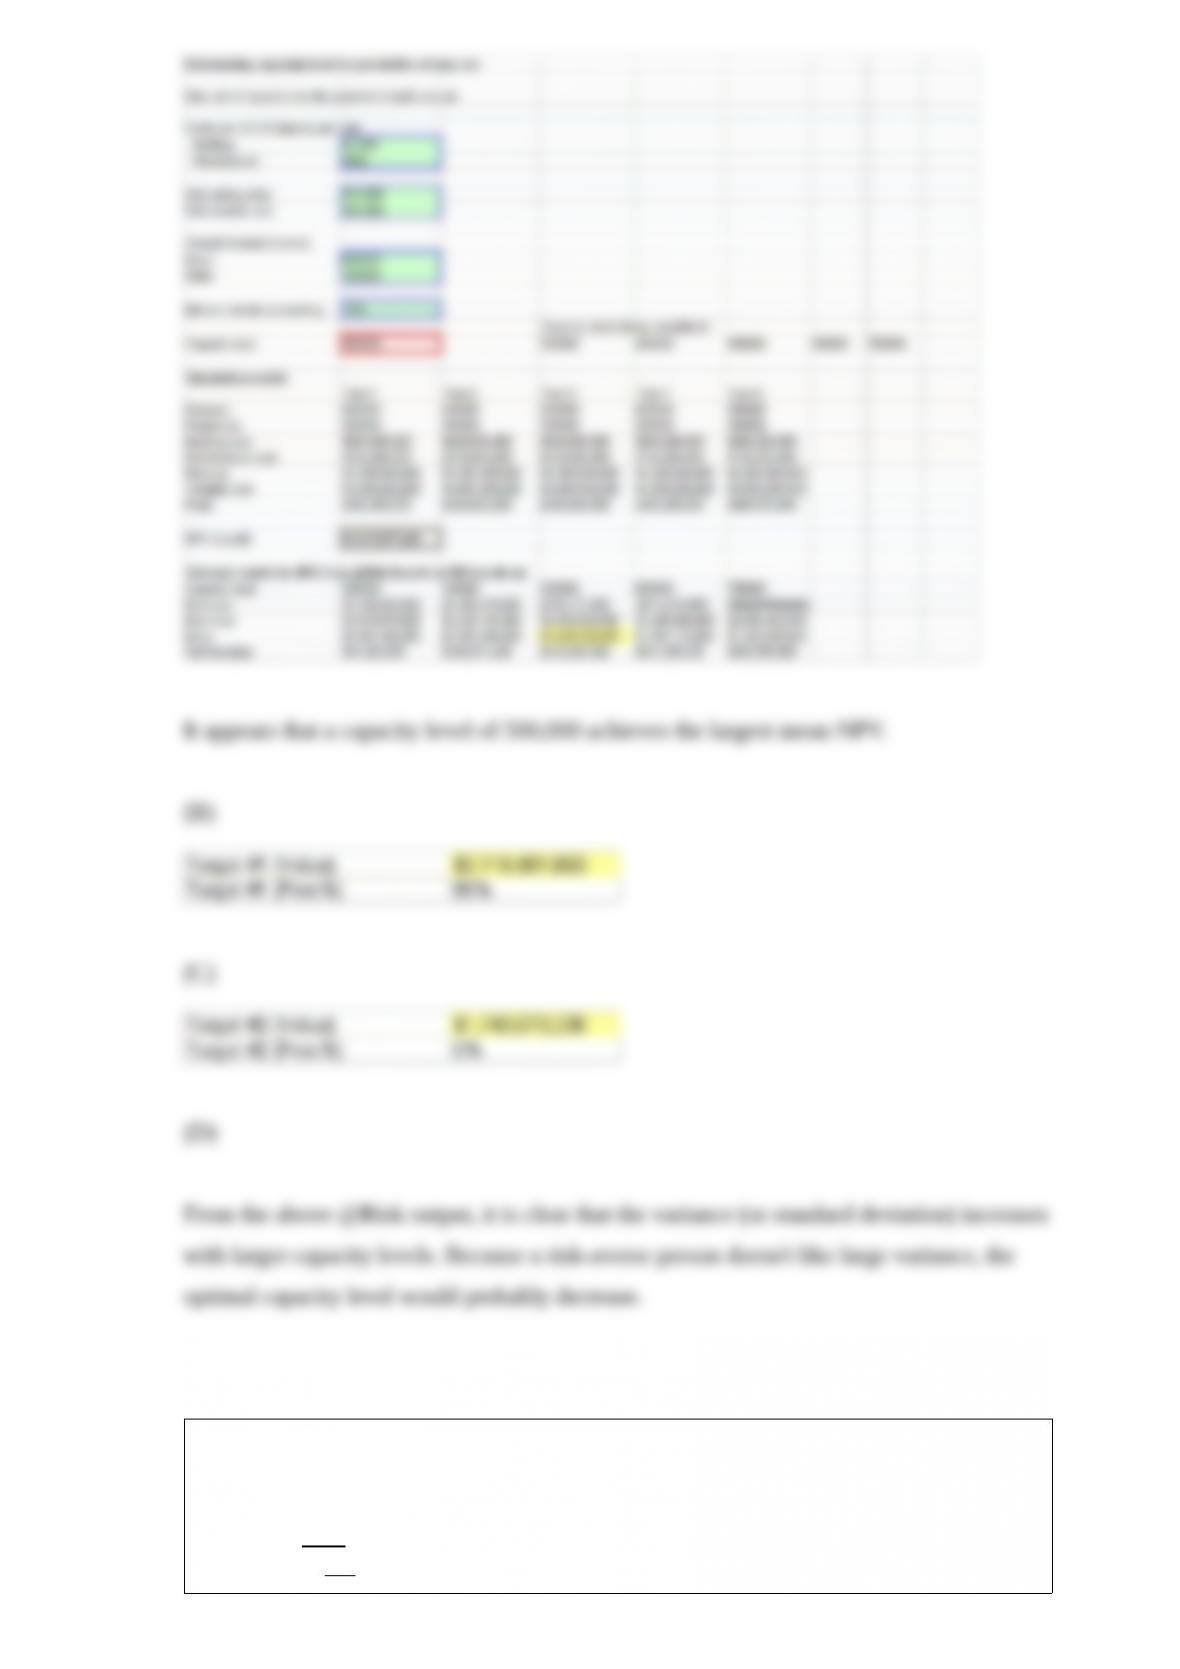
(A) Assuming we are risk neutral, use simulation to find the optimal capacity level.
(B) Using the answer to (A), there a 5% chance that the actual discounted profit will
exceed what value?
(C) Using the answer to (A), there is a 5% chance that the actual discounted profit will
be less than what value?
(D) If we are risk averse, how might the optimal capacity level change?
Which of the following statements are true regarding the chi ” square goodness-of-fit
test for normality?
a. The test doesdepend on which and how many categories we use for the histogram.
b. The test is notvery effective unless the sample size is large, say, at least 80 or 100.
c. The test tends to be toosensitive if the sample size is really large.
d. None of these options
e. All of these options
NARRBEGIN: SA_114_118
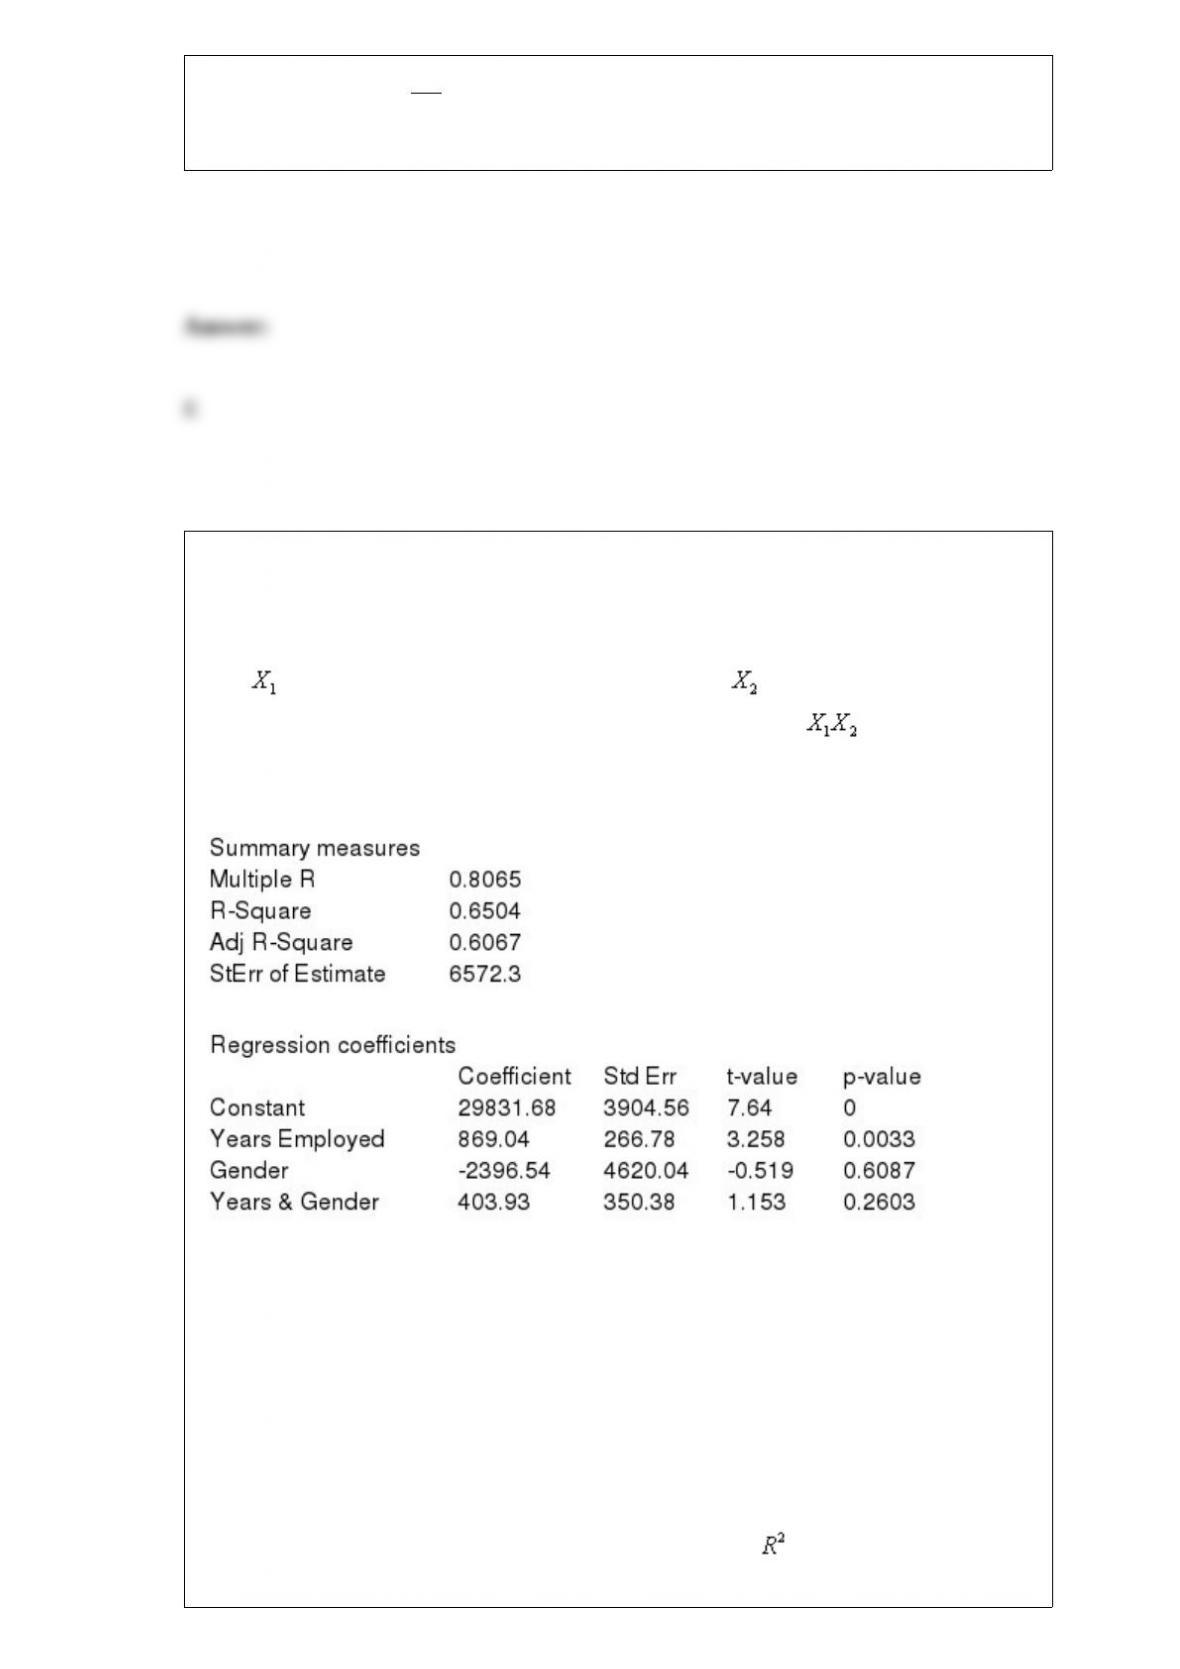
The human resource manager at Gamma, Inc. wants to examine the relationship
between annual salaries (Y), the number of years employees have worked at Gamma,
Inc. ( ) and whether the employee is male or female ( ). They are also interested in
whether the interaction between the two explanatory variables ( ) has a significant
impact on salaries. These data have been collected for a sample of 28 employees and
the regression output is shown below.
NARREND
(A) Use the information above to estimate the linear regression model.
(B) Write the regression equation in (A) as two separate equations; one for females and
one for males, and interpret the results.
(C) Would any of the variables in the linear regression model in (A) be considered a
dummy variable? Explain your answer.
(D) Identify and interpret the coefficient of determination ( ) for the model in (A).
(E) Identify and interpret the standard error of estimate (se) for the model in (A).
NARRBEGIN: SA_118_122
Southport Mining Corporation is considering a new mining venture in Indonesia. There
are two uncertainties associated with this prospect; the metallurgical properties of the
ore and the net price (market price minus mining and transportation costs) of the ore in
the future.
The metallurgical properties of the ore would be classified as either “high grade” or
“low grade”. Southport’s geologists have estimated that there is a 70% chance that the
ore will be “high grade”, and otherwise, it will be “low grade”. Depending on the net
price, both ore classifications could be commercially successful.
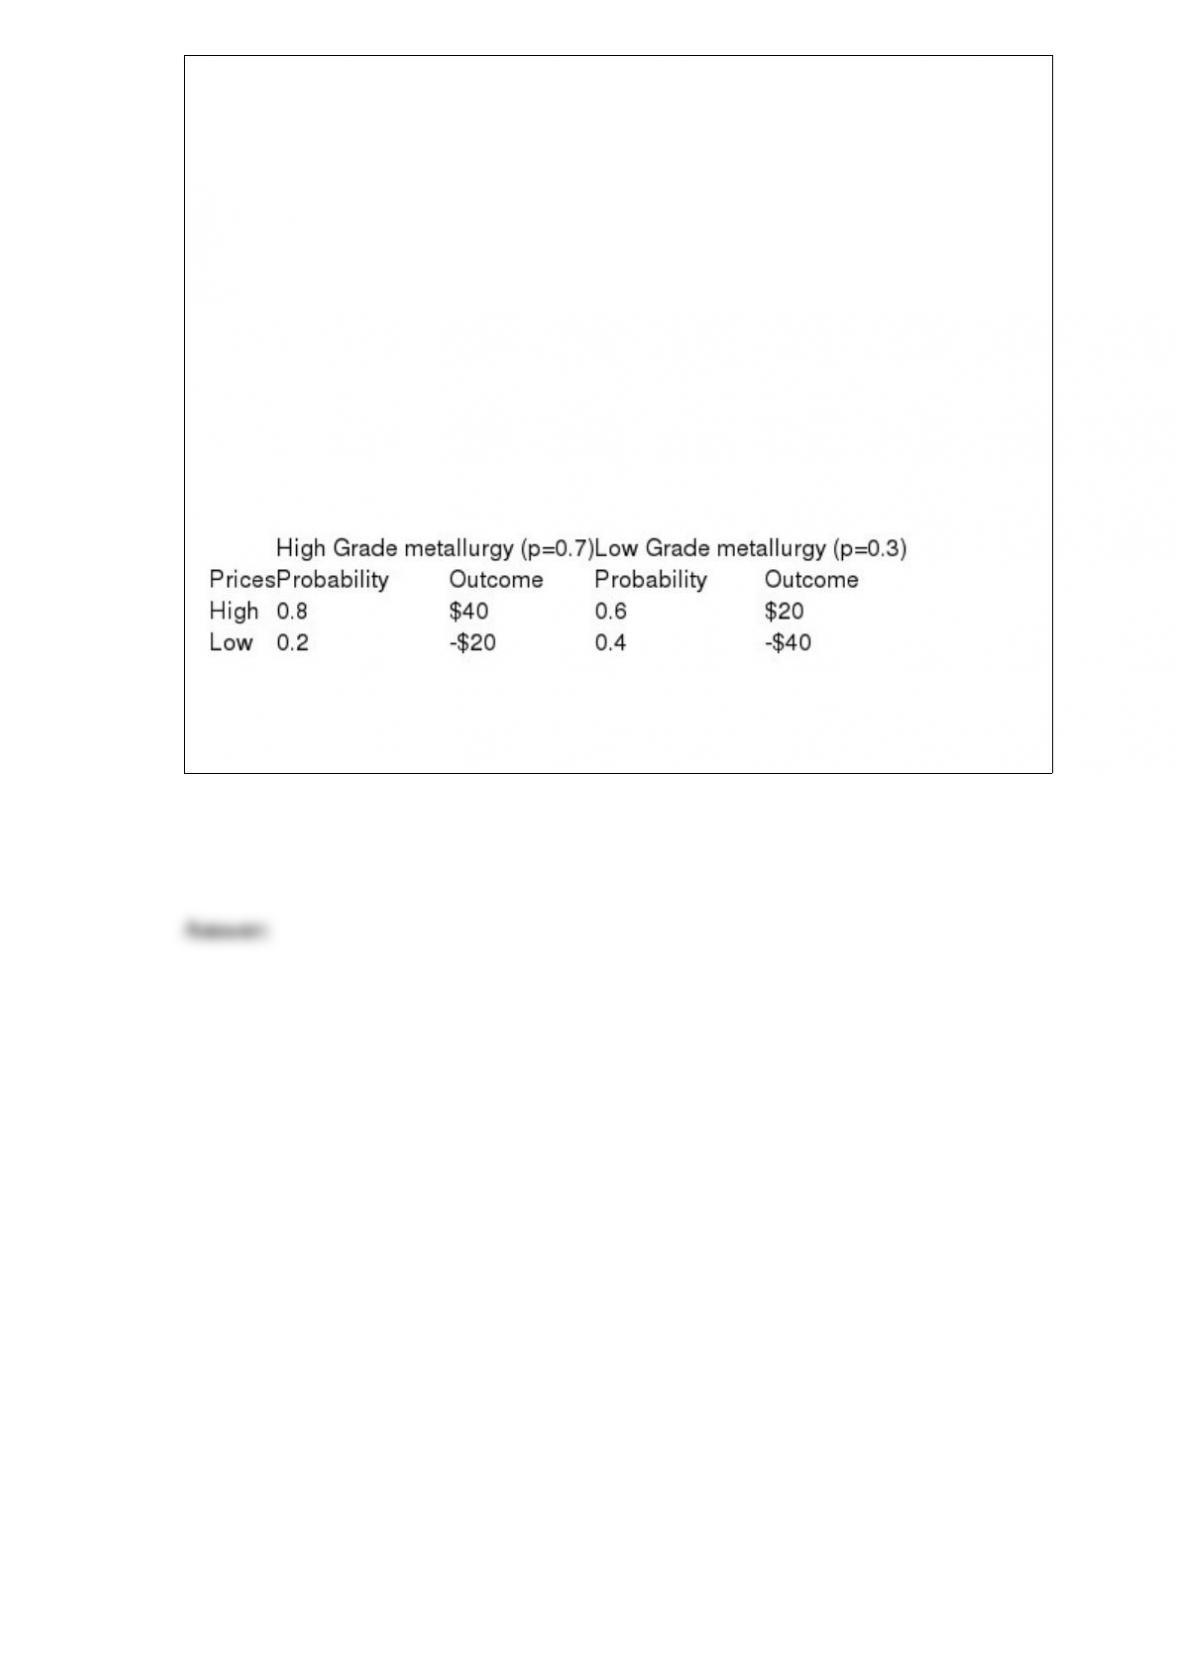
The anticipated net prices depended on market conditions, and also on the metallurgical
properties of the ore. Southport’s economists have simplified the continuous distribution
of possible prices into a two-outcome discrete distribution (“high” or “low” net price)
for the investment analysis. The probabilities of these net prices, and the associated
outcomes (in millions of dollars), are summarized below.
NARREND
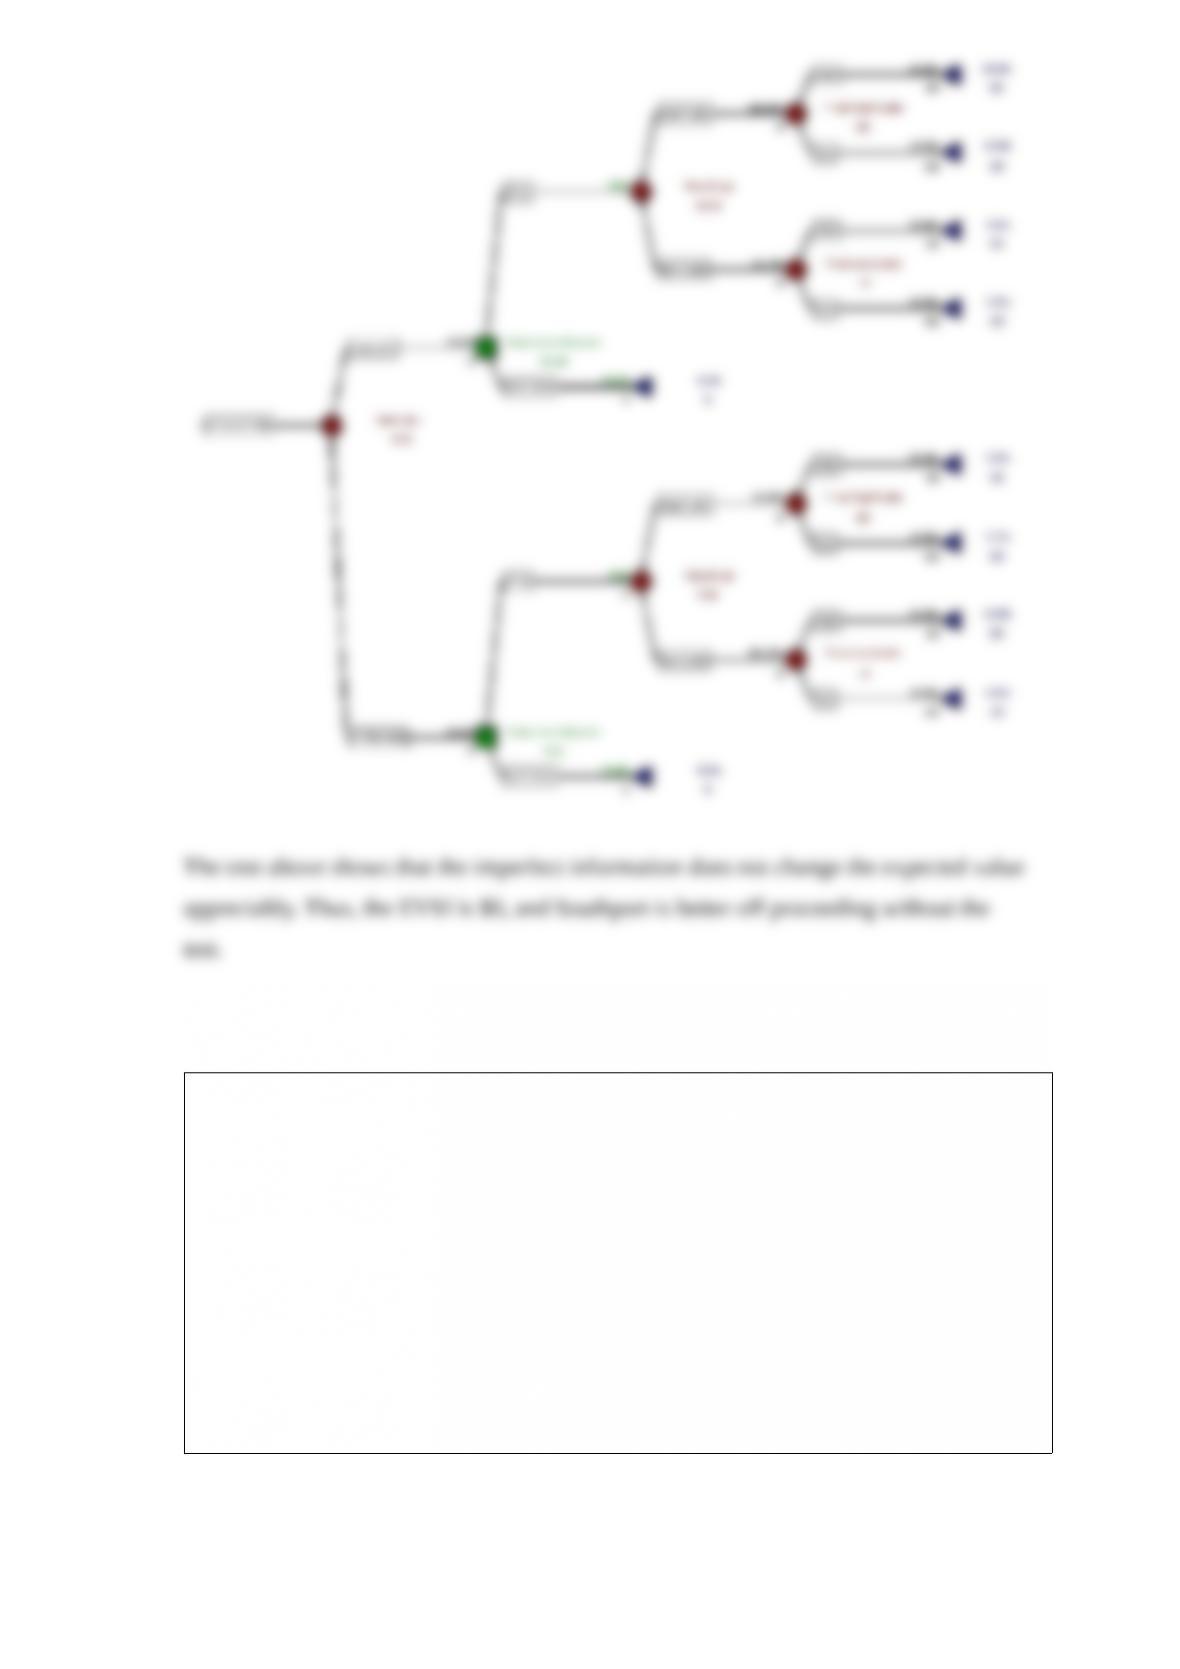
Should Southport conduct the imperfect core test if it costs $250,000?
Expected monetary value (EMV) is:
a. the average or expected value of the decision if you knew what would happen ahead
of time
b. the weighted average of possible monetary values, weighted by their probabilities
c. the average or expected value of the information if it was completely accurate
d. the amount that you would lose by not picking the best alternative
e. a decision criterion that places an equal amount on all states of nature

Which of the following statements is a type of constraint that is often required in
blending problems?
a. Integer constraint
b. Binary constraint
c. Quality constraint
d. None of these options
Which of the following are not among the marketing applications of simulation?
a. The entry of new brands into the market
b. Customer preferences for different attributes of products
c. Brand-switching behavior of customers
d. The effect of advertising on sales
e. None of these options

Which of the following functions is often required in simulations where we must model
a process over multiple time periods and must deal with uncertain timing of events?
a. RISKMIN
b. RISKMAX
c. NPV
d. IF
e. None of these options
The limitation of covariance as a descriptive measure of association is that it
a. Only captures positive relationships
b. Does not capture the units of the variables
c. Is very sensitive to the units of the variables
d. Is invalid if one of the variables is categorical
e. None of these options
The amount of variability of a financial output caused by different inputs can be
investigated using:

a. the NPV function
b. a histogram of the NPV
c. a tornado chart of NPV
d. the value at risk (VAR)
e. All of these options
Given that Z is a standard normal variable, the value z for which P(Z z) = 0.2580 is
a. 0.70
b. 0.758
c. -0.65
d. 0.242
Which of the following statements are true?
a. Probabilities must be nonnegative
b. Probabilities must be less than or equal to 1

c. The sum of all probabilities for a random variable must be equal to 1
d. All of these options are true.
NARRBEGIN: SA_86_91
In this example we are estimating the net present value of introducing a new drug to
market. We have the following information about the market:
The market size is 1,000,000 and is projected to grow at an average 5%, with a standard
deviation of 1%, over the next ten years.
The market share captured at entry is projected to be between 20% and 70%, with most
likely value 40%.
Three competitors may enter the market in the future, with each one having a 40%
probability of entry per year.
For each new competitor per year, the market share goes down by 20%.
The marginal profit per unit is $1.80.
We want to evaluate the project over ten years, using a discount rate of 10%.
NARREND
Suppose this new drug will cost $3 million to develop. What is the chance that we could
loose money on this project?
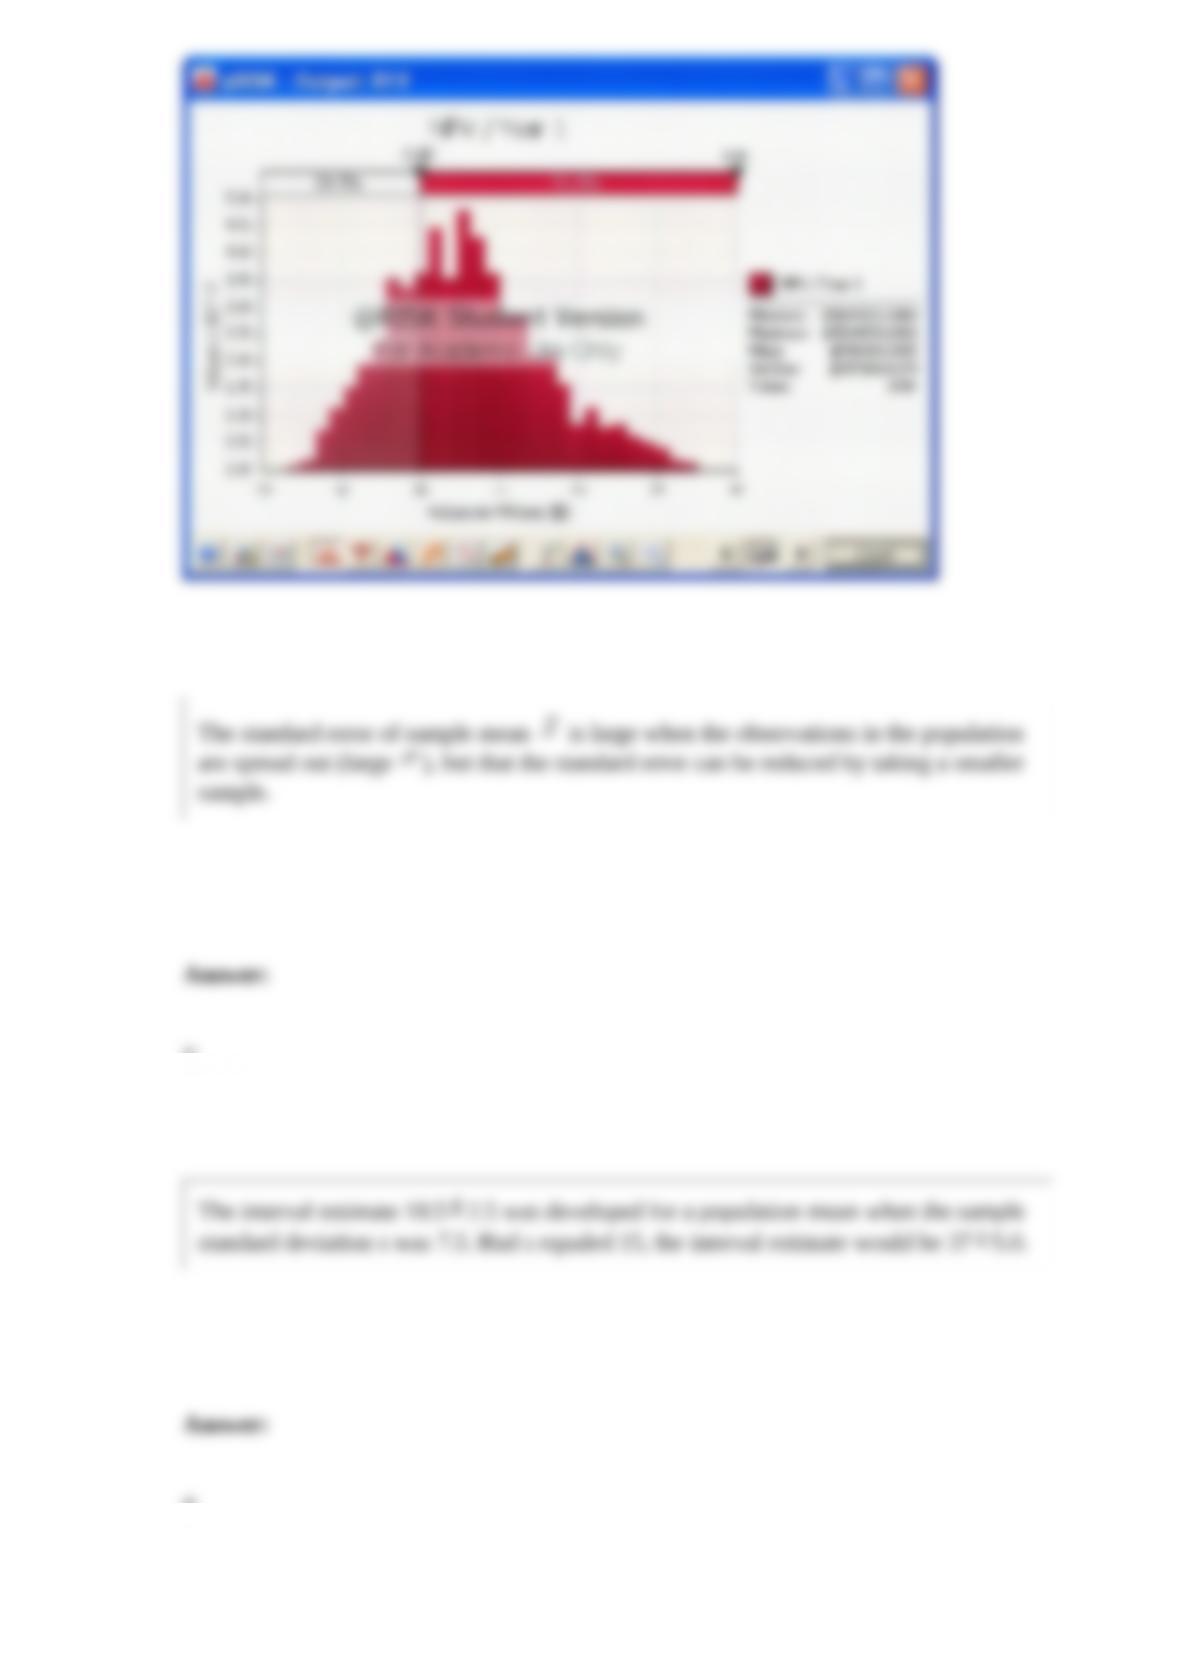
The interval estimate 18.5 2.5 was developed for a population mean when the sample
standard deviation s was 7.5. Had s equaled 15, the interval estimate would be 37 5.0.
You have been assigned to determine whether more people prefer Coke to Pepsi.
Assume that roughly half the population prefers Coke and half prefers Pepsi. How large
a sample would you need to take to ensure that you could estimate, with 95%
confidence, the proportion of people preferring Coke within 3% of the actual value?
Two or more events are said to be exhaustive if one of them must occur.
NARRBEGIN: SA_108_112
The following values have been calculated using the TDIST and TINV functions in
Excel. These values come from a t- distribution with 15 degrees of freedom.
These values represent the probability to the right of the given positive values.
These values represent the positive t- value for a given probability in both tails (sum of
both tails).
NARREND
What is the probability of a t-value smaller than 1.00?
An autocorrelation is a type of correlation used to measure whether the values of a time
series are related to their own past values.
NARRBEGIN: SA_56_61
A popular retail store knows that the distribution of purchase amounts by its customers
is approximately normal with a mean of $30 and a standard deviation of $9. Below you
will find normal probability and percentile calculations related to the customer purchase
amounts.
Probability Calculations
P(Sales < $ 15.00) = 0.048, P(Sales < $ 20.00) = 0.133,
P(Sales < $ 25.00) = 0.289, P(Sales < $ 35.00) = 0.711
Percentiles Calculations
1st Percentile = $9.06, 5th Percentile = $15.20,
95th Percentile = $44.80, 99th Percentile = $50.94
NARREND
What is the probability that a randomly selected customer will spend less than $15?
NARRBEGIN: SA_105_108
An executive has been offered a compensation package that includes stock options. The
current stock price is $30/share, and she has been offered a call option on 2000 shares,
which can be exercised five years from now at a price of $42/share. Therefore, if the
market price of the shares in five years is more than $42/share, she can buy 2000 shares
at $42/share, and then immediately sell the shares at the market price, earning a riskless
profit. If the market price of the shares was less than $42/share, she will obviously
choose not to exercise the option, and would have zero profit.
Assume the price of the stock can be modeled as exponential growth (compounding),
which could be calculated as:
where,
stock price in next period (i.e., price next year)
current stock price
annual growth rate of the stock price, which has been 10%
annual volatility, which is estimated to be 18%
normal random variable with mean of zero and standard deviation of 1
NARREND
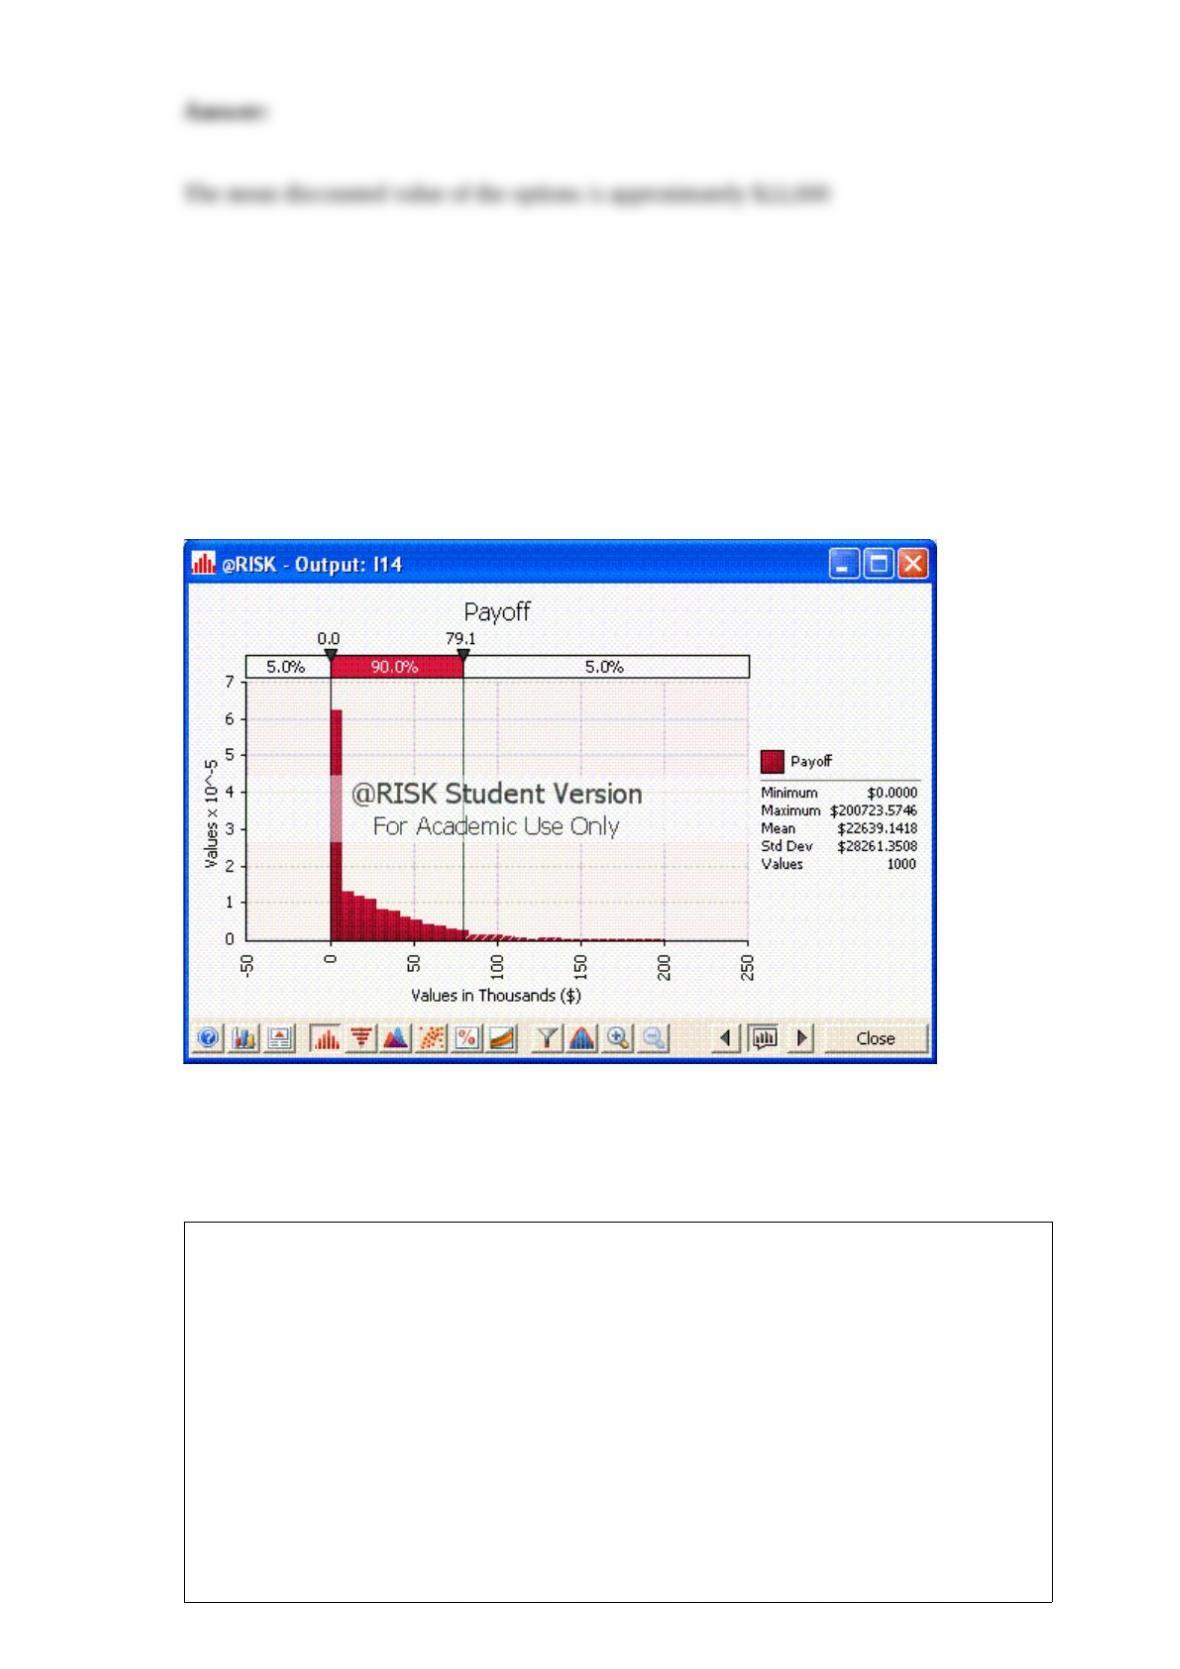
Simulate the price of the stock in five years by calculating five annual increments
(steps) with this model, starting from the current price of $30/share. For each price
simulated five years from now, model the exercise decision and calculate the resulting
profit, which should then be discounted for five years at the current discount rate (5%)
to obtain the present value of the options. What is the expected value of the stock
options?
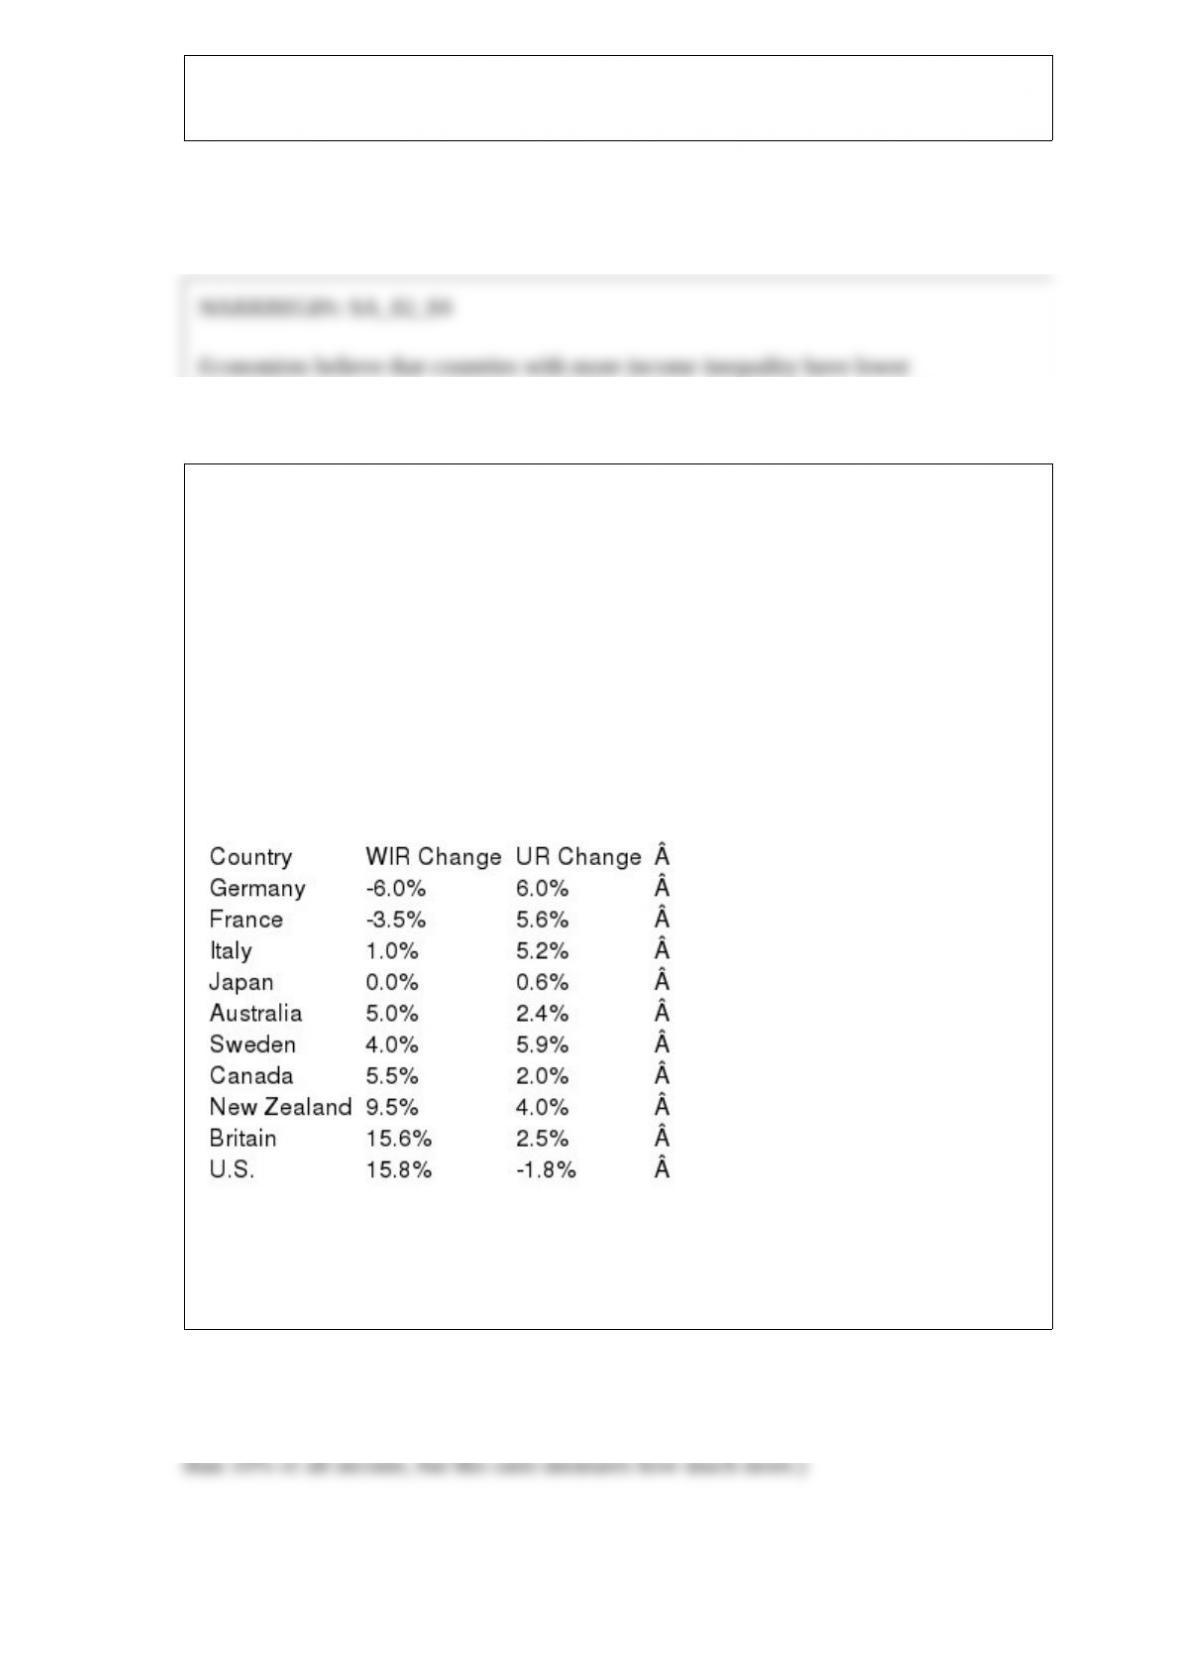
NARRBEGIN: SA_82_84
Economists believe that countries with more income inequality have lower
unemployment rates. An economist in 1996 developed the Table below which contains
the following information for ten countries during the 1980-1995 time period:
The change from 1980 to 1995 in ratio of the average wage of the top 10% of all wage
earners to the median wage
The change from 1980 to 1995 in unemployment rate.
Income inequality vs. Unemployment rate
NARREND
Explain why the ratio of the average wage of the top 10% of all wage earners to the
median measures income inequality.

NARRBEGIN: SA_74_75
Statistics professor has just given a final examination in his statistical inference course.
He is particularly interested in learning how his class of 40 students performed on this
exam. The scores are shown below.
77 81 74 77 79 73 80 85 86 73
83 84 81 73 75 91 76 77 95 76
90 85 92 84 81 64 75 90 78 78
82 78 86 86 82 70 76 78 72 93
NARREND
Explain why the mean and median are different.
What is the probability that no more than two customers are waiting in both lines
combined?
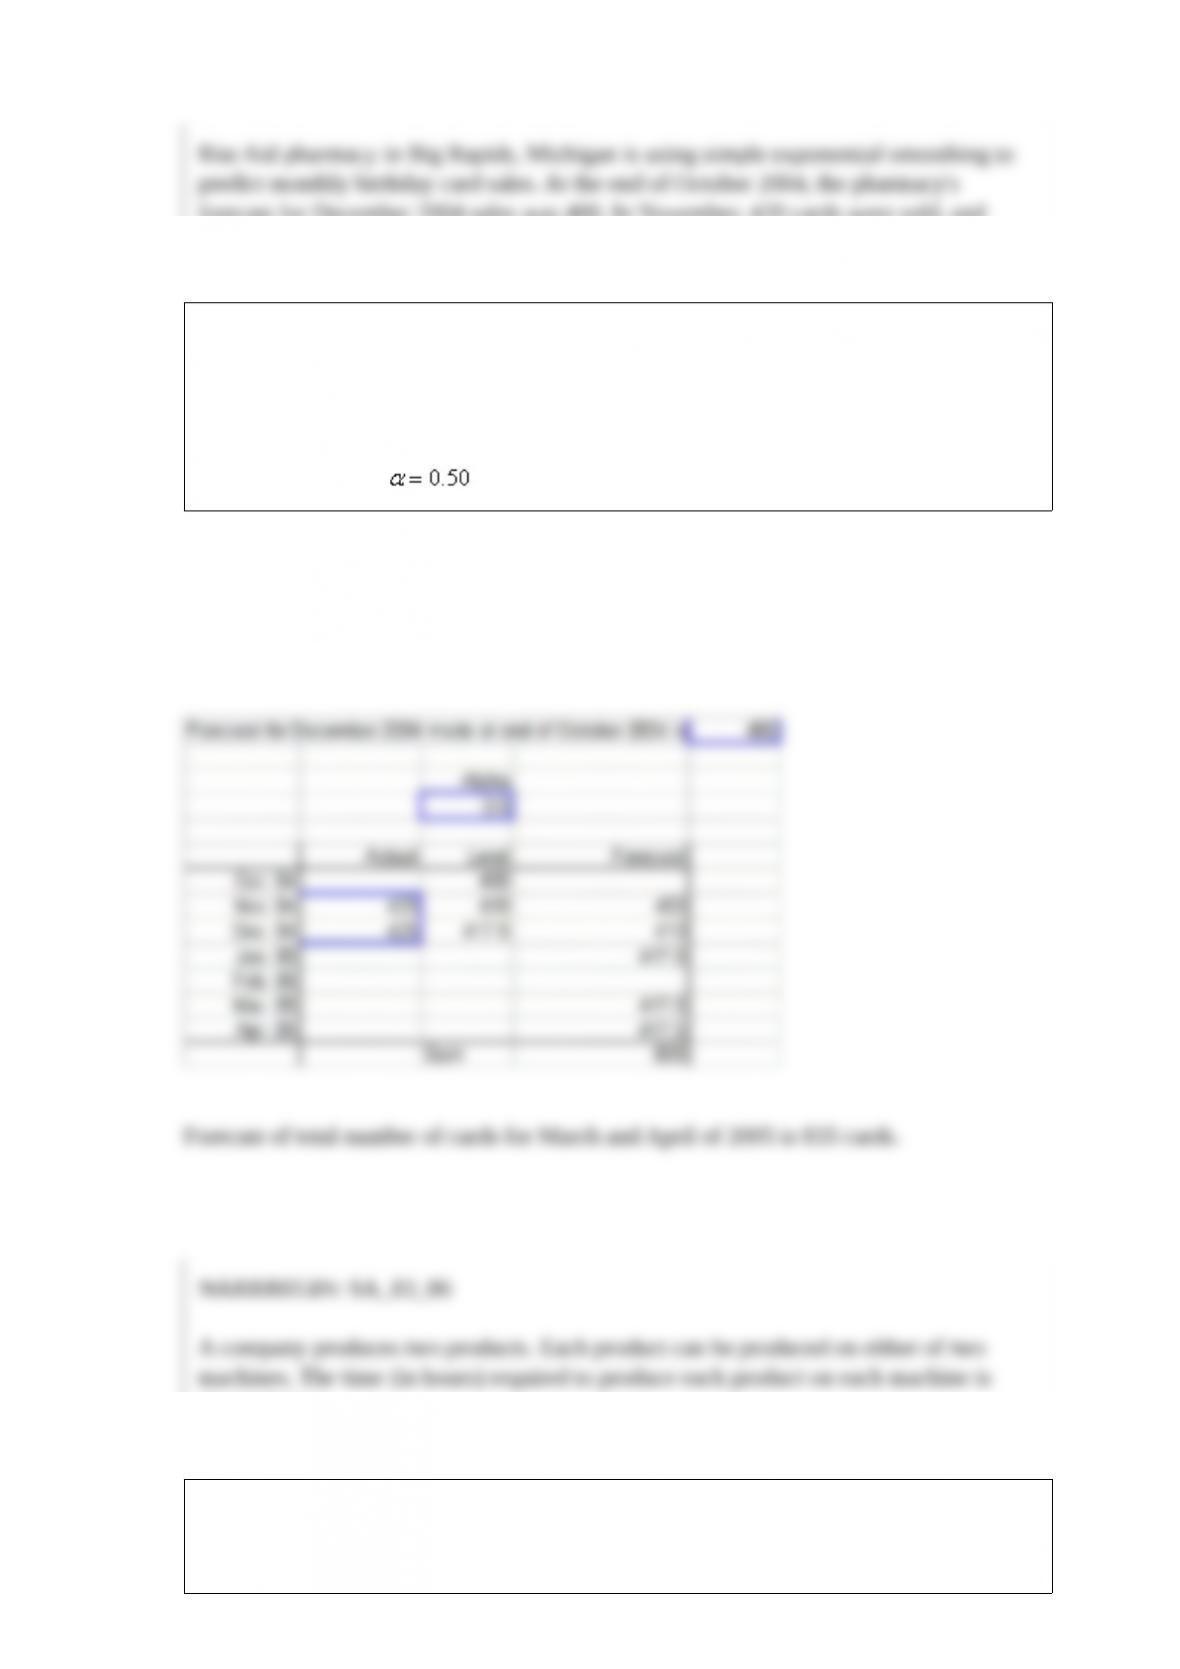
Rite Aid pharmacy in Big Rapids, Michigan is using simple exponential smoothing to
predict monthly birthday card sales. At the end of October 2004, the pharmacy’s
forecast for December 2004 sales was 400. In November, 420 cards were sold, and
during December, 425 cards were sold. At the end of December 2004, what is the
pharmacy’s forecast for the total number of cards that will be sold during March and
April of 2005? Use .
NARRBEGIN: SA_83_86
A company produces two products. Each product can be produced on either of two
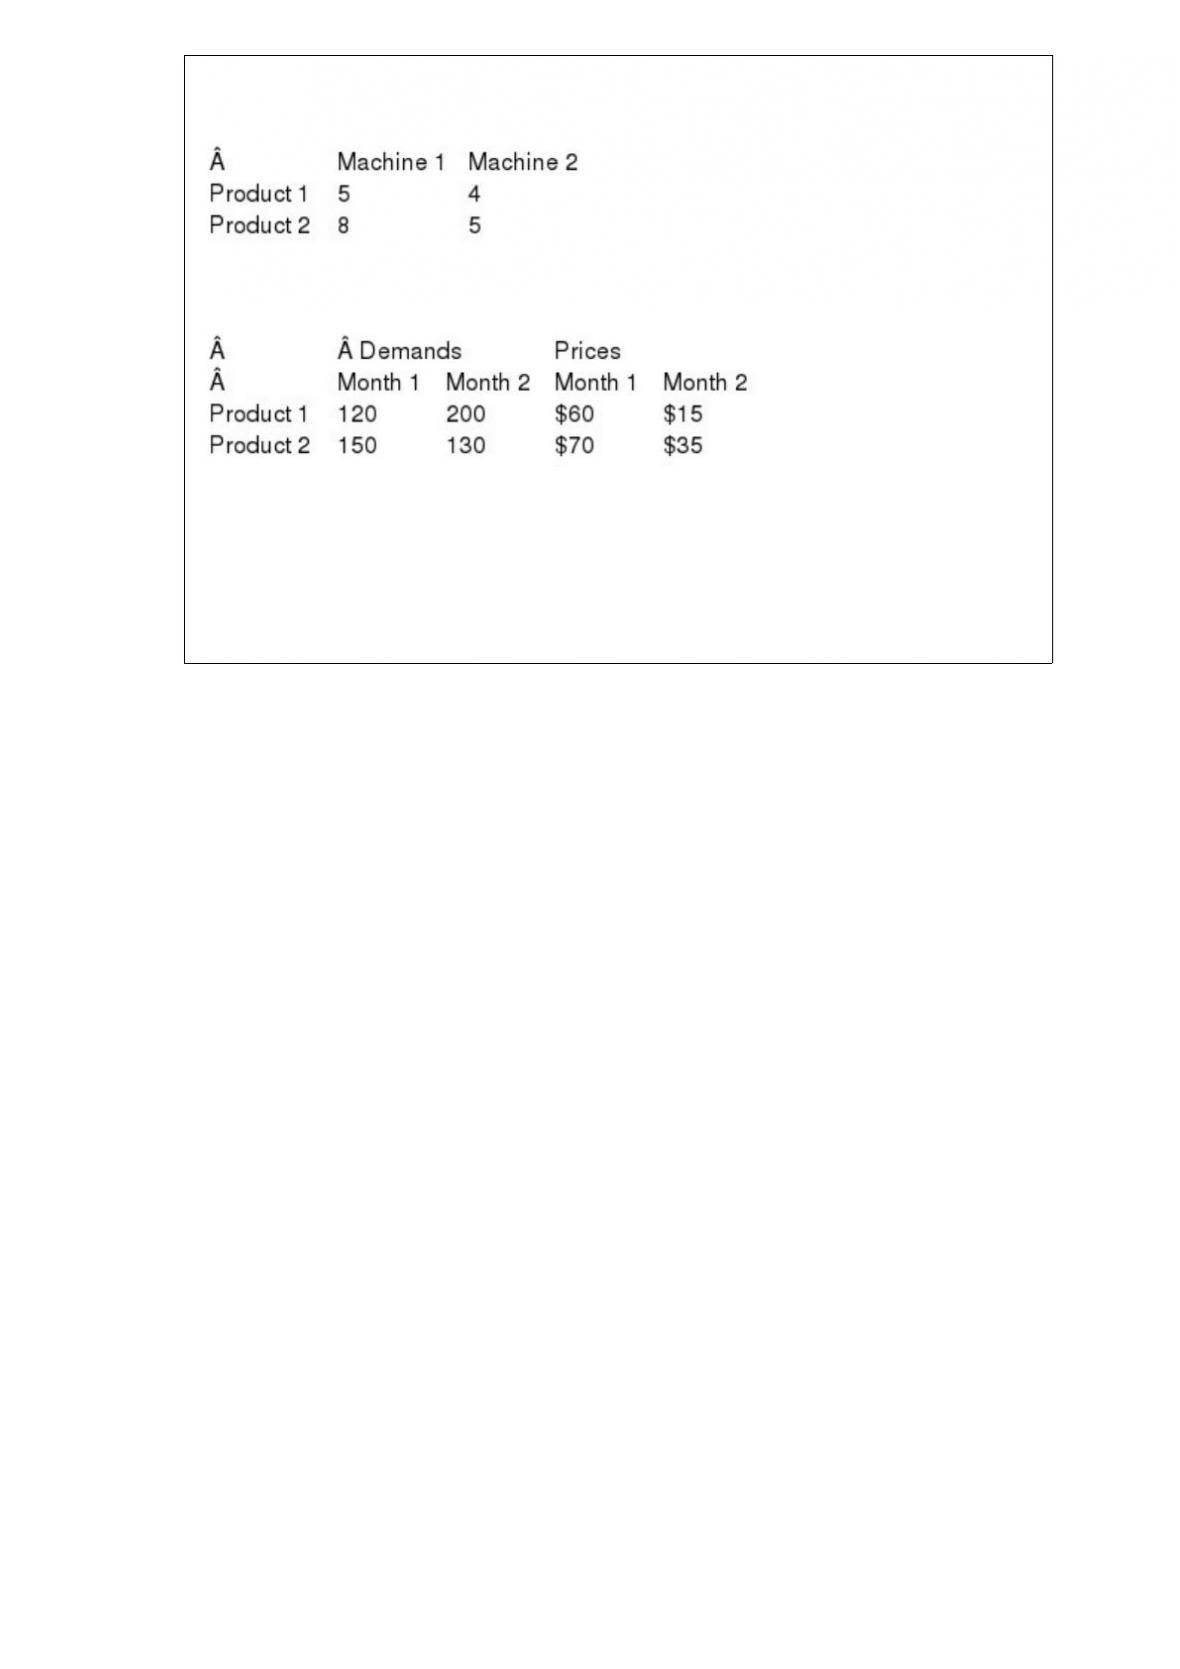
machines. The time (in hours) required to produce each product on each machine is
shown below:
Each month, 600 hours of time are available on each machine, and that customers are
willing to buy up to the quantities of each product at the prices that are shown below:
The company’s goal is to maximize the revenue obtained from selling units during the
next two months.
NARREND
What is the objective function in this problem?