
In a transportation problem, if it costs $4 per item to ship up to 200 items between
cities, and $2 per item for each additional item, the proportionality assumption of LP is
satisfied.
Expressed in percentiles, the interquartile range is the difference between the 25th and
75th percentiles.
When we solve a nonlinear programming problem (NLP), it is very possible that Solver
will obtain the wrong answer.
A binomial distribution with n number of trials, and probability of success p can be
approximated well by a normal distribution with mean np and variance

if np > 5 and n(1-p) > 5.
NARRBEGIN: SA_121_124
A continuous random variable X has the probability density function: f(x) = 2 , 0
NARREND What is the probability that X is between 1 and 3?
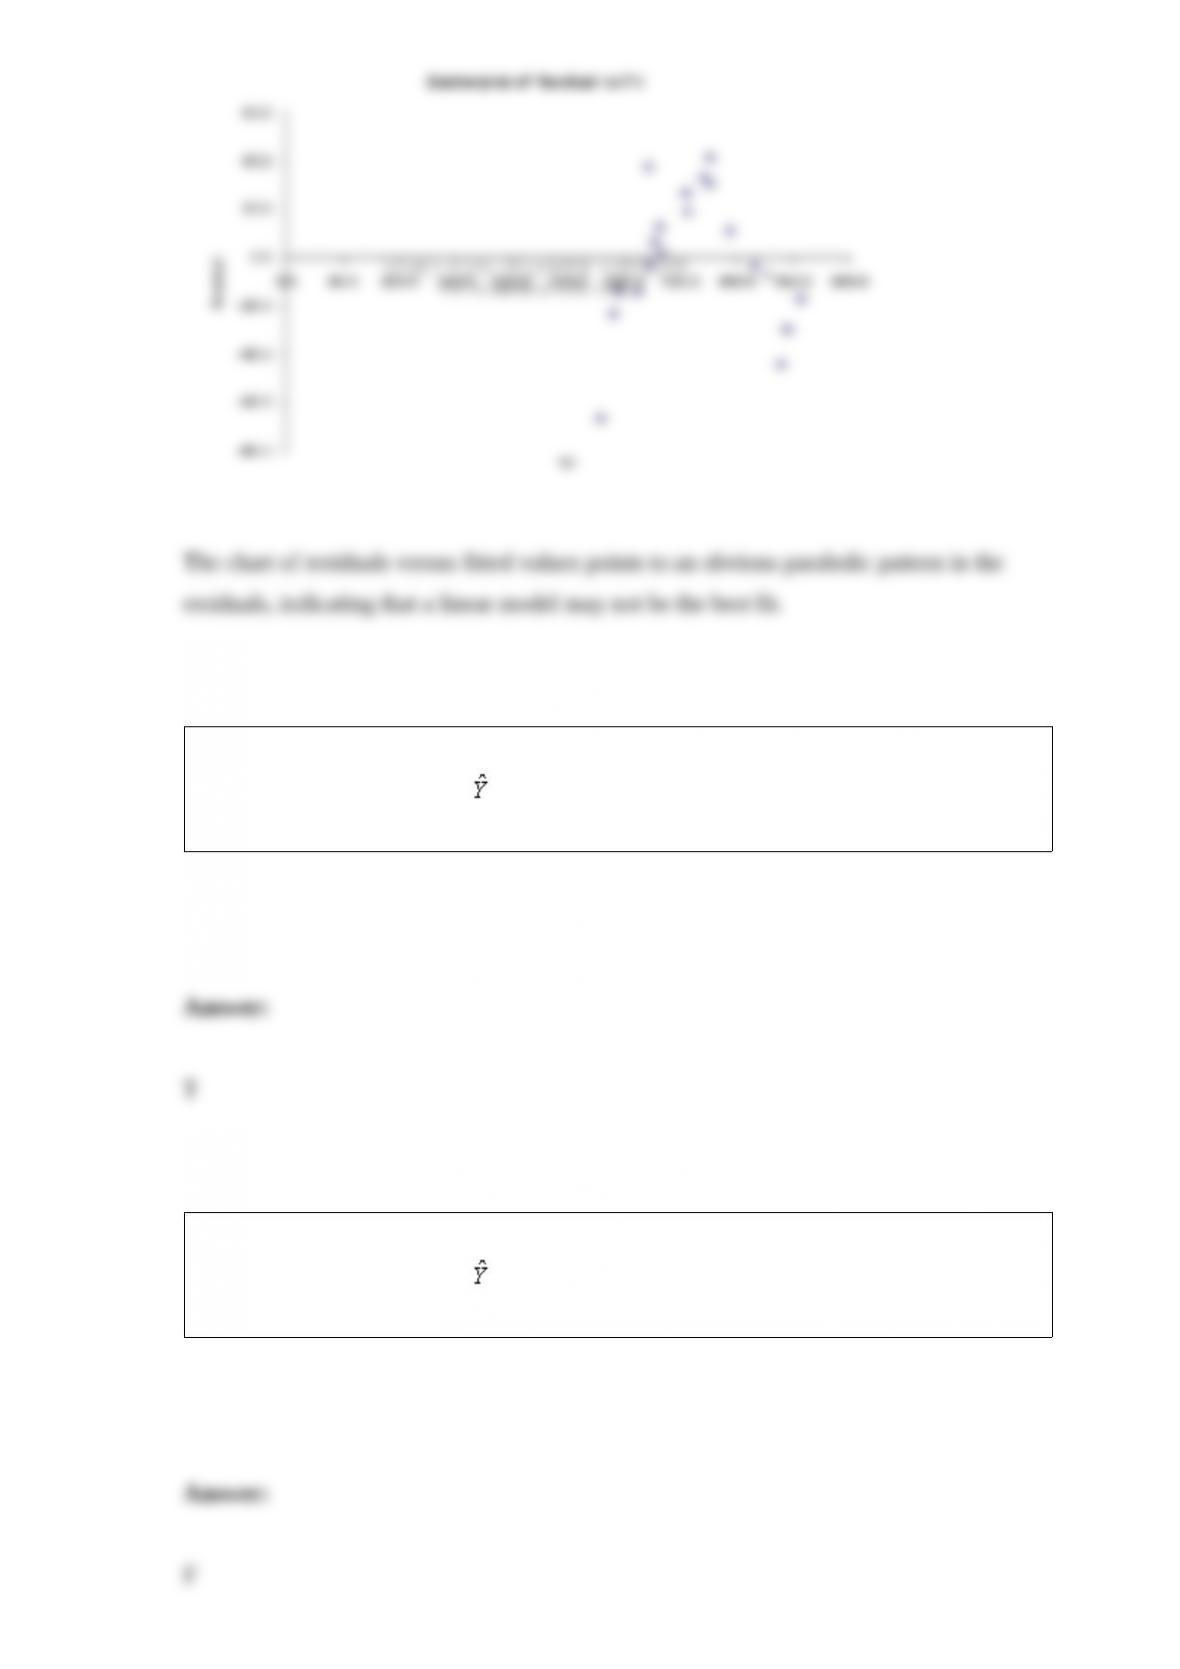
Plot the fitted values versus residuals associated with the model in Question 128. What
does the plot indicate?
A regression analysis between sales (in $1000) and advertising (in $100) resulted in the
following least squares line: = 84 +7X. This implies that if advertising is $800, then
the predicted amount of sales (in dollars) is $140,000.
A regression analysis between sales (in $1000) and advertising (in $) resulted in the
following least squares line: = 32 + 8X. This implies that an increase of $1 in
advertising is expected to result in an increase of $40 in sales.

The assumptions of regression are: 1) there is a population regression line, 2) the
dependent variable is normally distributed, 3) the standard deviation of the response
variable remains constant as the explanatory variables increase, and 4) the errors are
probabilistically independent.
A probability distribution is continuous if its possible values are essentially some
continuum.
The variance of a binomial distribution is given by the formula , where n
is the number of trials, and p is the probability of success in any trial.
The overall modeling process typically done in the business world always require seven

steps: define the problem, collect and summarize data, formulate a model, verify the
model, select one or more suitable decisions, present the results to the organization, and
finally implement the model and update it through time.
Two or more events are said to be mutually exclusive if at most one of them can occur.
A tornado chart lets us see which random input has the most effect on a specified output
in a financial model.