Page 1
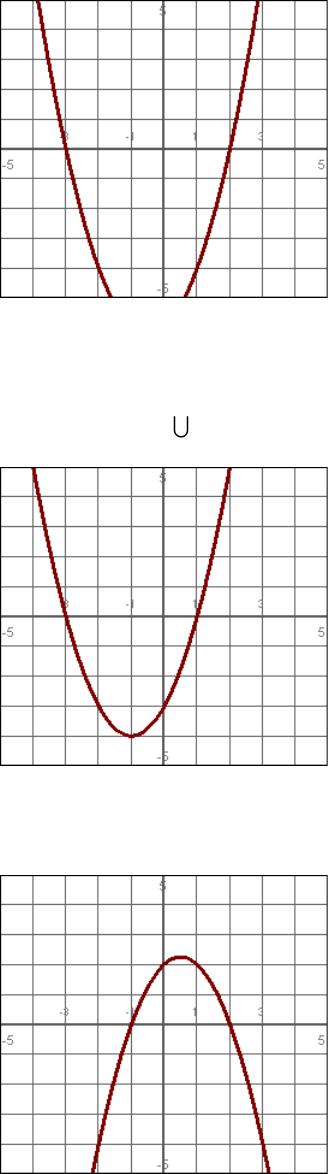
1.
Over what interval(s) is the function negative?
Write your answer in interval notation.
2.
Over what interval(s) is the function positive?
Write your answer in interval notation. If two intervals are needed, write your answer
in the form
( ) ( )
,,a b c d
.
3.
Over what interval(s) is the function positive?
Write your answer in interval notation.
Page 2
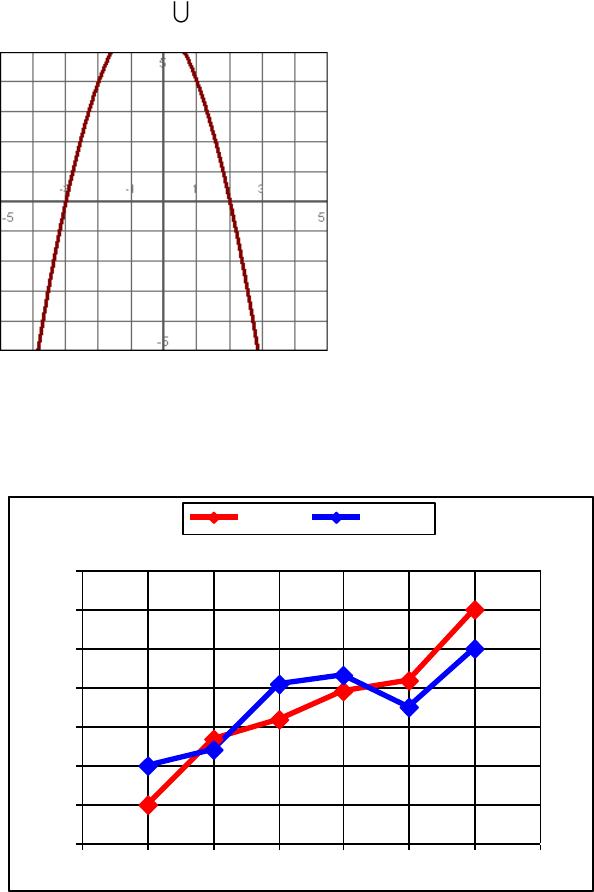
4.
Over what interval(s) is the function negative?
Write your answer in interval notation. If two intervals are needed, write your answer
in the form
( ) ( )
,,a b c d
.
5.
The following graph shows the population (in thousands) of two cities, City 1 and City
2.
What year’s census saw a decrease in city 2’s population?
10
20
30
40
50
60
70
80
1940 1950 1960 1970 1980 1990 2000 2010
City 1 City 2
Page 3
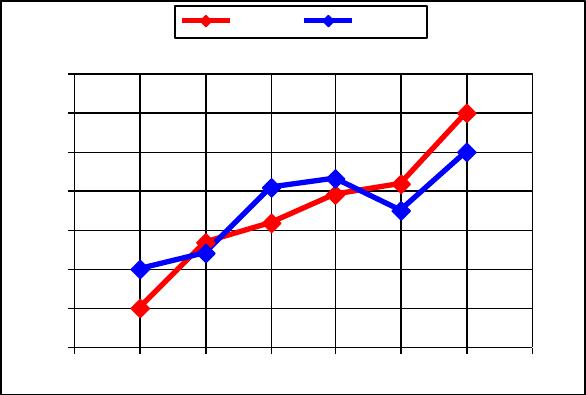
6.
The following graph shows the population (in thousands) of two cities, City 1 and City
2.
What was the difference in population (To the nearest 1,000.) between the two cities in
2000?
10
20
30
40
50
60
70
80
1940 1950 1960 1970 1980 1990 2000 2010
City 1 City 2
Page 4
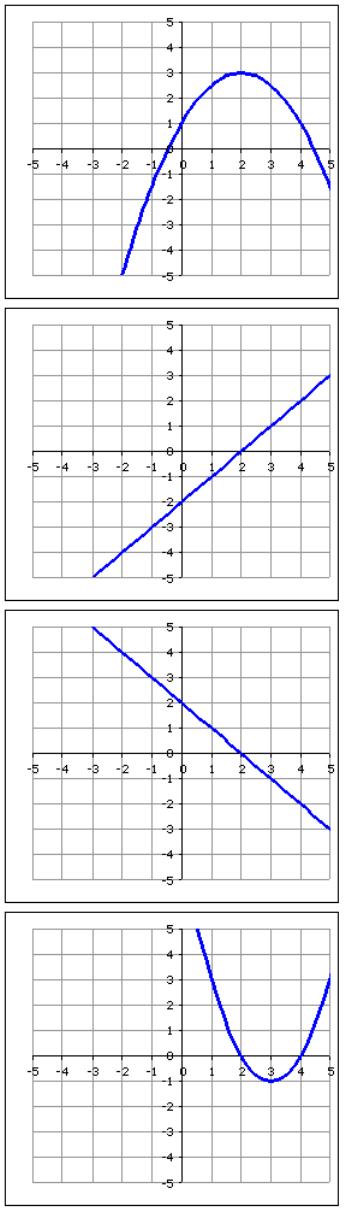
7.
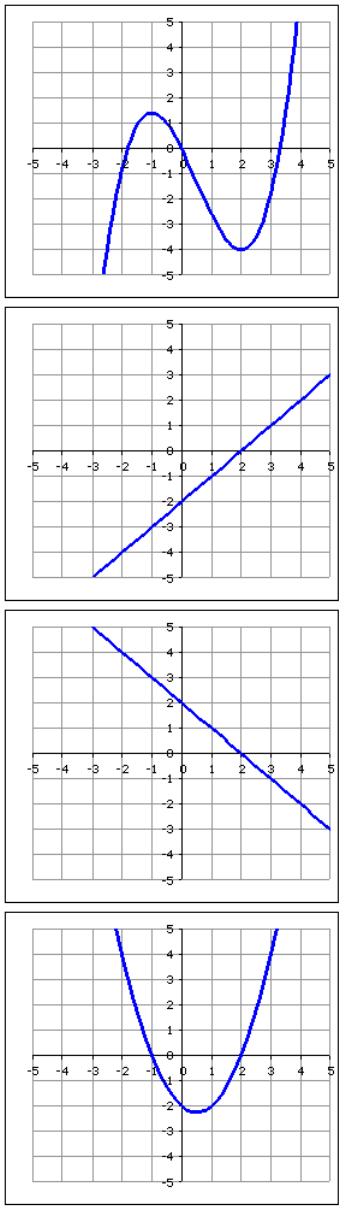
Which graph is increasing on the interval
( )
,2−
and decreasing on the interval (2,4)?
A)
B)
C)
D)
Page 5
8.
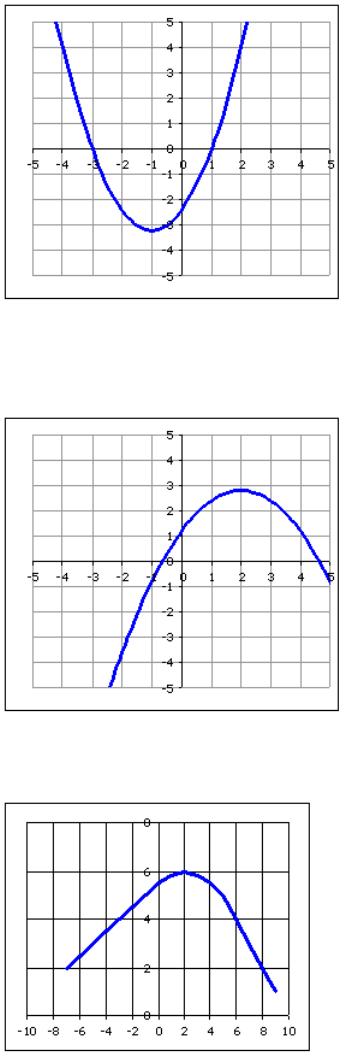
Which graph is decreasing on the interval (-1,2) and increasing on the interval (2,4)?
A)
B)
C)
D)
Page 6
9.
Over what interval is the function increasing?
Write your answer in interval notation.
10.
Over what interval is the function increasing?
Write your answer in interval notation.
11.
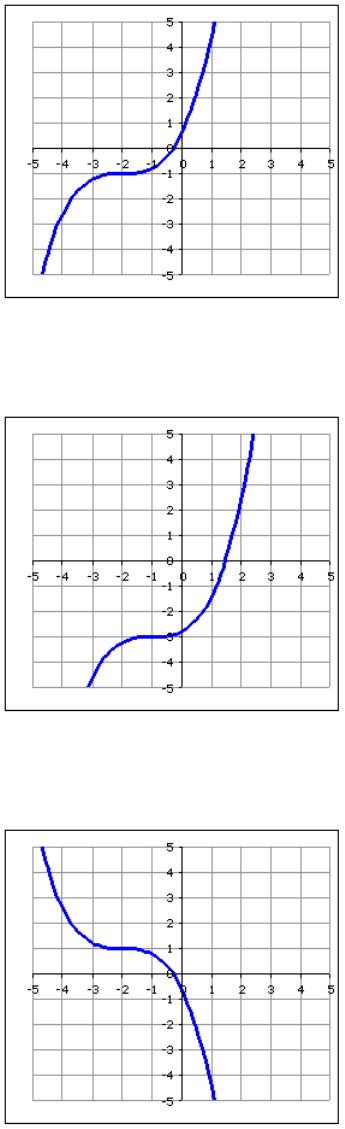
Estimate (to the nearest integer) the maximum of the function whose graph is given.
Page 7
12.
Over what interval is the function concave up?
Write your answer in interval notation.
13.
Over what interval is the function concave down?
Write your answer in interval notation.
14.
Over what interval is the function concave up?
Write your answer in interval notation.
Page 8
15.
Over what interval is the function concave down?
Write your answer in interval notation.
16.
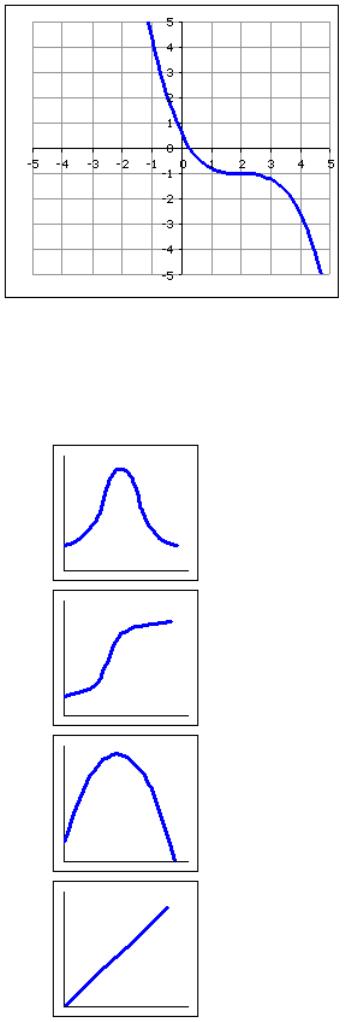
Which graph most likely illustrates the average daily temperature as a function of time
(in months).
Assume the horizontal axis represents time.
A)
B)
C)
D)
Page 9
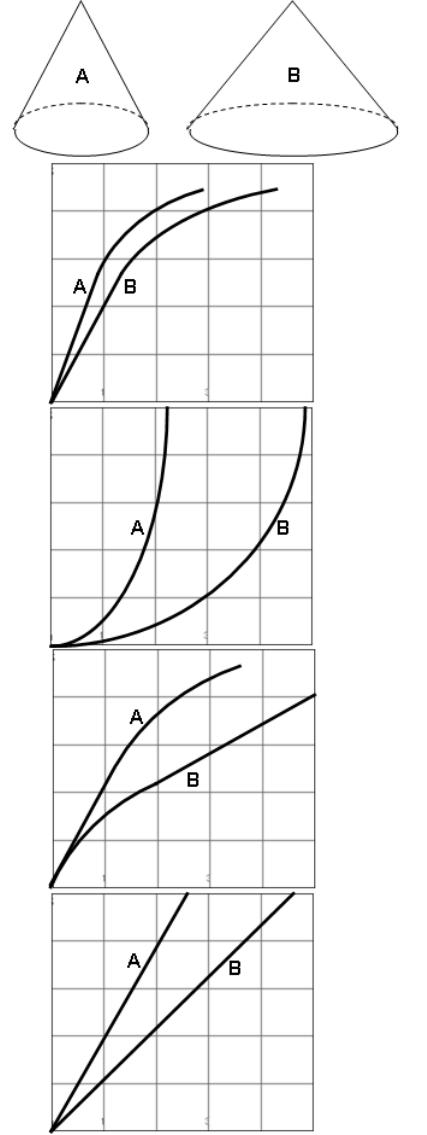
17.
Each of these tanks is being filled with a pipe that delivers 6 gallons of water per
minute. Which graph best represents the height of the water in each tank as a function
of time?
A)
B)
C)
D)
Page 10
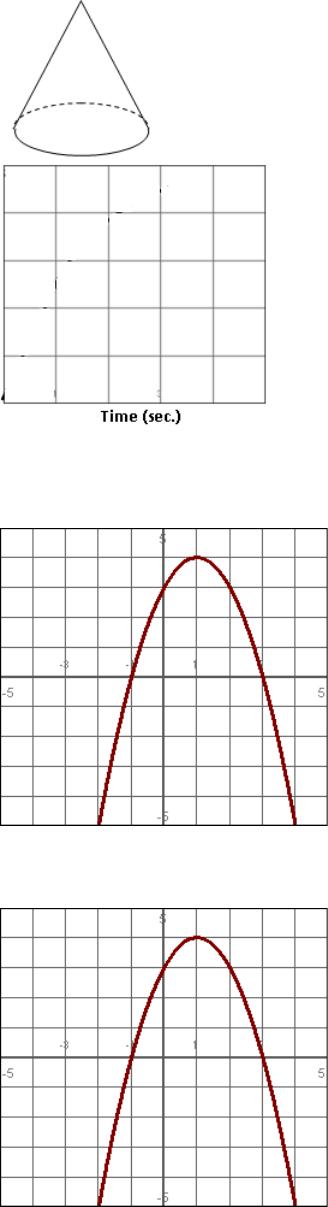
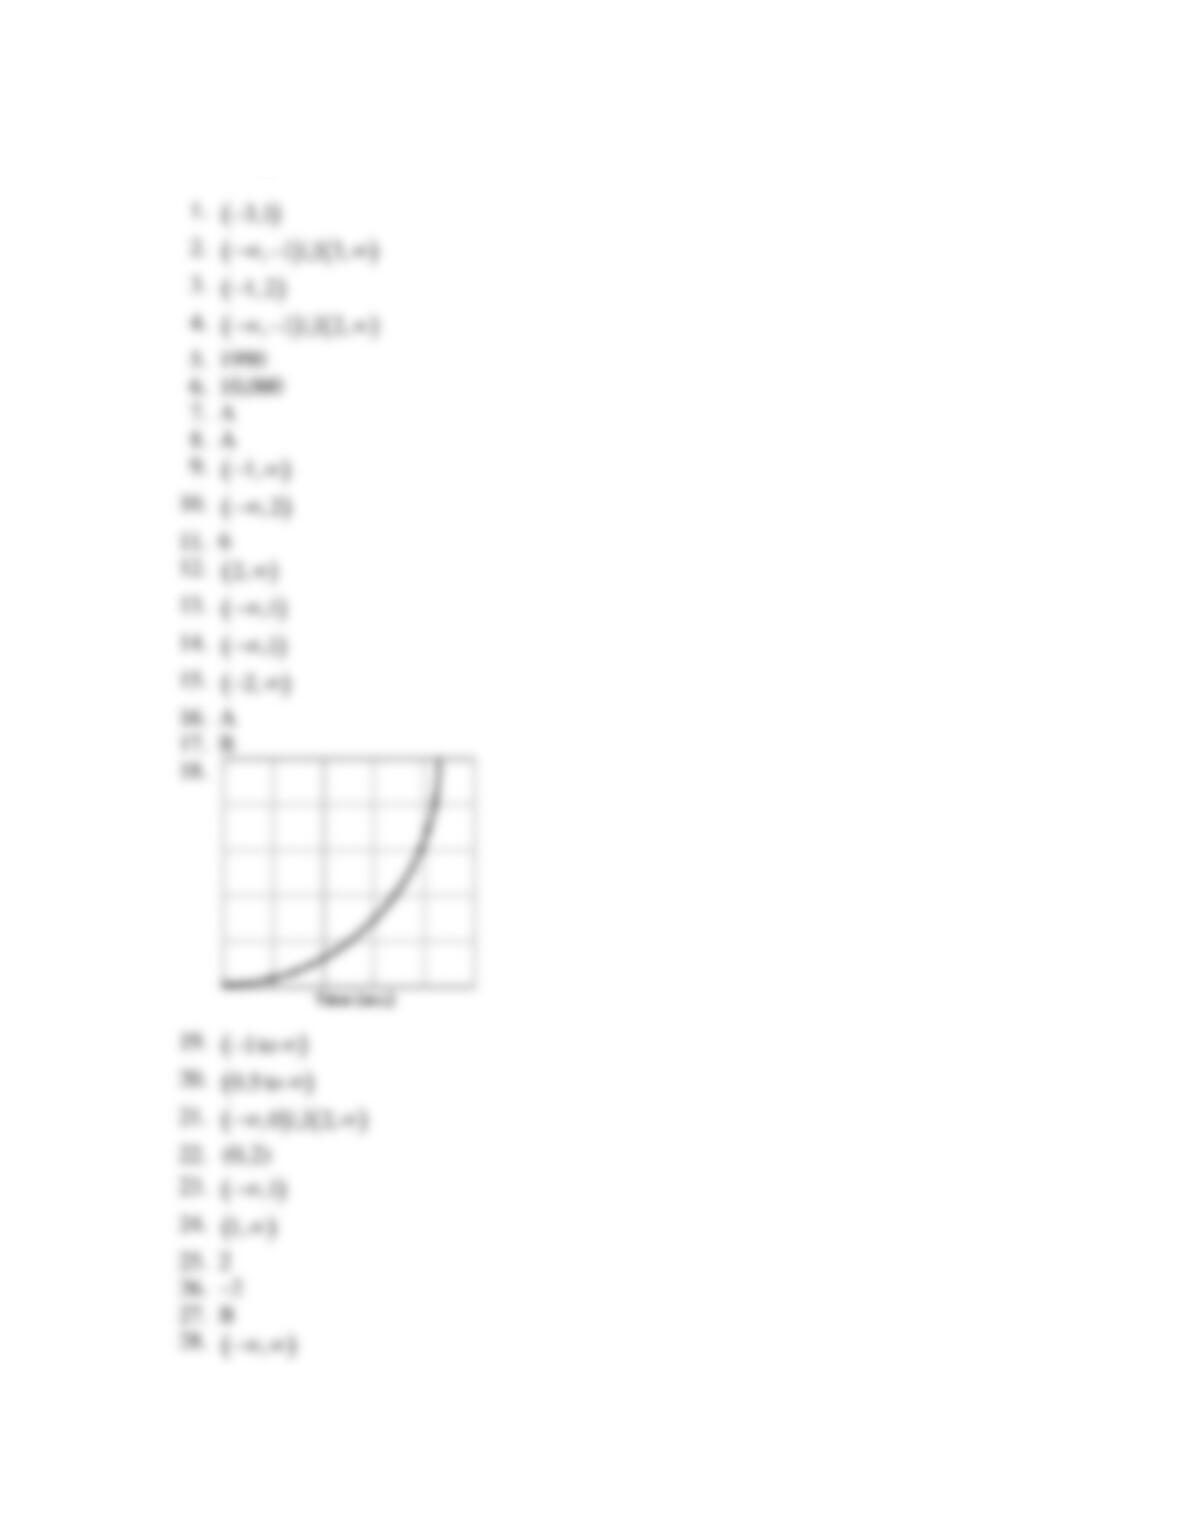
18.
If the tank pictured here is filled with a pipe flowing at a constant rate, sketch the graph
of the height of the water in the tank as a function of time.
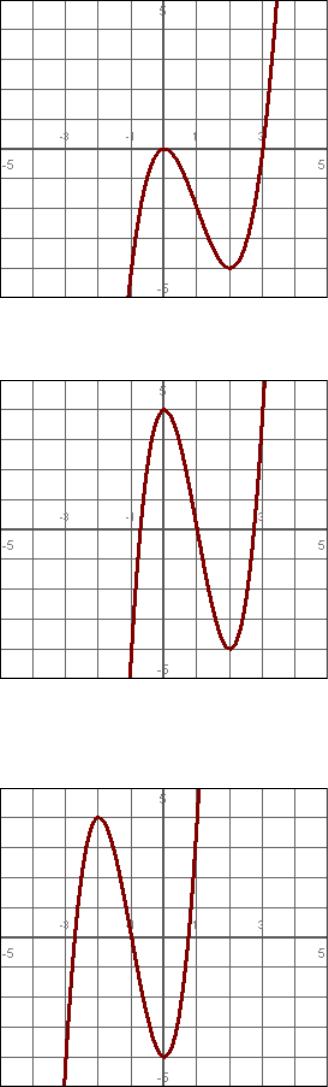
19.
On what interval is this graph increasing. State your answer in interval notation.
20.
On what interval is this graph decreasing. State your answer in interval notation.
Page 11
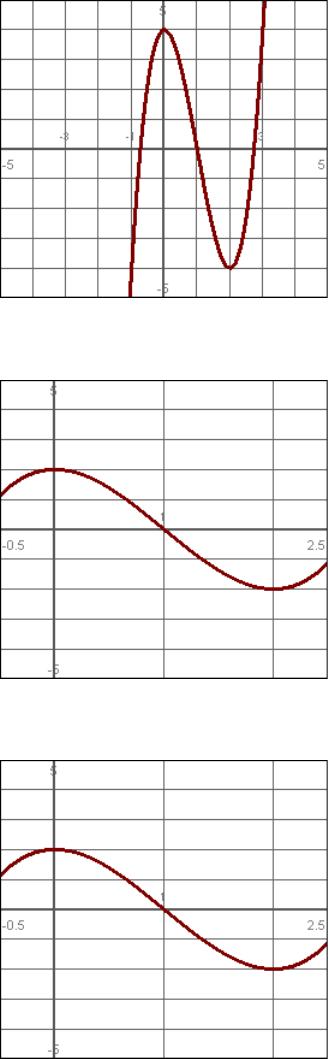
21.
On what interval is this graph increasing. State your answer in interval notation.
22.
On what interval is this graph decreasing. State your answer in interval notation.
23.
State the interval on which this graph is concave downward. State your answer in
interval notation.
Page 12
24.
State the interval on which this graph is concave upward. State your answer in interval
notation.
25.
Identify the maximum of this function over the interval shown.
26.
Identify the minimum of this function over the interval shown.
Page 13
27.
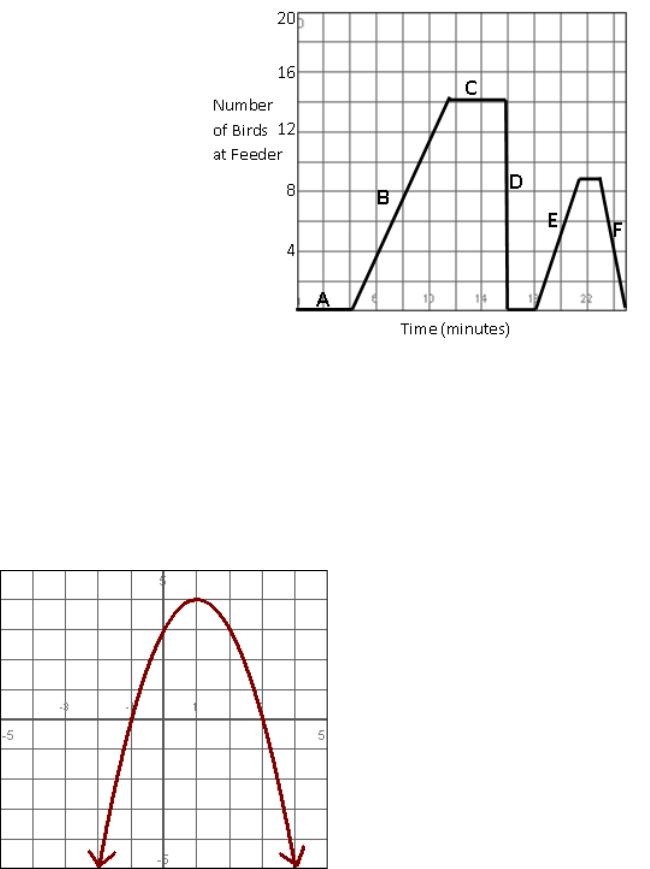
The graph below shows the number of birds at a bird feeder as a function of time.
What event most likely occurred during interval E?
A)
A cat chases all the birds away.
B)
Birds are coming back after being chased away by a cat.
C)
The feeder is full of birds and there is no room for more.
D)
The feeder was still empty from the previous day.
28.
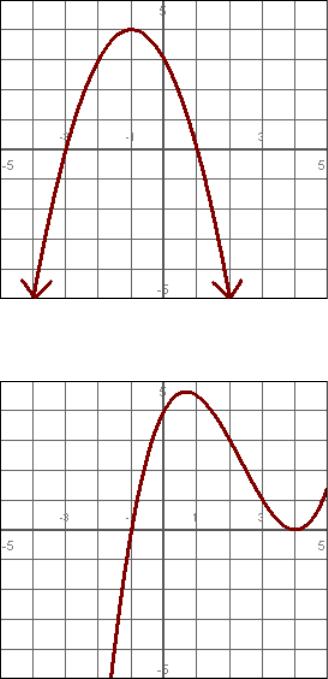
Determine the domain of this graph. Express the answer in interval notation.
Page 14
29.
Determine the range of this graph. Express the answer in interval notation.
30.
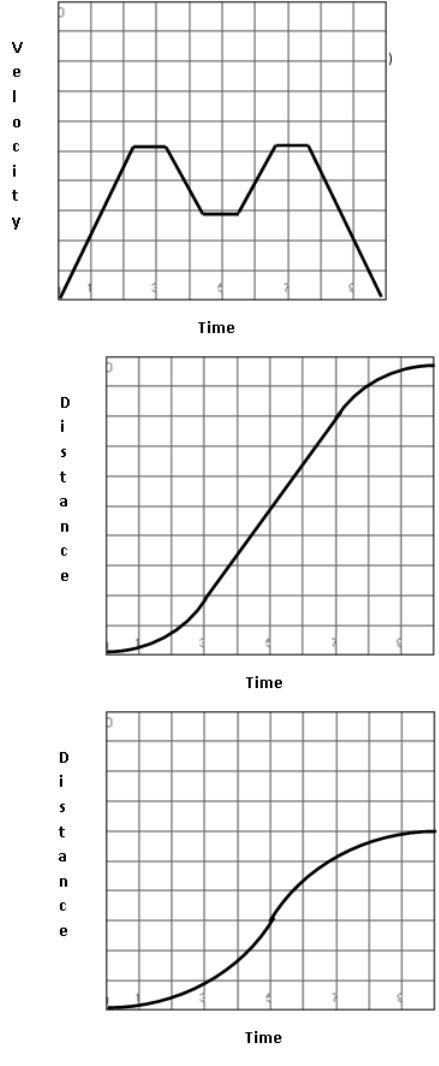
Use the graph of y = f(x) to find f(–1).
Page 15
31.
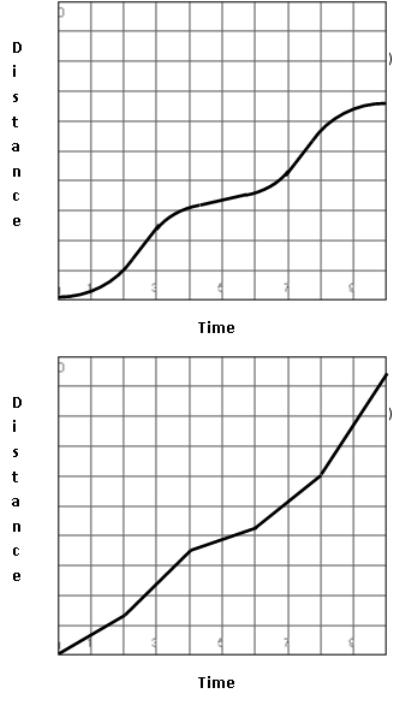
Given the graph of velocity as a function of time, choose the best graph to represent
distance traveled as a function of time.
A)
B)
Page 16
C)
D)
32.
Use technology to graph the function and then determine the interval on which the graph
is concave upward. State your answer in interval notation.
y = x3 – 3x
33.
Use technology to graph the function and then determine the interval on which the graph
is concave downward. State your answer in interval notation.
y = 5x3 – 3x
34.
Use technology to graph the function and then determine the interval on which the graph
is concave upward. State your answer in interval notation.
y = 3.5x4 – 21x2
Page 17
35.
Use technology to graph the function and then determine the interval on which the graph
is concave downward. State your answer in interval notation.
y = 4.75x4 – 114x2
36.
Use technology to graph the function and then determine the interval over which the
function is increasing. State your answer in interval notation.
y = 5x4 – 40x2
37.
Use technology to graph the function and then determine the interval over which the
function is decreasing. State your answer in interval notation.
y = x4 – 8x2
38.
Use technology to graph the function and then determine the interval over which the
function is increasing. State your answer in interval notation.
y = x3 – 48x
39.
Use technology to graph the function and then determine the interval over which the
function is decreasing. State your answer in interval notation.
y = x3 – 3x
Page 18
Answer Key
Page 19