Page 1
1.
Consider the table giving values for variables x and y.
x
–6
–3
–1
1
4
y
9
14
2
13
7
Determine whether y is a function of x.
A)
y is a function of x
B)
y is not a function of x
2.
Consider the table giving values for variables s and t.
s
2
–3
0
6
0
t
3
9
1
0
8
Determine which of the following best describes the relationship between s and t.
A)
t is a function of s
B)
s is a function of t
C)
both A and B
D)
None of the above
3.
Consider the table giving values for height and weight of 5 individuals.
Height
67
79
72
70
70
Weight
149
177
141
129
141
Determine which of the following best describes the relationship between height and
weight.
A)
Height is a function of weight.
B)
Weight is a function of height.
C)
Both A and B
D)
None of the above.
4.
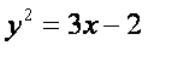
True or False. The equation defines y as a function of x.
A)
False
B)
True
Page 2
5.
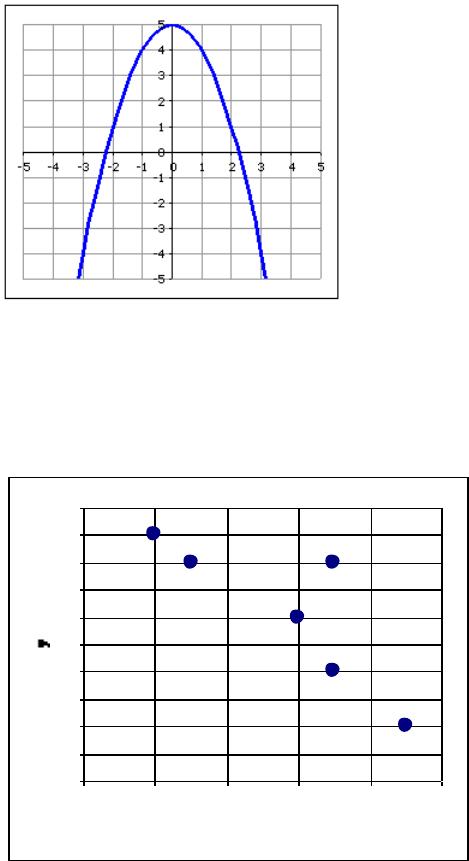
In the graph below, y is a function of x.
A)
True
B)
False
6.
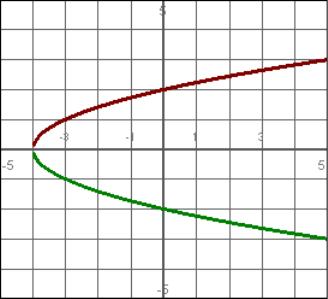
Based upon the scatterplot choose the answer that best describes the relationship
between x and y.
A)
y is a function of x
B)
x is a function of y
C)
both A and B
D)
None of the above
7.
In the situation below, identify
A) the independent (input) variable, and
B) the dependent (output) variable.
Enter the variable only.
At the bookstore the total bill (b) is a function of the number of pencils you buy (p).
0
1
2
3
4
5
6
7
8
9
10
0 2 4 6 8 10
x
Page 3
8.
For the following data, find a formula that expresses y in terms of x.
x
y
0
3
1
8
2
13
3
18
4
23
9.
Find a formula that gives y in terms of x.
x
0
1
2
3
4
y
3
3
3
3
3
10.
A plumber charges $20 for a house call plus $27 per hour while she is there, up to a
maximum of 8 hours.
Write a formula to describe the price, p, of a house call by the plumber in terms of the
hours, h, spent at the house.
11.
A taxi company has the following fare policy: any trip of 5 miles or less costs $5.00 and
the cost for each additional mile is $0.35. The company will not make a trip longer
than 30 miles.
Which formula and domain best describe the relationship between the cab fare, f, and
the length of the trip, t, 5 miles or longer.
A)
0.65 4.75ft=+
; Domain: [5,30]
B)
0.65 8ft=+
; Domain: [0,
)
C)
0.35 8ft=+
; Domain: (0,30]
D)
8 0.65ft=+
; Domain: [5,
)
12.
Determine if this set of points represents a function.
(7, 10), (6, –1), (–4, –6), (–8, –3), (4, –8)
A)
Yes. The points represent a function.
B)
No. The points do not represent a function.
Page 4
13.
Determine if this table describes a function.
x
y
7
11
–5
–5
–6
6
–1
–9
0
–1
A)
Yes. The points represent a function.
B)
No. The points do not represent a function.
14.
Find an equation that represents the relationship between x and y in this table:
x
y
2
3
3
–2
4
–9
5
–18
6
–29
15.
Find an equation that represents the relationship between x and y in this table:
x
y
–2
7
–1
4
0
1
1
–2
2
–5
16.
Find an equation that represents the relationship between x and y in this table:
x
y
1
–7
2
–10
3
–13
4
–16
5
–19
17.
Find an equation that represents the relationship between x and y in this table:
x
y
–1
–8
0
–8
1
–8
2
–8
3
–8
Page 5
18.
Determine if this set of points represents a function. (Answer “Yes” or “No”.)
(–2, –2), (–1, –2), (1, –2), (0, –2), (2, –2)
19.
Determine if this set of points represents a function. (Answer “Yes” or “No”.)
(–1, 1), (0, –1), (2, –5), (1, –3), (–1, 2)
20.
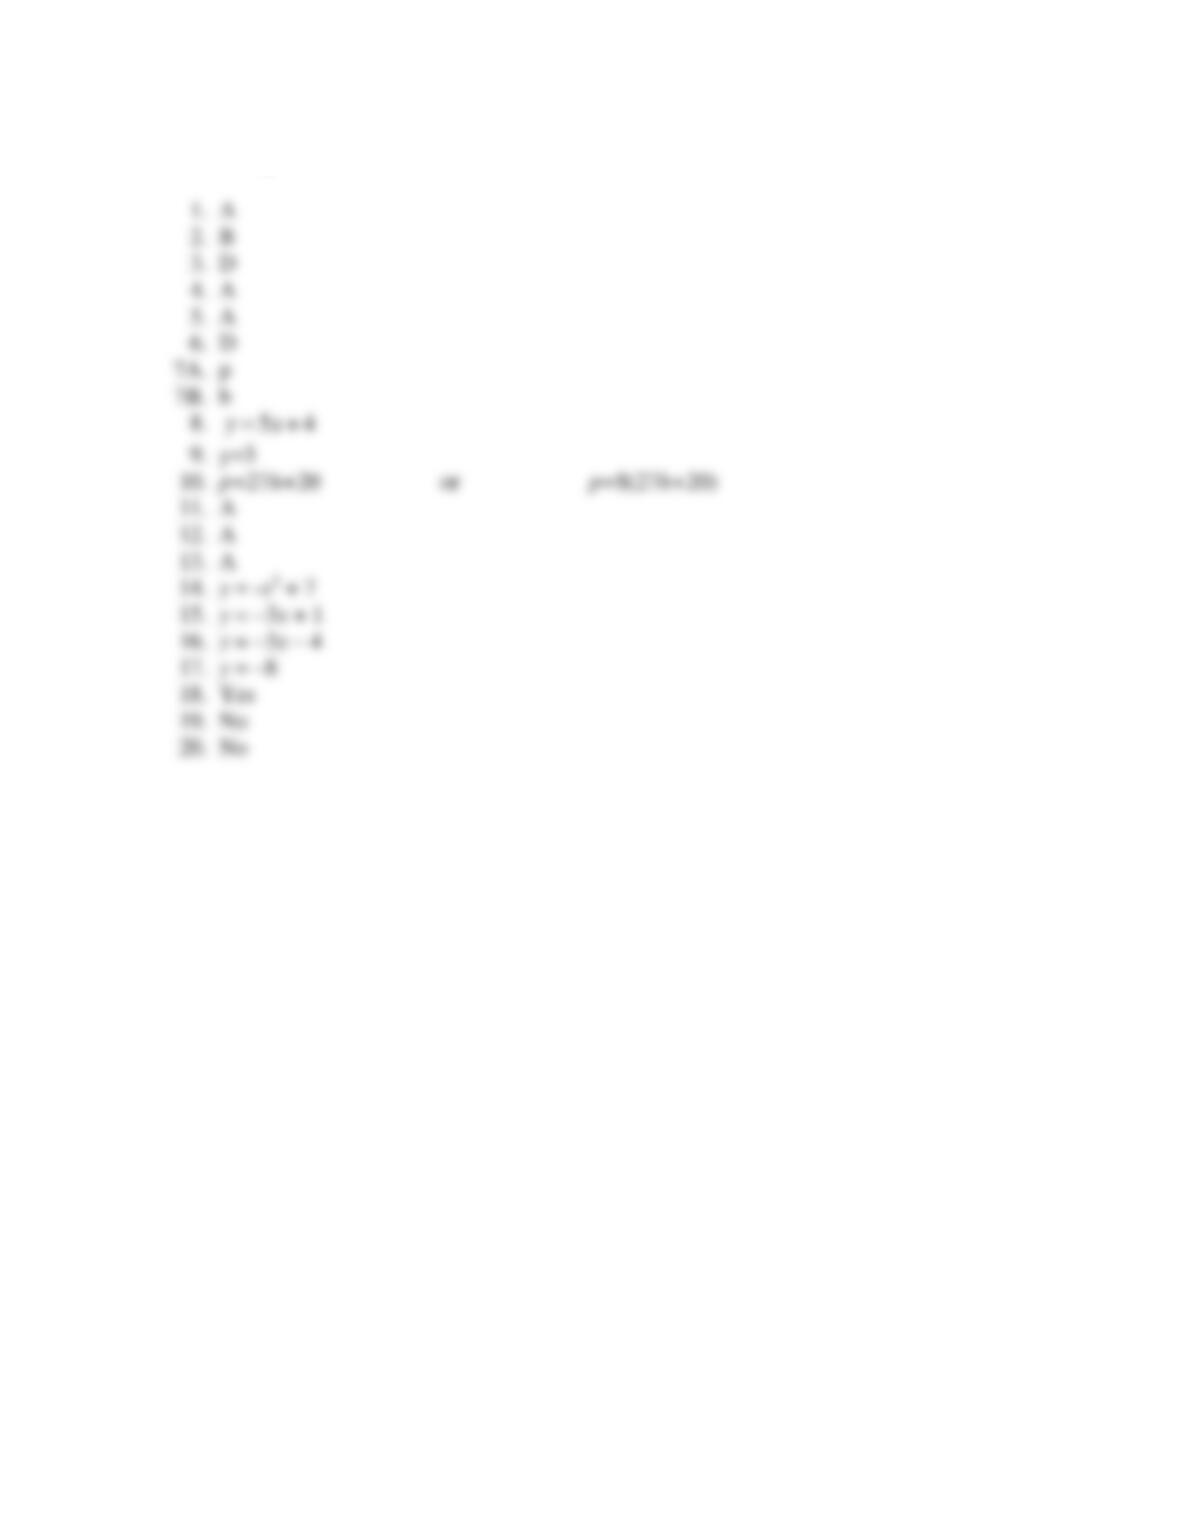
Determine if this graph represents a function. (Answer “Yes” or “No”.)
Page 6
Answer Key