
Page 1
1.
Select all of the following ordered pairs that satisfy the equation.
2
– + 6 + 5y x x=
A)
(–5,7)
B)
(2,–1)
C)
(–2,–5)
D)
(–3,–3)
E)
(4,1)
2.
Which one of the following ordered pairs that satisfy the equation.
2– 6 + 4y x x=
A)
(1,9)
B)
(–3,1)
C)
(3,–11)
D)
(–2,–3)
3.
Determine whether the ordered pair, (–3,–5), satisfies the equation.
2
– + 7 – 2y x x=
A)
No
B)
Yes
4.
Find the value that correctly completes the ordered pair, (2,__) for the equation.
2
3 + 7 – 4y x x=
5.
Select all of the following ordered pairs that satisfy the equation.
4 – 2yx=
A)
(–1,–1)
B)
(–2,–17)
C)
(2,–17)
D)
(–3,–23)
E)
(1,7)
6.
Which one of the following ordered pairs that satisfy the equation.
7 – 2yx=
A)
(2,–2)
B)
(–3,–13)
C)
(–2,–2)
D)
(1,7)
Page 2
7.
Determine whether the ordered pair, (–2,3), satisfies the equation.
+3yx=
A)
No
B)
Yes
8.
Find the value that completes the ordered pair, (–2,__), satisfies the equation.
3 +3yx=
9.
Find the value that completes the ordered pair, (2,__).
10.
Find the value that completes the ordered pair, (__,1).
Page 3
11.
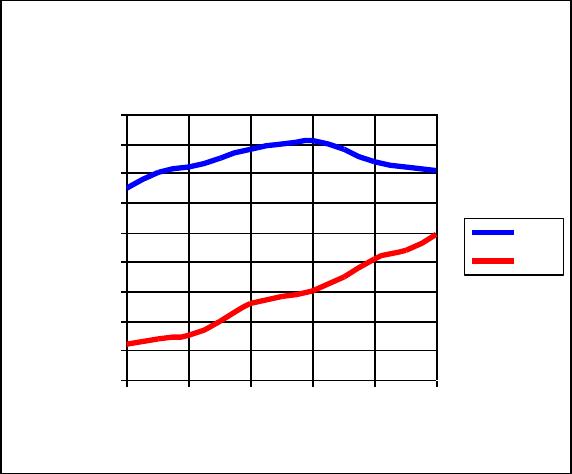
Use the graph below to answer the questions.
A) What was the average gas price in month 6 of 1999? (Round to the nearest $0.05.)
B) In what month did gas prices reach $1.40 per gallon?
C) After which month did milk prices begin to decrease?
Average Price of Milk and Gas over
the First 6 Months of 1999
1
1.1
1.2
1.3
1.4
1.5
1.6
1.7
1.8
1.9
1 2 3 4 5 6
Month
Average Price
($ per gallon)
Milk
Gas
Page 4
12.
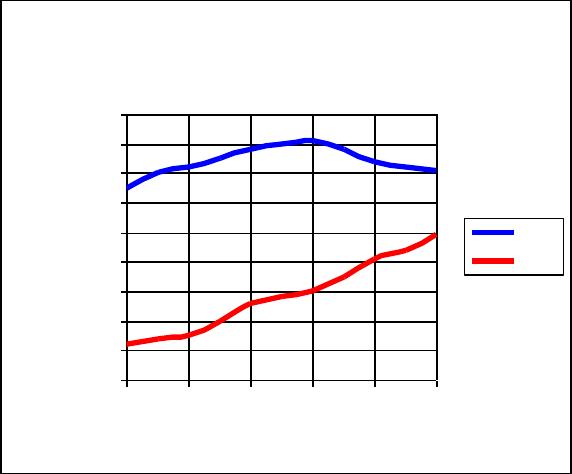
Use the graph below to answer the question.
Choose the average gas price in month 4 of 1999.
A)
$ 1.81
B)
$ 0.30
C)
$ 0.40
D)
$ 1.30
Average Price of Milk and Gas over
the First 6 Months of 1999
1
1.1
1.2
1.3
1.4
1.5
1.6
1.7
1.8
1.9
1 2 3 4 5 6
Month
Average Price
($ per gallon)
Milk
Gas
Page 5
13.
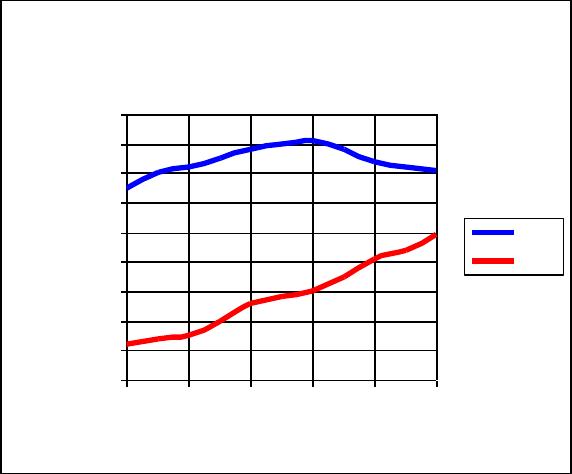
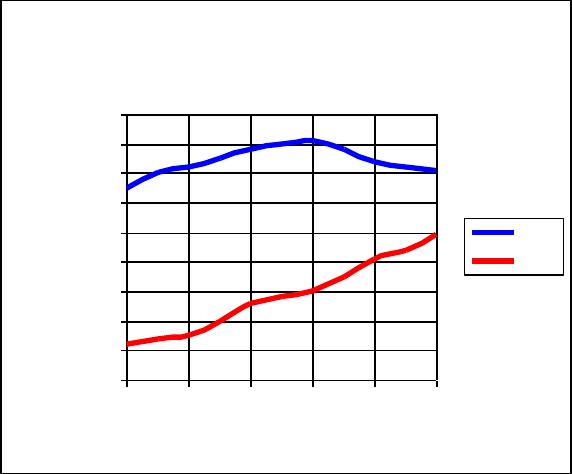
Use the graph below to answer the questions.
In what month did milk prices reach $1.79 per gallon?
A)
2
B)
3
C)
6
D)
4
Average Price of Milk and Gas over
the First 6 Months of 1999
1
1.1
1.2
1.3
1.4
1.5
1.6
1.7
1.8
1.9
1 2 3 4 5 6
Month
Average Price
($ per gallon)
Milk
Gas
Page 6
14.
Use the graph below to answer the questions.
After which month did milk prices begin to decrease?
A)
2
B)
5
C)
4
D)
3
Average Price of Milk and Gas over
the First 6 Months of 1999
1
1.1
1.2
1.3
1.4
1.5
1.6
1.7
1.8
1.9
1 2 3 4 5 6
Month
Average Price
($ per gallon)
Milk
Gas
Page 7
15.
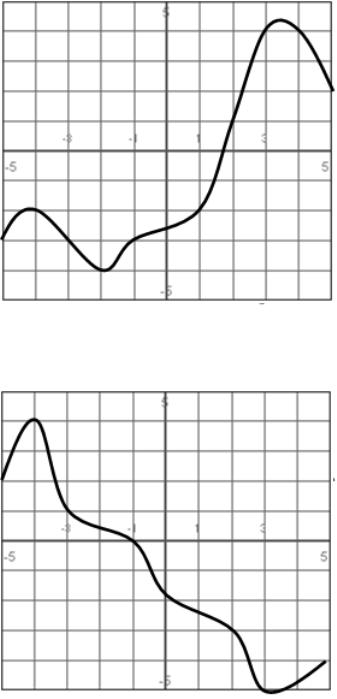
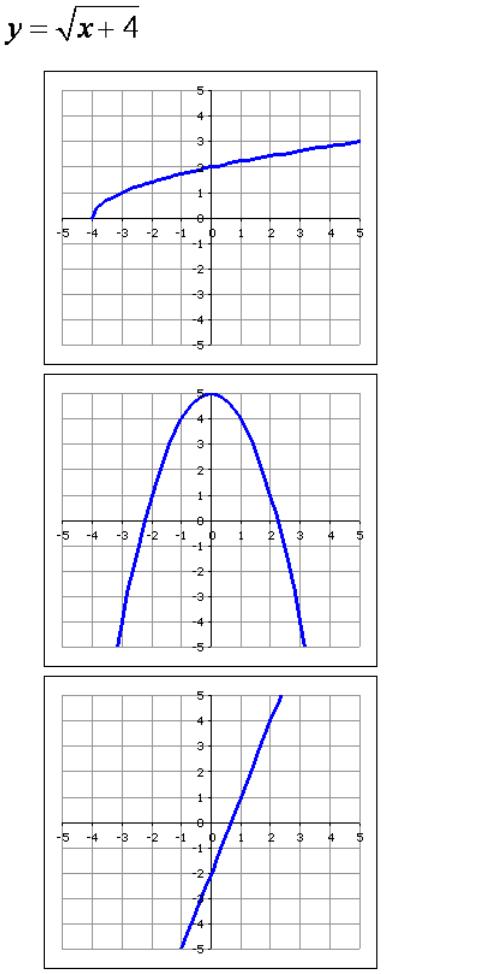
Which graph displays the solutions to the equation below?
A)
B)
C)
Page 8
16.
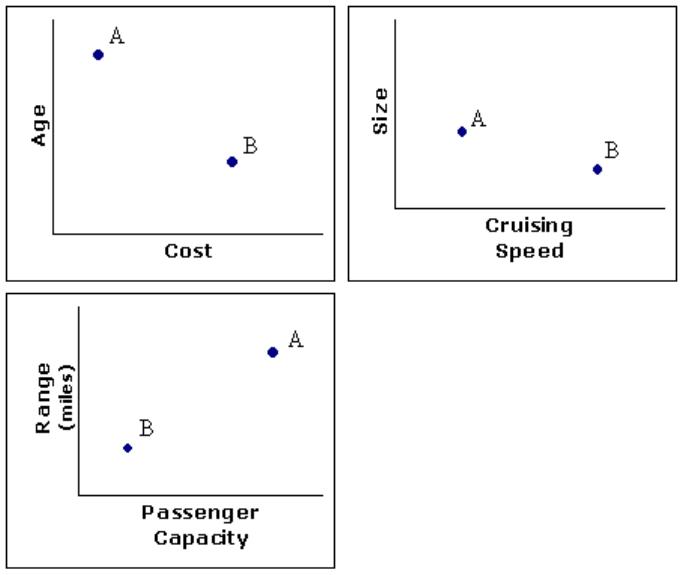
The following three graphs describe two cars, A and B.
Which of the following is true?
A)
The newer car is more expensive.
B)
The newer car is less expensive.
Page 9
17.
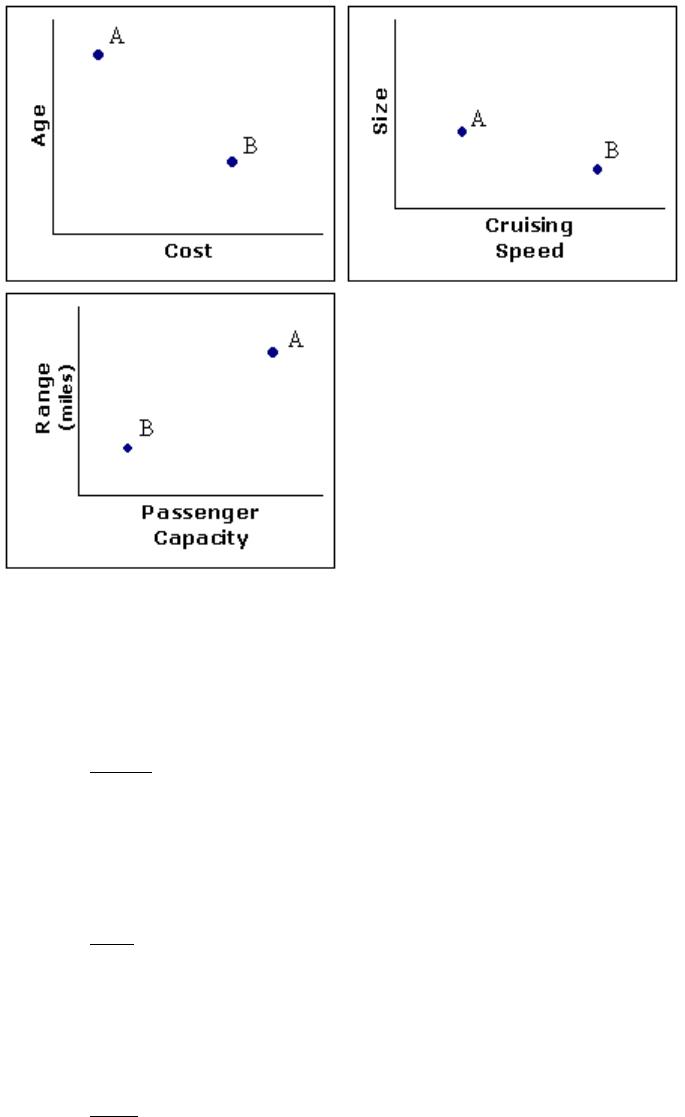
The following three graphs describe two cars, A and B.
Which of the following is true?
A)
The more expensive car has a shorter range.
B)
The more expensive car has a longer range.
18.
For the equation:
–2
4
x
yx
+
=−
what value cannot be in the domain?
19.
For the equation:
1
1
x
yx
+
=−
find the value of y when x is 6.
20.
For the equation:
3
3
x
yx
+
=−
find the value of x when y is 3.
Page 10
21.
For the given equation
2
73yx=+
, which could never be a value of y?
A)
6
B)
1
C)
–7
D)
2
22.
The following table shows data for the number of speeding tickets issued and the
number of traffic deaths in Barron County by year.
Year
Number of Speeding
Tickets Issued
Number of
Traffic Deaths
2000
2,442
33
2001
2,917
33
2002
2,769
26
2003
3,379
37
2004
2,572
38
In which year were there the most traffic deaths?
23.
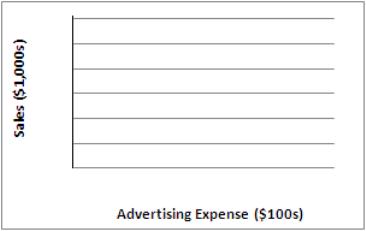
Create a scatter plot for the following data:
year
Advertising
Expense ($100s)
Sales
($1,000s)
1985
47
138
1990
49
136
1995
51
142
2000
52
149
2005
55
159
Page 11
24.
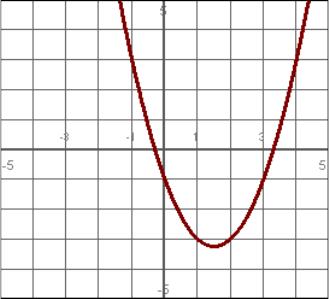
Use the graph to fill in the table.
x
y
–1
–1
1
–3
3
3
Page 12
Answer Key