33) If the U.S. government implements a tariff on Chinese tire imports all of the following would
be made worse off except
A) U.S. consumers.
B) American tire retailers.
C) Chinese tire manufacturers.
D) American tire manufacturers.
34) If the U.S. government implements a tariff on Chinese tire imports, the price of Chinese-
made tires will ________, the quantity demanded will ________, and consumer surplus will
________.
A) increase; decrease; decrease
B) increase; not change; increase
C) decrease; increase; not change
D) increase; decrease; increase
35) Under trade agreements signed with other countries, the United States is allowed to impose
tariffs on imports if foreign firms are selling products in the United States at below their
production cost. This is exactly what occurred when the United States raised the tariff on wire
hangers imported from China. At the time the tariff was imposed, it was estimated that the tariff
would save about ________ jobs in U.S factories making wire hangers at an annual cost per job
saved of about ________.
A) 4,000; $31,000
B) 17,000; $150,000
C) 300; $400,000
D) 221,000; $14,000
36) A quota is a numerical limit on the quantity of a good that can be imported.
37) The United States would gain from the elimination of tariffs and quotas even if other
countries do not reduce their tariffs and quotas.
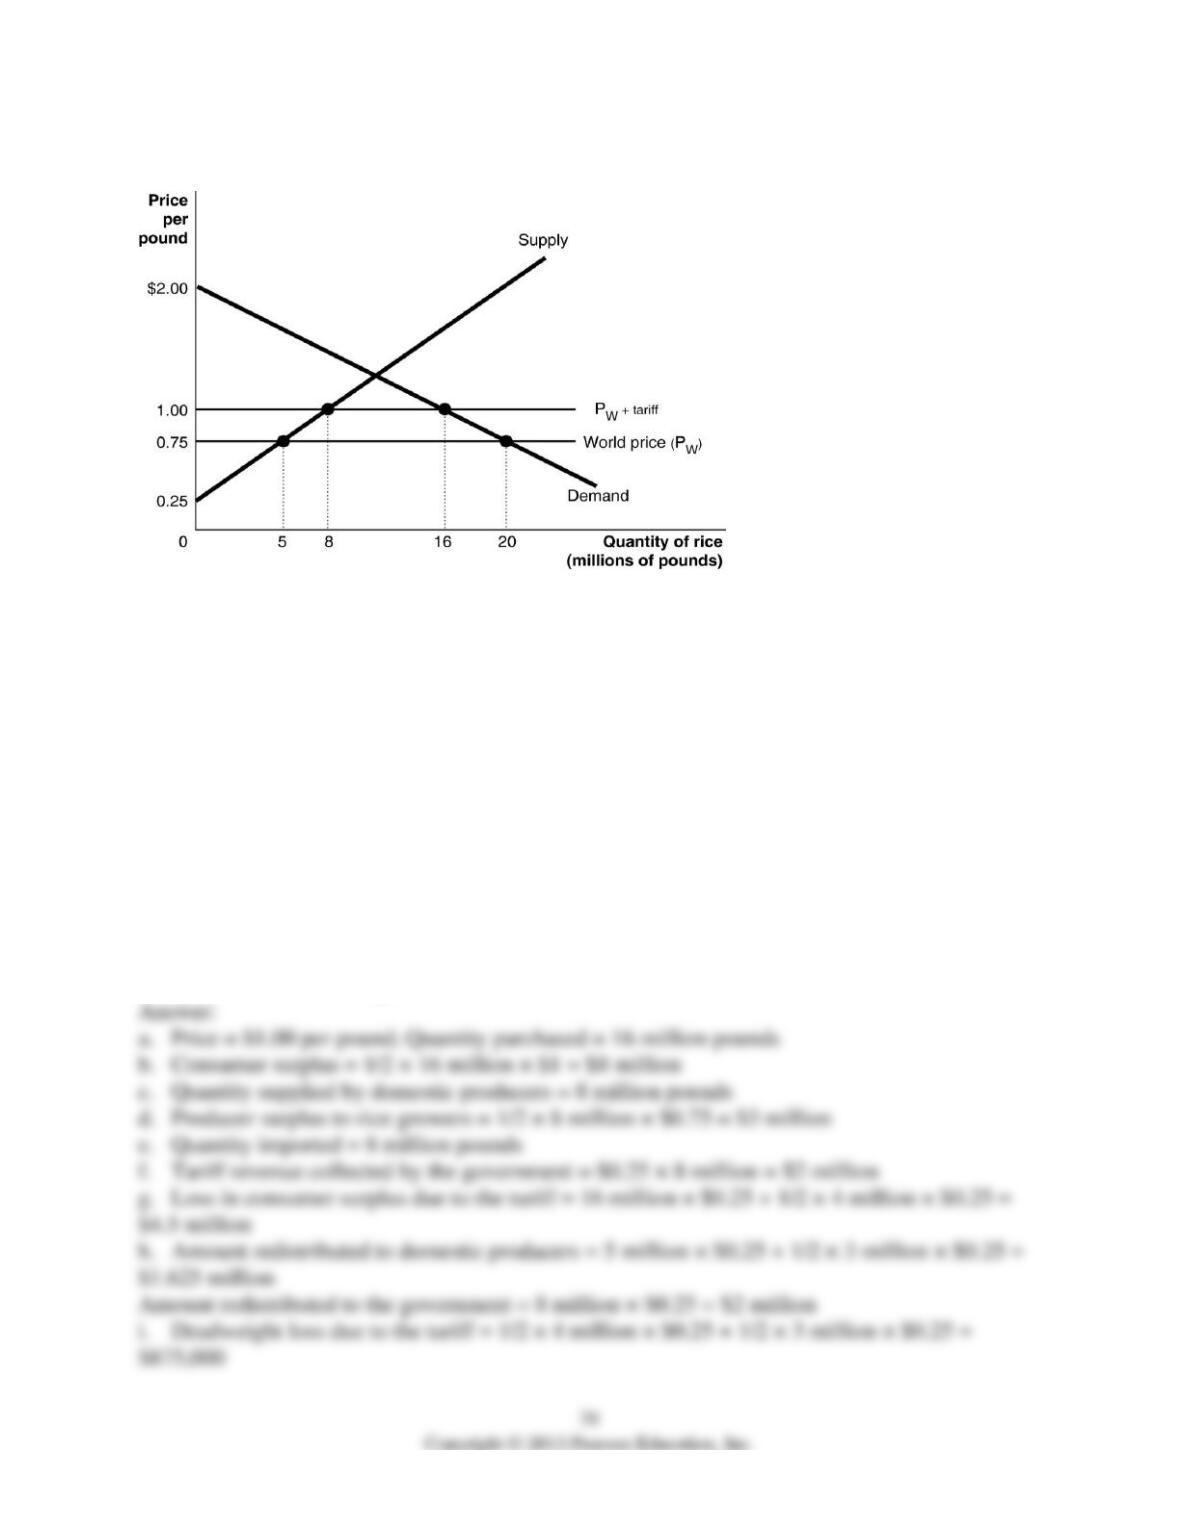
Figure 9-4
38) Refer to Figure 9-4. Suppose the U.S. government imposes a $0.25 per pound tariff on rice
imports. Figure 9-4 shows the demand and supply curves for rice and the impact of this tariff.
Use the figure to answer questions a-i.
a. Following the imposition of the tariff, what is the price that domestic consumers must now
pay and what is the quantity purchased?
b. Calculate the value of consumer surplus with the tariff in place.
c. What is the quantity supplied by domestic rice growers with the tariff in place?
d. Calculate the value of producer surplus received by U.S. rice growers with the tariff in place.
e. What is the quantity of rice imported with the tariff in place?
f. What is the amount of tariff revenue collected by the government?
g. The tariff has reduced consumer surplus. Calculate the loss in consumer surplus due to the
tariff.
h. What portion of the consumer surplus loss is redistributed to domestic producers? To the
government?
i. Calculate the deadweight loss due to the tariff.
39
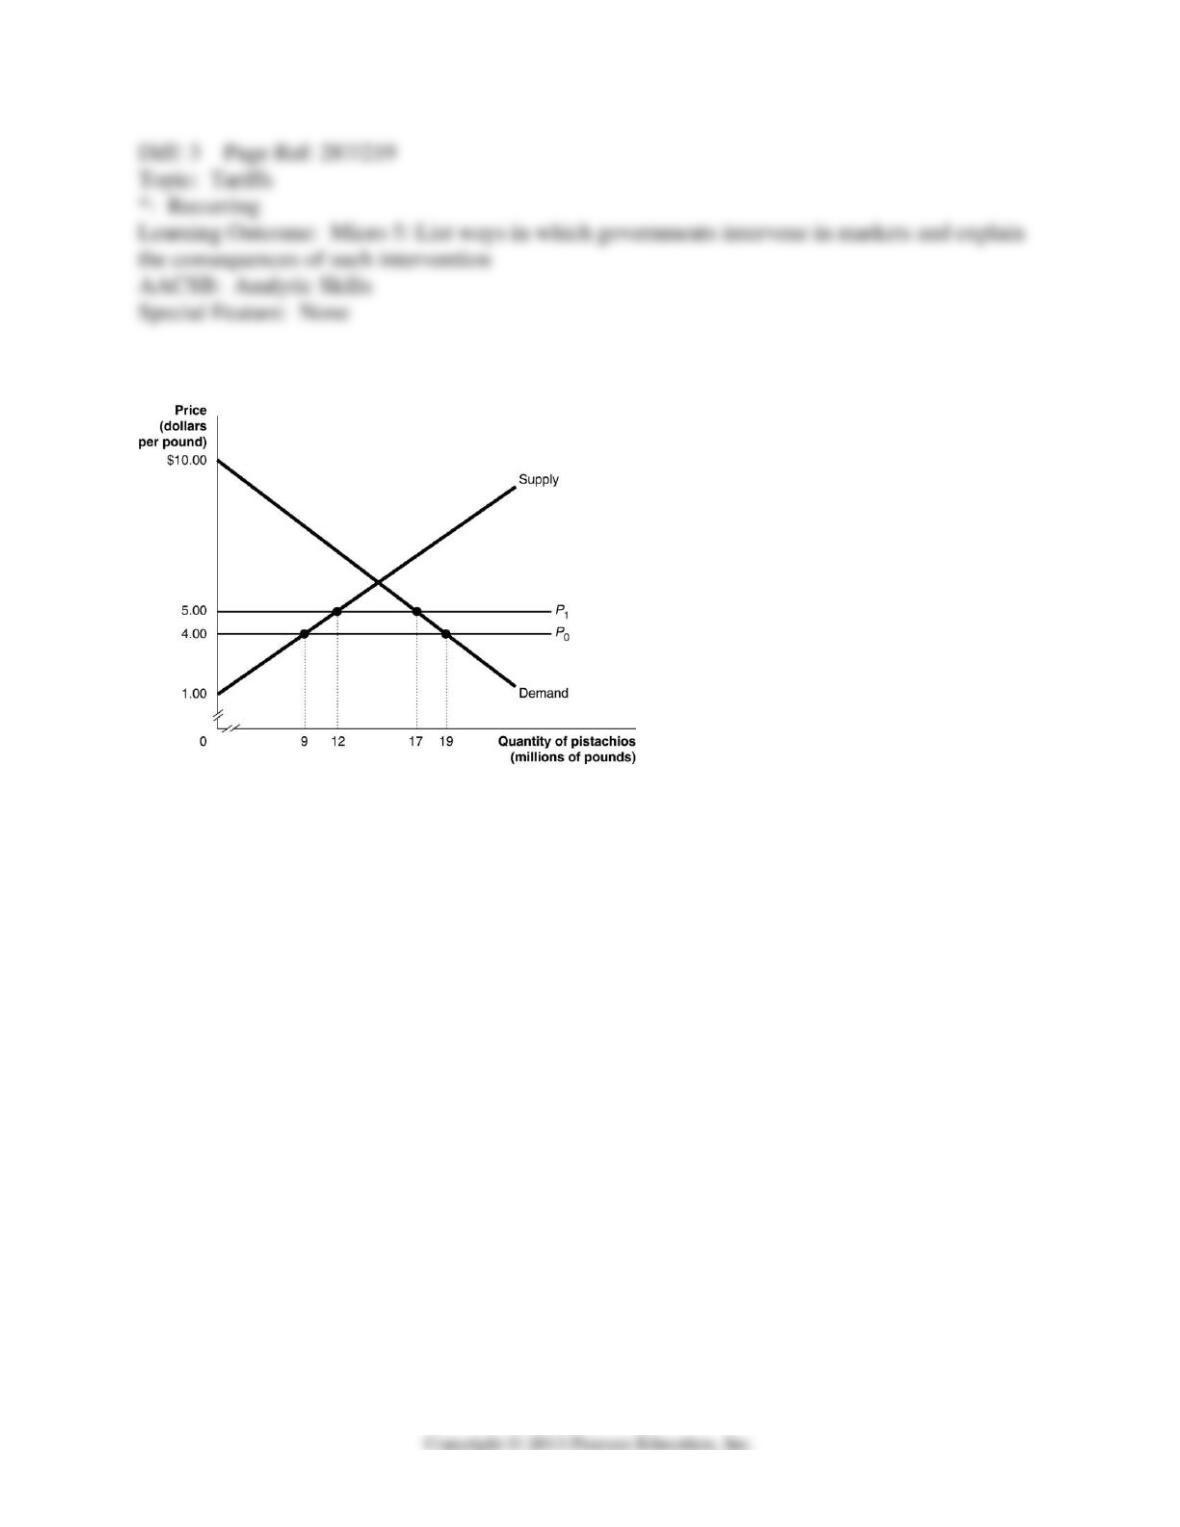
Figure 9-5
39) Refer to Figure 9-5. Fenwick currently both produces and imports pistachios. The
government of Fenwick decides to restrict international trade in pistachios by imposing a quota
that allows imports of only 5 million pounds each year. Figure 9-5 shows the estimated demand
and supply curves for pistachios in Fenwick and the results of imposing the quota. Answer
questions a-j using the figure.
a. If there is no quota what is the domestic price of pistachios and what is the quantity of
pistachios demanded by consumers?
b. If there is no quota how many pounds of pistachios would domestic producers supply and
what quantity would be imported?
c. If there is no quota what is the dollar value of consumer surplus?
d. If there is no quota what is the dollar value of producer surplus received by producers in
Fenwick?
e. If there is no quota what is the revenue received by foreign producers who supply pistachios
to Fenwick?
f. With a quota in place what is the price that consumers of Fenwick must now pay and what is
the quantity demanded?
g. With a quota in place what is the dollar value of consumer surplus? Are consumers better
off?
h. With a quota in place what is the dollar value of producer surplus received by producers in
Fenwick? Are domestic producers better off?
i. Calculate the revenue to foreign producers who are granted permission to sell in Fenwick
after the imposition of the quota.
j. Calculate the deadweight loss as a result of the quota.
40) a. Distinguish between a tariff and a quota.
b. In what ways are tariffs and quotas similar?
c. In what ways are tariffs and quotas different?
d. Why might a foreign producer prefer a quota rather than a tariff?
9.5 The Arguments over Trade Policies and Globalization
1) In the United States during the Great Depression, tariffs were ________ than they were
following World War II, and ________ than they are today.
A) higher; higher
B) higher; lower
C) lower; higher
D) lower; lower
2) The Smoot-Hawley Tariff
A) lowered U.S. tariffs by 50 percent following World War II.
B) was passed by the U.S. Congress following the Civil War as a means of increasing
government revenue.
C) was passed by the U.S. Congress upon a recommendation made by the General Agreement on
Tariffs and Trade (GATT) in 1948.
D) raised average tariff rates by over 50 percent in the United States in 1930.
3) In 1930, the U.S. government attempted to help domestic firms that were harmed by the Great
Depression by passing the Smoot-Hawley Tariff. In response to this tariff, other countries
________ and international trade ________.
A) lowered their tariffs; thrived
B) raised their tariffs; collapsed
C) eliminated tariffs; began to grow outside of the United States
D) doubled their tariffs; became unrestricted
4) In 1995, the General Agreement on Tariffs and Trade (GATT), which was established in
1948, was replaced by the World Trade Organization (WTO). Why did members of the GATT
push for the establishment of the WTO?
A) The GATT agreement only covered trade in goods. The WTO was created to cover trade in
goods, services and intellectual property.
B) The charter of the GATT had run out and a new organization was needed to promote
international trade.
C) The creation of the European Union (EU) made the GATT obsolete. The WTO was formed to
regulate trade between the EU and other nations.
D) By 1995 tariffs had been eliminated. The WTO was created to reduce non-tariff trade
barriers.
5) The World Trade Organization (WTO) promotes foreign trade and investment, or
globalization. In recent years opposition to globalization has led to violent protests at meetings of
the WTO. All of the following are reasons for these anti-globalization protests except
A) protestors believe the WTO favors the interests of high-income countries at the expense of
lower-income countries.
B) protesters believe that tariffs are needed to protect domestic firms from foreign competition.
C) protesters believe that free trade destroys the distinctive cultures of many countries.
D) protesters object to the loss of intellectual property (such as software programs and movies)
that results from foreign trade and investment.
6) Prior to the 1998 World Cup, France banned the use of all soccer balls made by child workers.
Several economists criticized the ban. Which of the following is an argument these economists
used to justify the use of child labor in some countries?
A) Soccer balls are easy to carry and workers were given soccer balls to play with.
B) Child workers were allowed to attend school during the periods they worked.
C) Child workers were given gloves to protect their hands while they stitched soccer balls.
D) Some of the alternatives to stitching soccer balls include begging and prostitution.
7) Protectionism is the use of ________ to protect domestic firms from foreign competition.
A) military force
B) trade barriers
C) cheap labor
D) dumping
8) Your roommate Hansen argues that American producers cannot compete with foreign
producers because wages are lower in foreign countries than in the United States. Hansen
A) is incorrect. Free trade raises living standards by increasing economic efficiency.
B) is right in asserting the need to protect high wages if the United States wishes to maintain its
high standard of living.
C) is correct in arguing that the high wages of U.S. workers make it impossible to compete with
workers in low-wage countries.
D) is advancing the anti-dumping argument for protectionism.
9) Many economists ________ protectionism because it ________ consumers and ________
jobs in domestic industries that use protected products.
A) support; benefits; creates
B) criticize; causes losses to; eliminates
C) support; lowers prices for; raises wages for
D) criticize; unfairly rewards; relocates
10) All but one of the following statements is used to justify protectionism. Which statement is
not used to justify protectionism?
A) Free trade leads to higher prices for imported goods.
B) Free trade reduces employment by driving domestic firms out of business.
C) A country should not rely on other countries for goods that are critical to its national defense.
D) Trade restrictions are necessary to protect new firms until they can gain experience and
become more productive.
11) Domestic producers require time to gain experience and lower their unit costs; this will allow
these producers to compete successfully in international markets. This statement describes the
________ argument for protectionism.
A) diseconomies of scale
B) protecting national security
C) anti-dumping
D) infant industry
12) Which of the following describes the national security argument for protectionism?
A) Nearly all industries can make some claim to strategic importance so such trade restrictions
can get out of hand.
B) Increases in economic surplus outweigh the decreases in consumer surplus that result from
protectionism.
C) Some goods should be insulated from foreign competition to ensure an adequate supply of
these goods in the event of an international conflict.
D) Private companies (for example, Coca-Cola) should not be forced to reveal their trade secrets
to foreign companies.
13) Economists believe the most persuasive argument for protectionism is to
A) save jobs.
B) protect high wages.
C) protect national security.
D) protect infant industries.
14) Dumping refers to
A) selling inferior products to unsuspecting consumers.
B) selling a product for a price below its cost of production.
C) exporting products that do not meet domestic safety standards.
D) illegally avoiding tariffs by selling products on the black market.
15) It is difficult to determine if foreign companies are selling their products for prices below
their costs of production because
A) the true costs of production are difficult to calculate.
B) the firms have no legal obligation to reveal this information.
C) costs are calculated in the firms’ local currencies.
D) domestic taxes increase the firms’ costs but it is difficult to determine the incidence of these
taxes.
16) In general, the costs tariffs and quotas impose on consumers are
A) large in total but relatively small per person.
B) small in total but relatively large per person.
C) large in total and large per person.
D) small in total and small per person.
17) The quota on imported sugar costs U.S. consumers more than $2 billion annually and
protects very few jobs. Why does Congress maintain a sugar quota that protects only a few
thousand workers while forcing millions of people to pay higher prices for sugar products?
A) Most U.S. citizens do not buy sugar products and want to help workers in the sugar industry.
B) Voters fear that if they oppose the sugar lobby, the lobby may oppose issues that they want
Congress to support.
C) Citizens are not as involved in social and political issues as they used to be.
D) The per person cost of the sugar quota is too small for many people to lobby Congress to
make their views known.
18) A “Buy American” provision in the 2009 stimulus bill would ________ consumer surplus
and ________ producer surplus for industries that produce protected products in the United
States.
A) increase; increase
B) increase; decrease
C) decrease; increase
D) decrease; decrease
19) For the U.S. steel industry, a “Buy American” provision in the 2009 stimulus bill would
create gains for all of the following except
A) U.S. steel companies.
B) U.S. steel workers.
C) foreign steel companies still able to sell in the United States.
D) U.S. taxpayers.
20) The General Agreement on Tariffs and Trade (GATT) was formed to replace the World
Trade Organization (WTO) because the WTO was empowered only to reduce barriers to trade in
goods. The GATT is an agreement to reduce barriers to trade in goods, services and intellectual
property.
21) In 1995, the General Agreement on Tariffs and Trade (GATT) was replaced by the World
Trade Organization (WTO).
22)
a. Define the term “globalization.”
b. Describe the benefits of globalization.
c. Who is likely to oppose globalization and why?
23) Protectionism is usually justified on the basis of one of four arguments. What are those four
arguments?
24) The textbook referred to the following quotation from a Federal Reserve publication: “Trade
is a win-win situation for all countries that participate.” But many firms and workers oppose free
trade policies and protests against globalization have become a regular occurrence at meetings of
the World Trade Organization. If trade is a “win-win” situation, why is there strong opposition to
free trade and globalization?