Application: International Trade 2325
106. Refer to Figure 9-9. Consumer surplus in this market before trade is
a. A.
b. A + B.
c. A + B + D.
d. C.
107. Refer to Figure 9-9. Consumer surplus in this market after trade is
a. A.
b. A + B.
c. A + B + D.
d. C.
2326 Application: International Trade
108. Refer to Figure 9-9. Producer surplus in this market before trade is
a. A.
b. A + B.
c. B + C + D.
d. C.
109. Refer to Figure 9-9. Producer surplus in this market after trade is
a. A.
b. A + B.
c. B + C + D.
d. C.
110. Refer to Figure 9-9. Total surplus in this market before trade is
a. A + B.
b. A + B + C.
c. A + B + C + D.
d. B + C + D.
Application: International Trade 2327
111. Refer to Figure 9-9. Total surplus in this market after trade is
a. A + B.
b. A + B + C.
c. A + B + C + D.
d. B + C + D.
112. Refer to Figure 9-9. The change in total surplus in this market because of trade is
a. D, and this area represents a loss of total surplus because of trade.
b. D, and this area represents a gain in total surplus because of trade.
c. B + D, and this area represents a loss of total surplus because of trade.
d. B + D, and this area represents a gain in total surplus because of trade.
2328 Application: International Trade
Figure 9–10. The figure applies to Mexico and the good is rifles.
113. Refer to Figure 9-10. The price and quantity of rifles in Mexico before trade is
a. P0 and Q0.
b. P1 and Q1.
c. P2 and Q2.
d. P1 and Q0.
Application: International Trade 2329
114. Refer to Figure 9-10. With trade, the equilibrium price of rifles and the equilibrium quantity of
rifles demanded in Mexico are
a. P1 and Q1.
b. P1 and Q2.
c. P2 and Q2.
d. P0 and Q0.
115. Refer to Figure 9-10. When trade takes place, the quantity Q2 – Q1 is
a. the number of rifles bought and sold in Mexico.
b. the number of rifles produced in Mexico.
c. the number of rifles exported by Mexico.
d. the number of rifles imported by Mexico.
2330 Application: International Trade
116. Refer to Figure 9-10. Mexico’s gains from trade are represented by the area that is bounded
by the points
a. (0, P0), (Q0, P0), (Q2, P1), and (0, P1).
b. (0, P1), (0, P2), (Q0, P0), and (Q1, P1).
c. (Q0, P0), (Q2, P1), and (Q1, P1).
d. (0, P0), (0, P2), and (Q0, P0).
117. Refer to Figure 9-10. The area bounded by the points (Q0, P0), (Q2, P1), and (Q1, P1)
represents
a. Mexico’s gains from trade.
b. the amount by which Mexico’s gain in consumer surplus exceeds its loss in producer surplus
due to trade.
c. Mexico’s gain in total surplus due to trade.
d. All of the above are correct.
Application: International Trade 2331
118. Refer to Figure 9-10. The area bounded by the points (Q0, P0), (Q2, P1), and (Q1, P1)
represents
a. Mexico’s gains from trade.
b. the amount by which Mexico’s gain in producer surplus exceeds its loss in consumer surplus
due to trade.
c. Mexico’s loss in total surplus due to trade.
d. All of the above are correct.
Figure 9-11
2332 Application: International Trade
119. Refer to Figure 9-11. Consumer surplus in this market before trade is
a. A.
b. B + C.
c. A + B + D.
d. C.
120.
Refer to Figure 9-11. Consumer surplus in this market after trade is
a. A.
b. C + B.
c. A + B + D.
d. B + C + D.
121. Refer to Figure 9-11. Producer surplus in this market before trade is
a. C.
b. B + C.
c. A + B + D.
d. B + C + D.
Application: International Trade 2333
122. Refer to Figure 9-11. Producer surplus in this market after trade is
a. C.
b. C + B.
c. A + B + D.
d. B + C + D.
123. Refer to Figure 9-11. Producer surplus plus consumer surplus in this market before trade is
a. A + B.
b. A + B + C.
c. A + B + C + D.
d. B + C + D.
124. Refer to Figure 9-11. Producer surplus plus consumer surplus in this market after trade is
a. A + B.
b. A + B + C.
c. B + C + D.
d. A + B + C + D.
2334 Application: International Trade
125. Refer to Figure 9-11. The change in total surplus in this market because of trade is
a. A, and this area represents a loss of total surplus.
b. B, and this area represents a gain in total surplus.
c. C, and this area represents a loss of total surplus.
d. D, and this area represents a gain in total surplus.
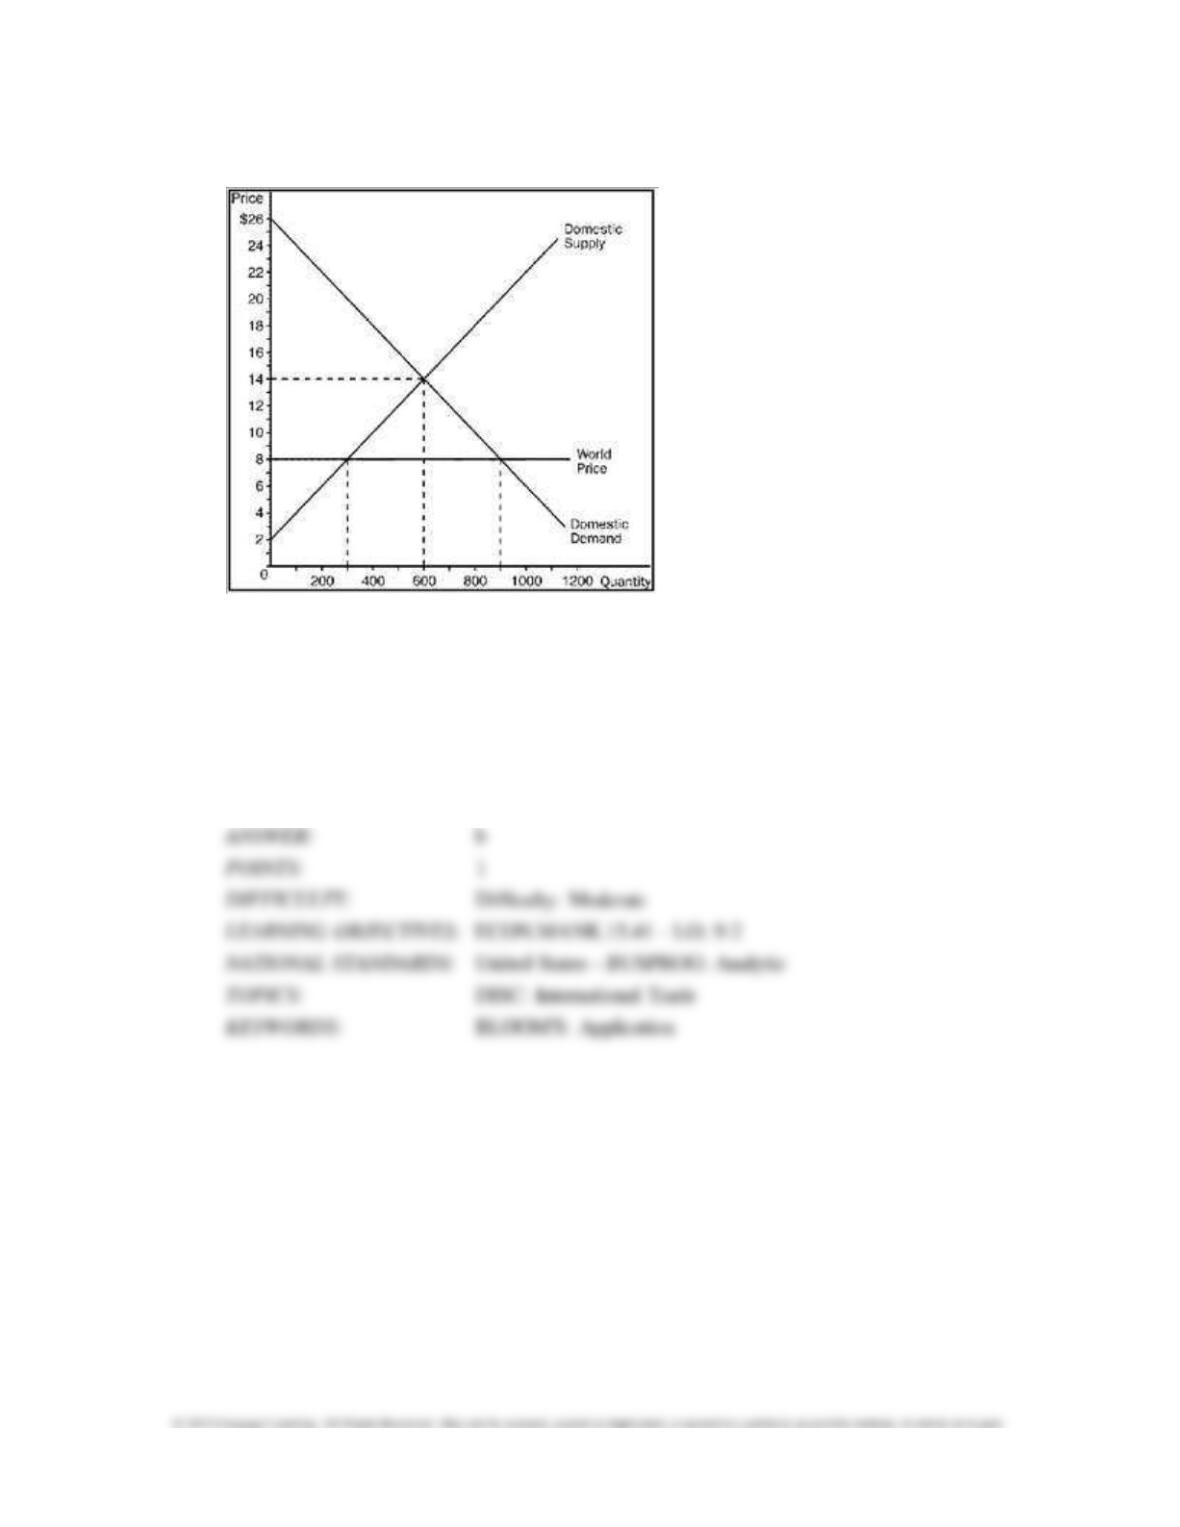
Figure 9-12
Application: International Trade 2335
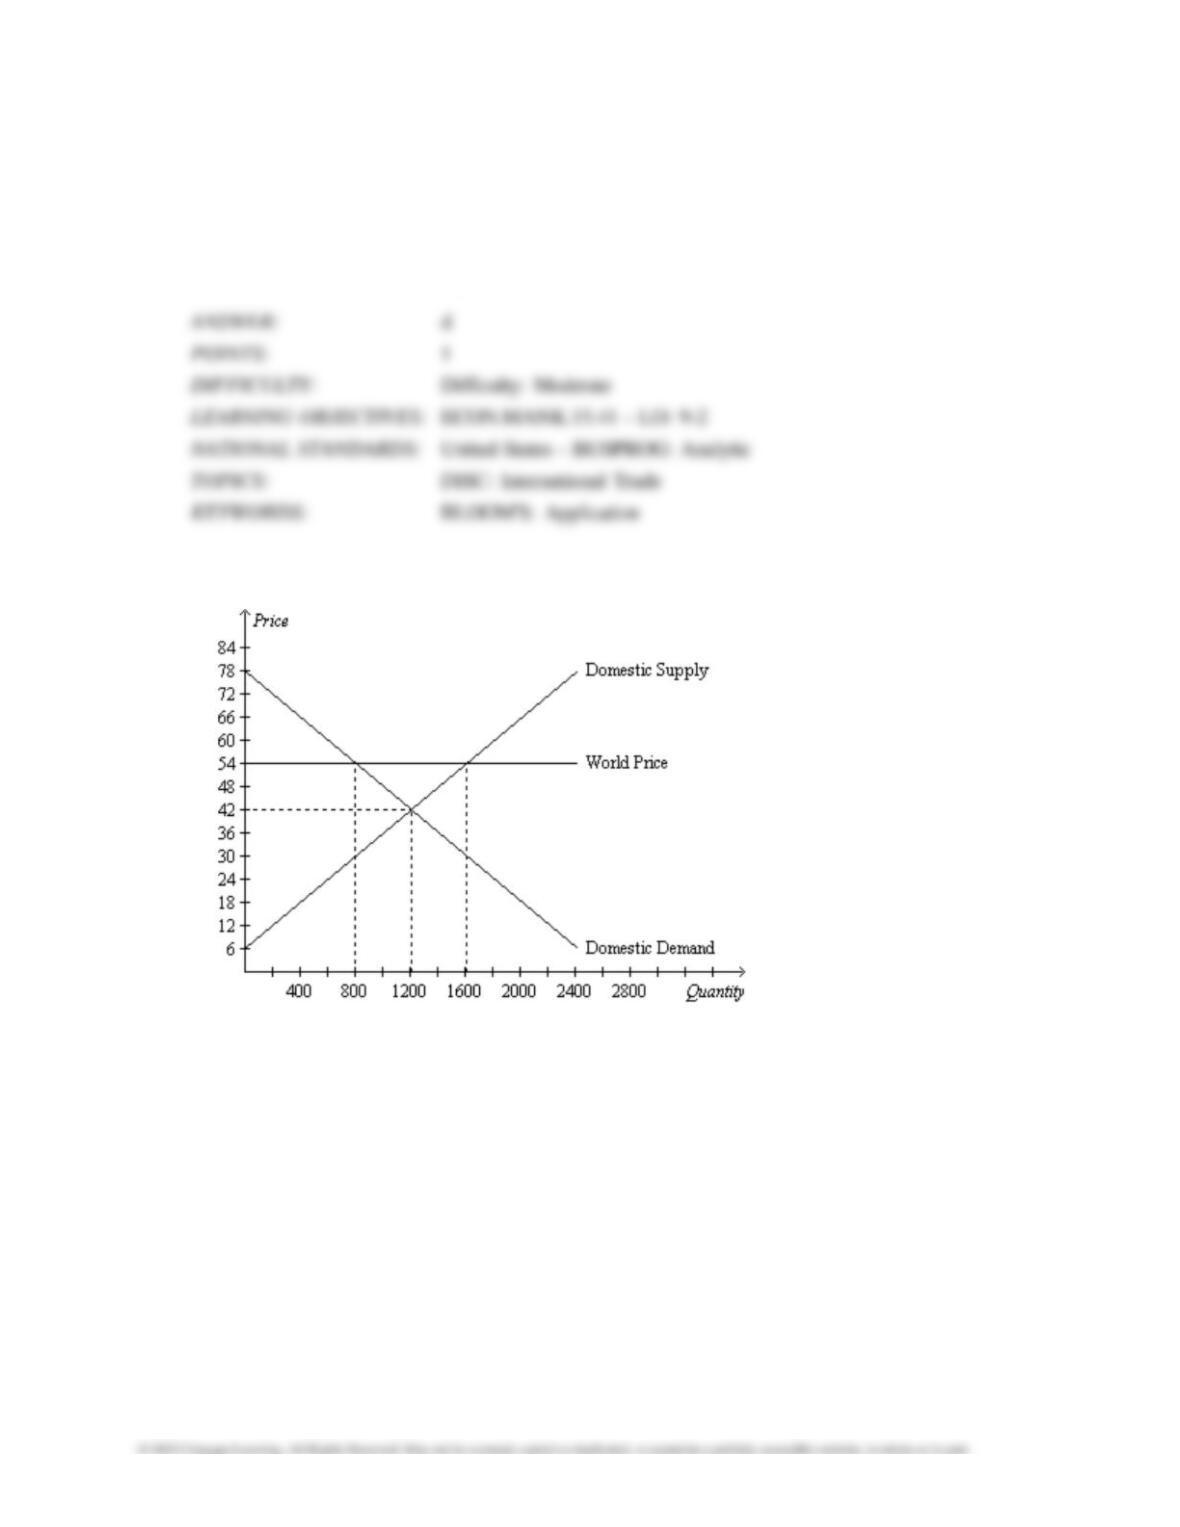
126. Refer to Figure 9-12. Equilibrium price and equilibrium quantity without trade are
a. $54 and 800.
b. $54 and 1,600.
c. $42 and 800.
d. $42 and 1,200.
127. Refer to Figure 9-12. With trade, the domestic price and domestic quantity demanded are
a. $54 and 800.
b. $54 and 1,600.
c. $42 and 800.
d. $42 and 1,200.

2336 Application: International Trade
128. Refer to Figure 9-12. With trade, domestic production and domestic consumption, respectively,
are
a. 1,200 and 800.
b. 1,600 and 800.
c. 800 and 1,200.
d. 800 and 1,600.
129. Refer to Figure 9-12. Consumer surplus before trade is
a. $14,400.
b. $16,800.
c. $21,600.
d. $24,800.
Application: International Trade 2337
130. Refer to Figure 9-12. Consumer surplus after trade is
a. $6,400.
b. $9,600.
c. $12,800.
d. $14,400.
131. Refer to Figure 9-12. Producer surplus before trade is
a. $14,400.
b. $16,800.
c. $21,600.
d. $24,800.

2338 Application: International Trade
132. Refer to Figure 9-12. Producer surplus after trade is
a. $28,000.
b. $30,000.
c. $35,200.
d. $38,400.
133. Refer to Figure 9-12. With trade allowed, this country
a. exports 400 units of the good.
b. exports 800 units of the good.
c. imports 400 units of the good.
d. exports 1,600 units of the good.
Application: International Trade 2339
Figure 9-13
134. Refer to Figure 9-13. The price and domestic quantity demanded after trade are
a. $8 and 300.
b. $8 and 900.
c. $14 and 900.
d. $14 and 600.
2340 Application: International Trade
135. Refer to Figure 9-13. With trade, domestic production and domestic consumption, respectively,
are
a. 600 and 600.
b. 600 and 300.
c. 300 and 900.
d. 600 and 900.
136. Refer to Figure 9-13. Consumer surplus before trade is
a. $1,600.
b. $2,400.
c. $3,200.
d. $3,600.
Application: International Trade 2341
137. Refer to Figure 9-13. Consumer surplus after trade is
a. $3,600.
b. $5,400.
c. $7,200.
d. $8,100.
138. Refer to Figure 9-13. Producer surplus before trade is
a. $3,600.
b. $4,400.
c. $5,200.
d. $6,600.
139. Refer to Figure 9-13. With trade, producer surplus is
a. $900.
b. $1,100.
c. $1,500.
d. $2,000.
2342 Application: International Trade
140. Refer to Figure 9-13. With trade, the country
a. exports 200 units of the good.
b. exports 400 units of the good.
c. imports 400 units of the good.
d. imports 600 units of the good.
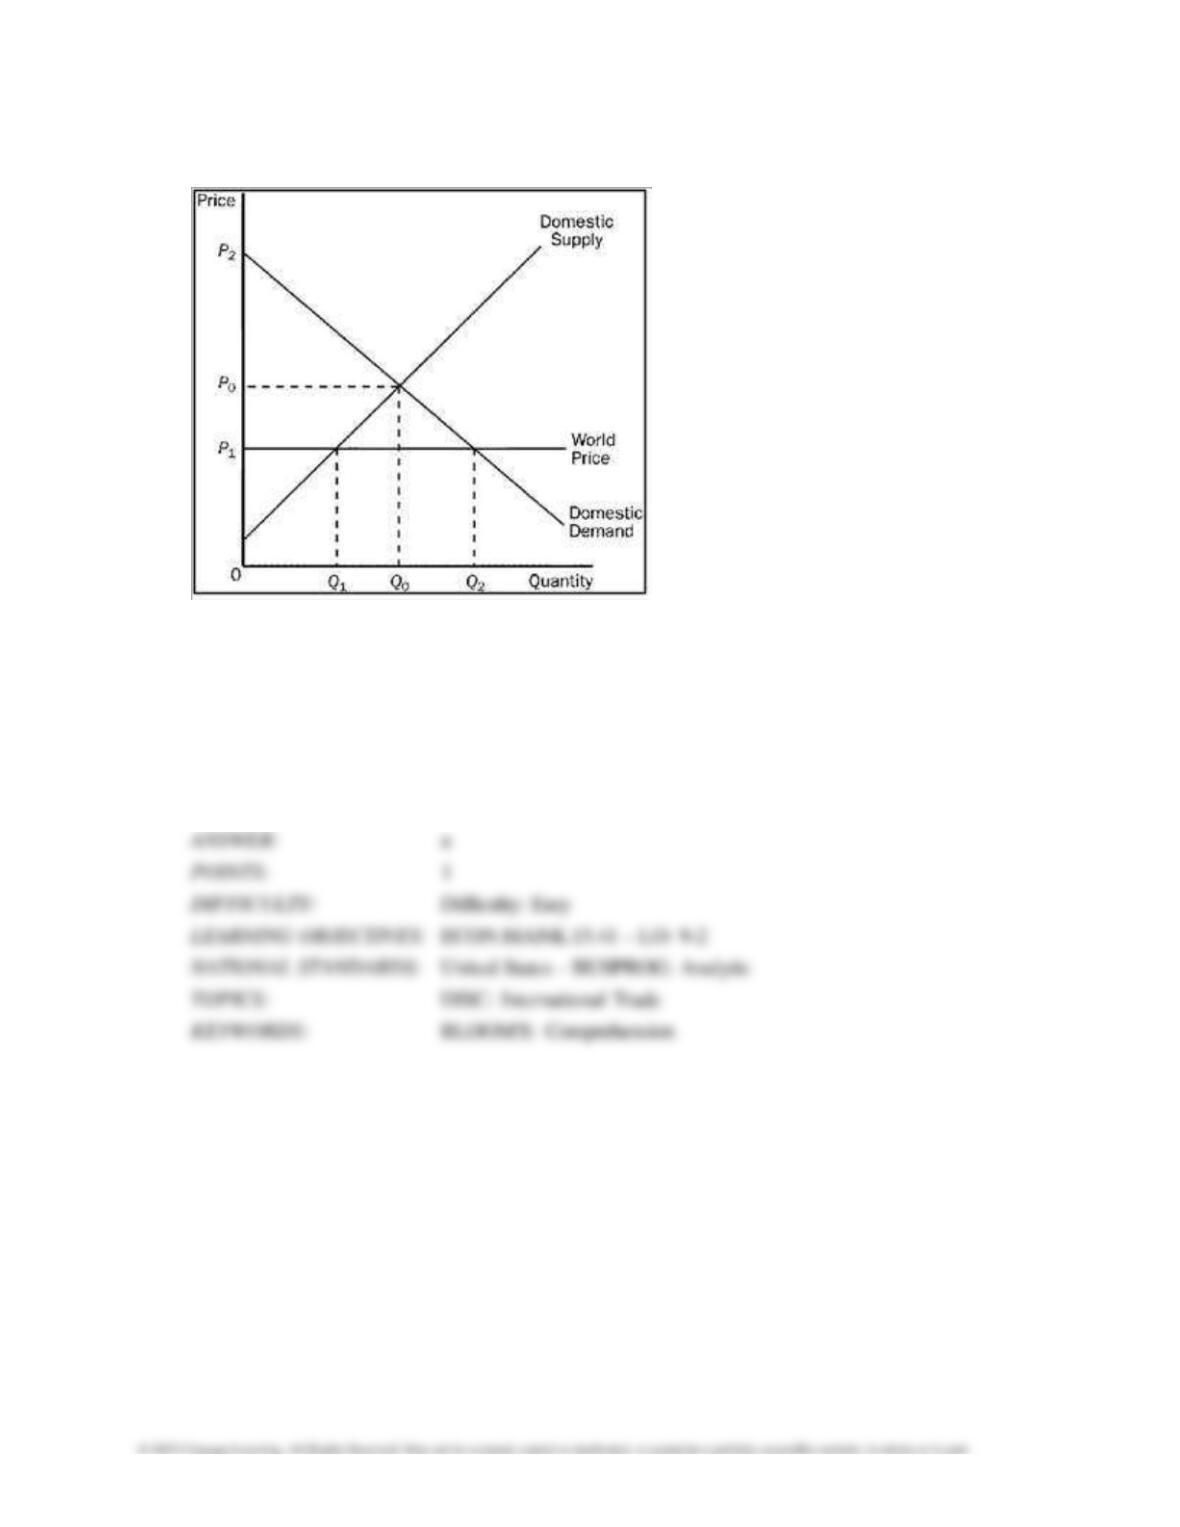
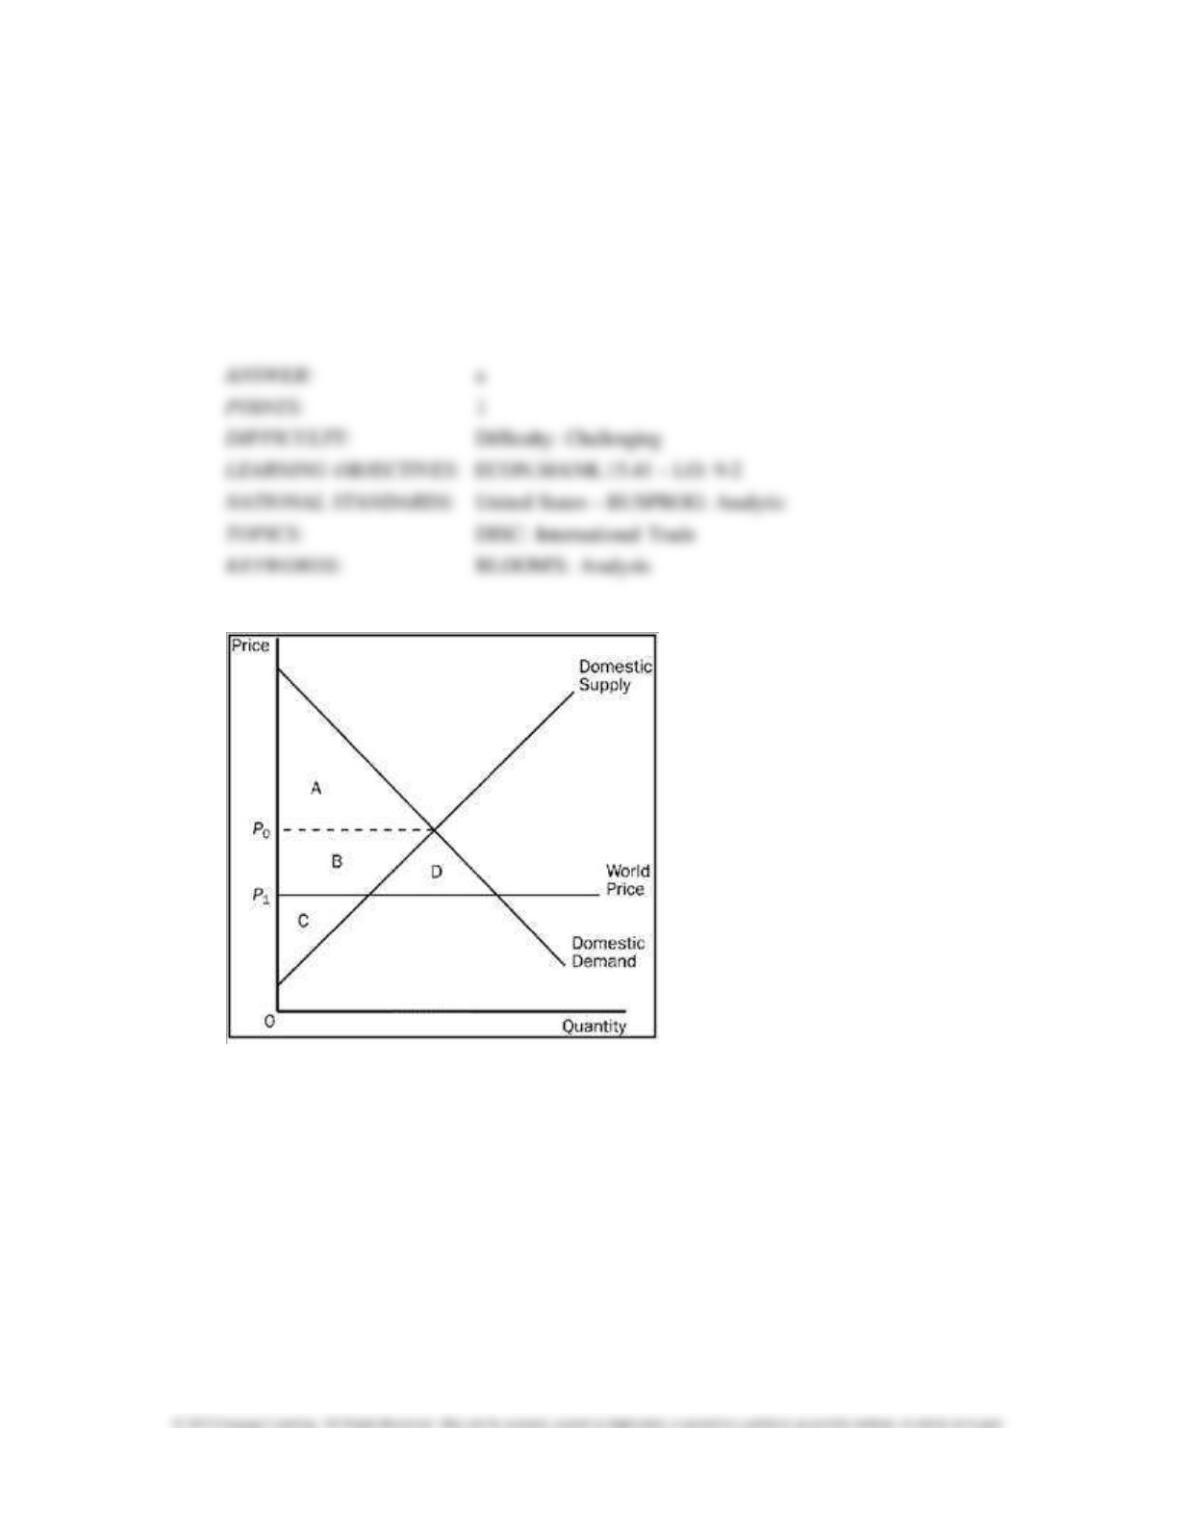
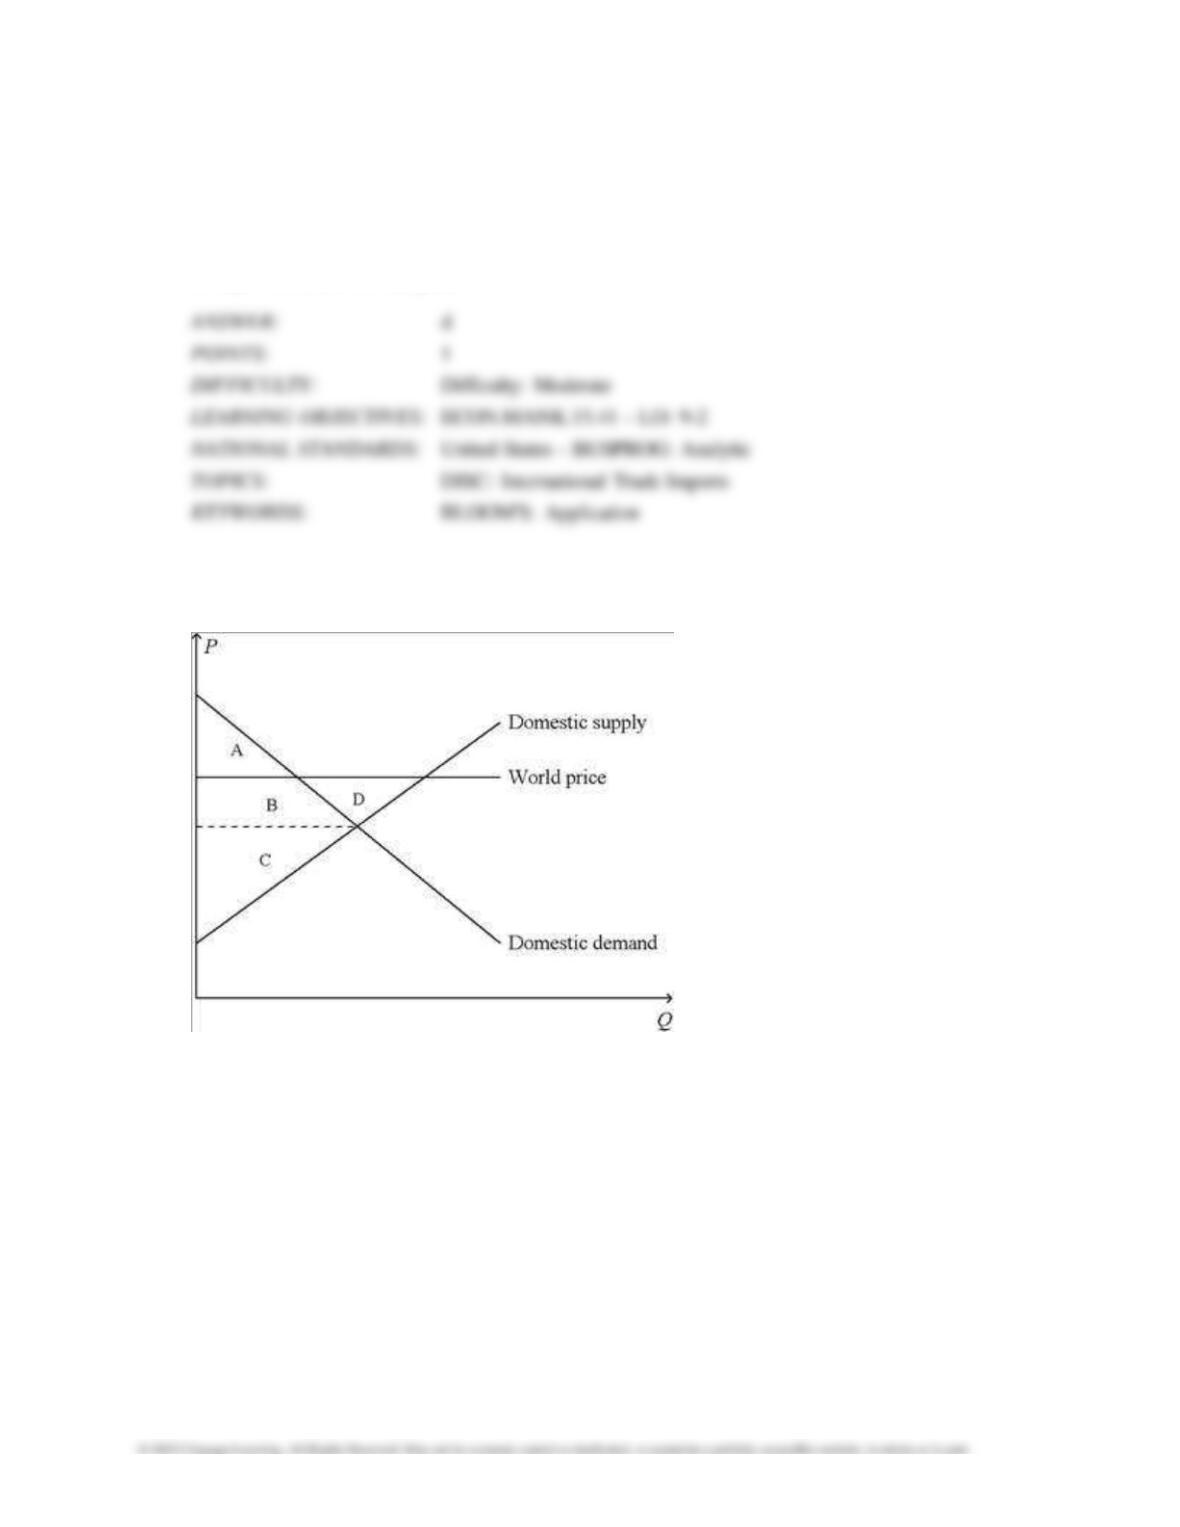
Figure 9-14. On the diagram below, Q represents the quantity of crude oil and P represents the
price of crude oil.
Application: International Trade 2343
141. Refer to Figure 9-14. When the country for which the figure is drawn allows international trade
in crude oil,
a. consumer surplus for domestic crude-oil consumers decreases.
b. the demand for crude oil by domestic crude-oil consumers decreases.
c. the losses of the domestic losers outweigh the gains of the domestic winners.
d. domestic crude–oil producers sell less crude oil.
142. Refer to Figure 9-14. When the country for which the figure is drawn allows international trade
in crude oil,
a. consumer surplus changes from the area A + B + D to the area A.
b. producer surplus changes from the area C to the area B + C + D.
c. total surplus decreases by the area D.
d. All of the above are correct.
2344 Application: International Trade
143. Refer to Figure 9-14. The country for which the figure is drawn
a. has a comparative advantage relative to other countries in the production of crude oil and it
will export crude oil.
b. has a comparative advantage relative to other countries in the production of crude oil and it
will import crude oil.
c. has a comparative disadvantage relative to other countries in the production of crude oil and it
will export crude oil.
d. has a comparative disadvantage relative to other countries in the production of crude oil and it
will import crude oil.
144. Refer to Figure 9-14. A result of this country allowing international trade in crude oil is as
follows:
a. The well-being of domestic crude–oil producers is now higher in that they now sell more crude
oil at a higher price per barrel.
b. The effect on the well-being of domestic crude-oil consumers is unclear in that they now buy
more crude oil, but at a higher price per barrel.
c. The effect on the well-being of the country is unclear in that domestic producer surplus
increases, while the effect on domestic consumer surplus is unclear.
d. All of the above are correct.