Exam
Name___________________________________
SHORT ANSWER. Write the word or phrase that best completes each statement or answers the question.
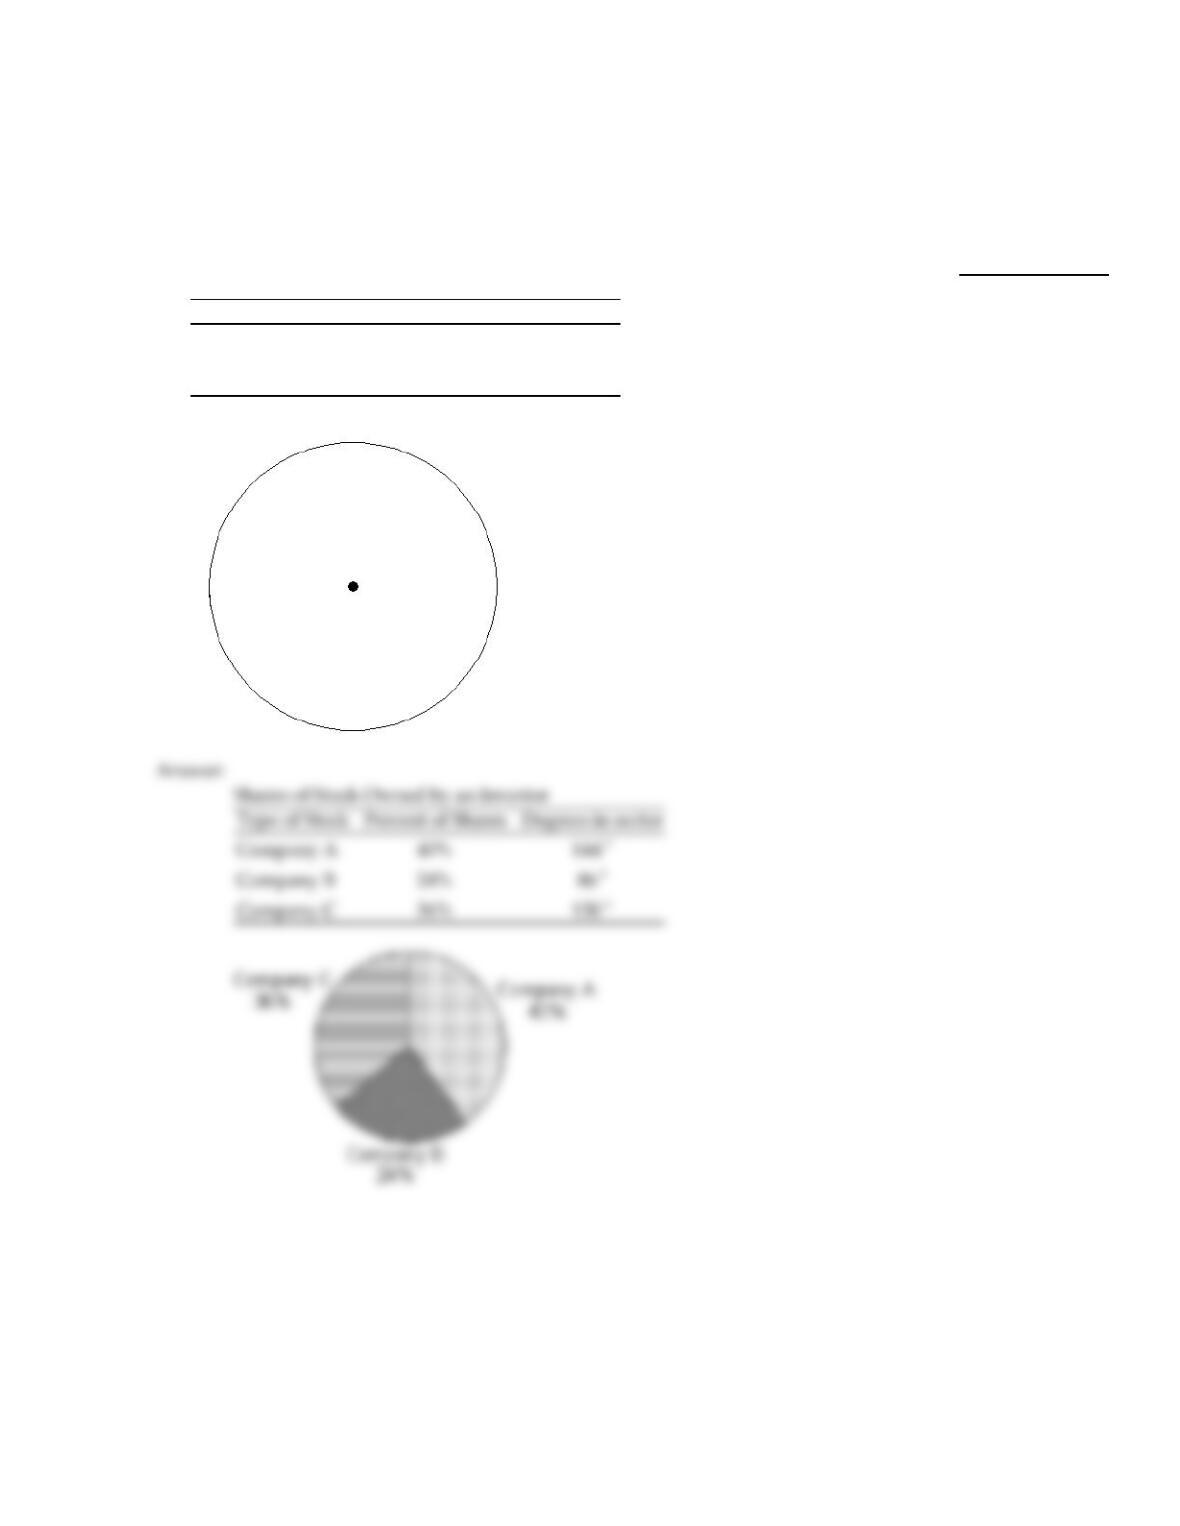
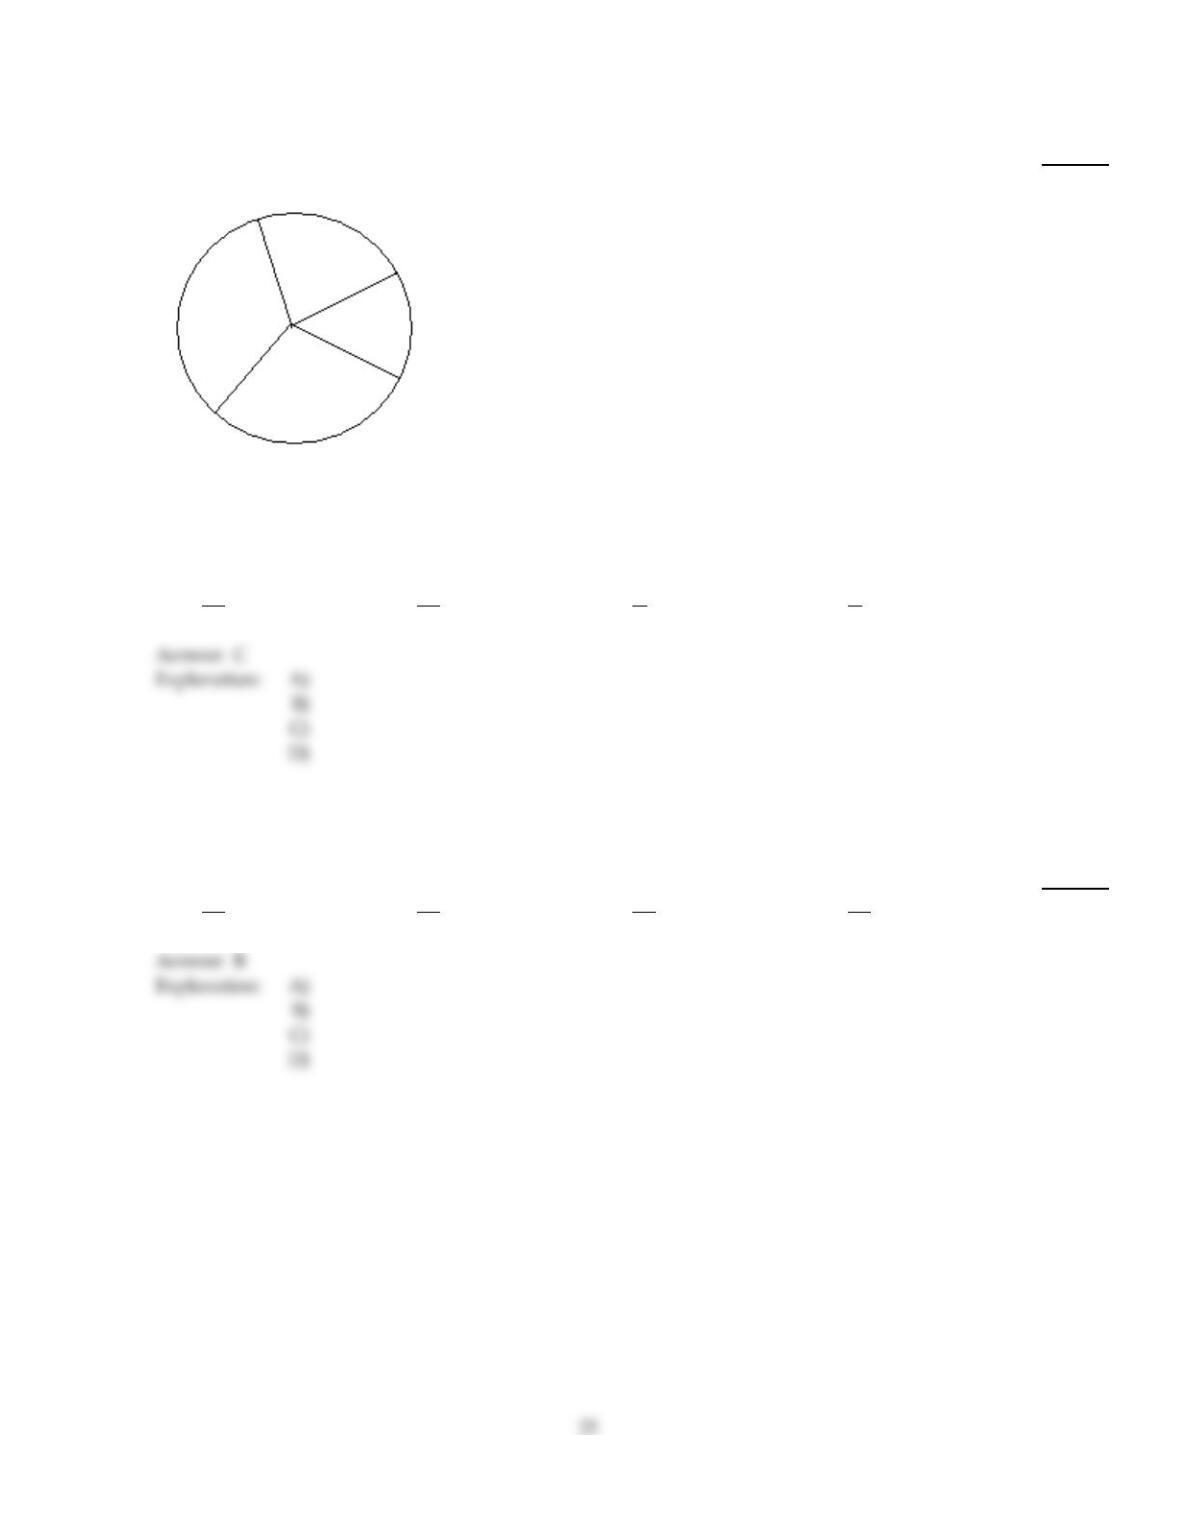
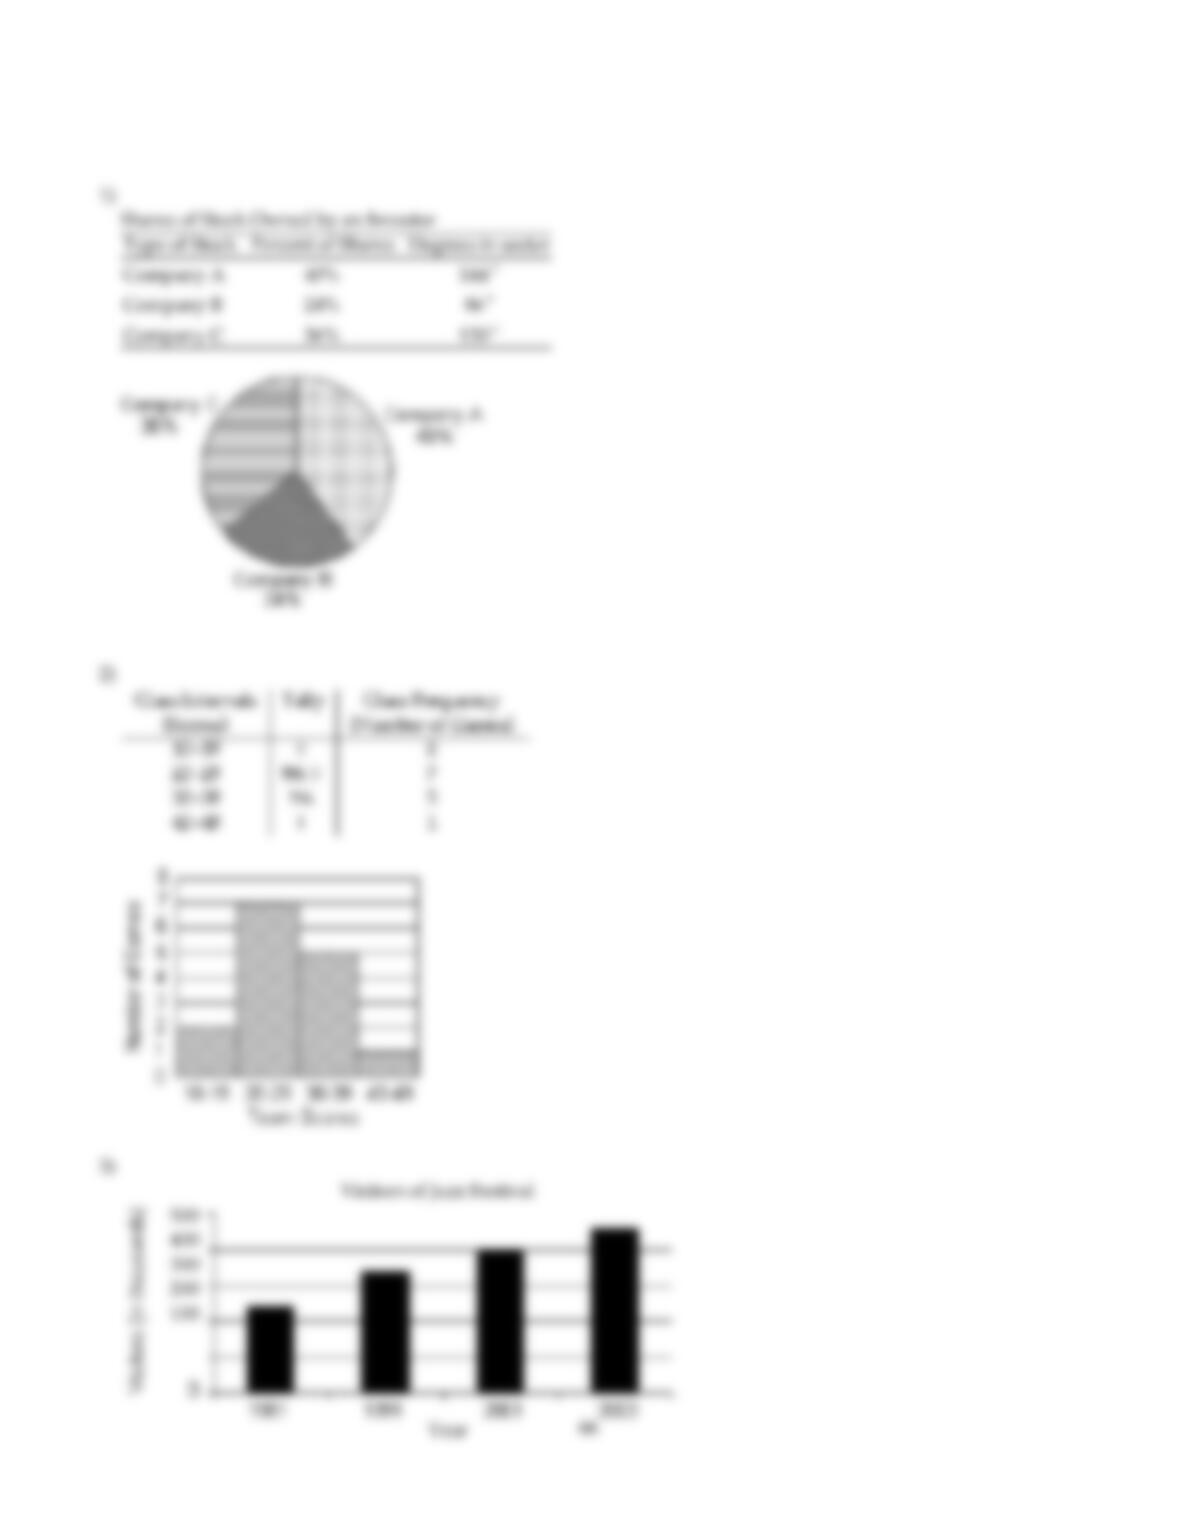
Fill in the table. Round to the nearest degree. Then draw a circle graph to represent the information given in the table.
1)
Shares of Stock Owned by an Investor
Type of Stock Percent of Shares Degrees in sector
Company A 40%
Company B 24%
Company C 36%
1)
Explanation:
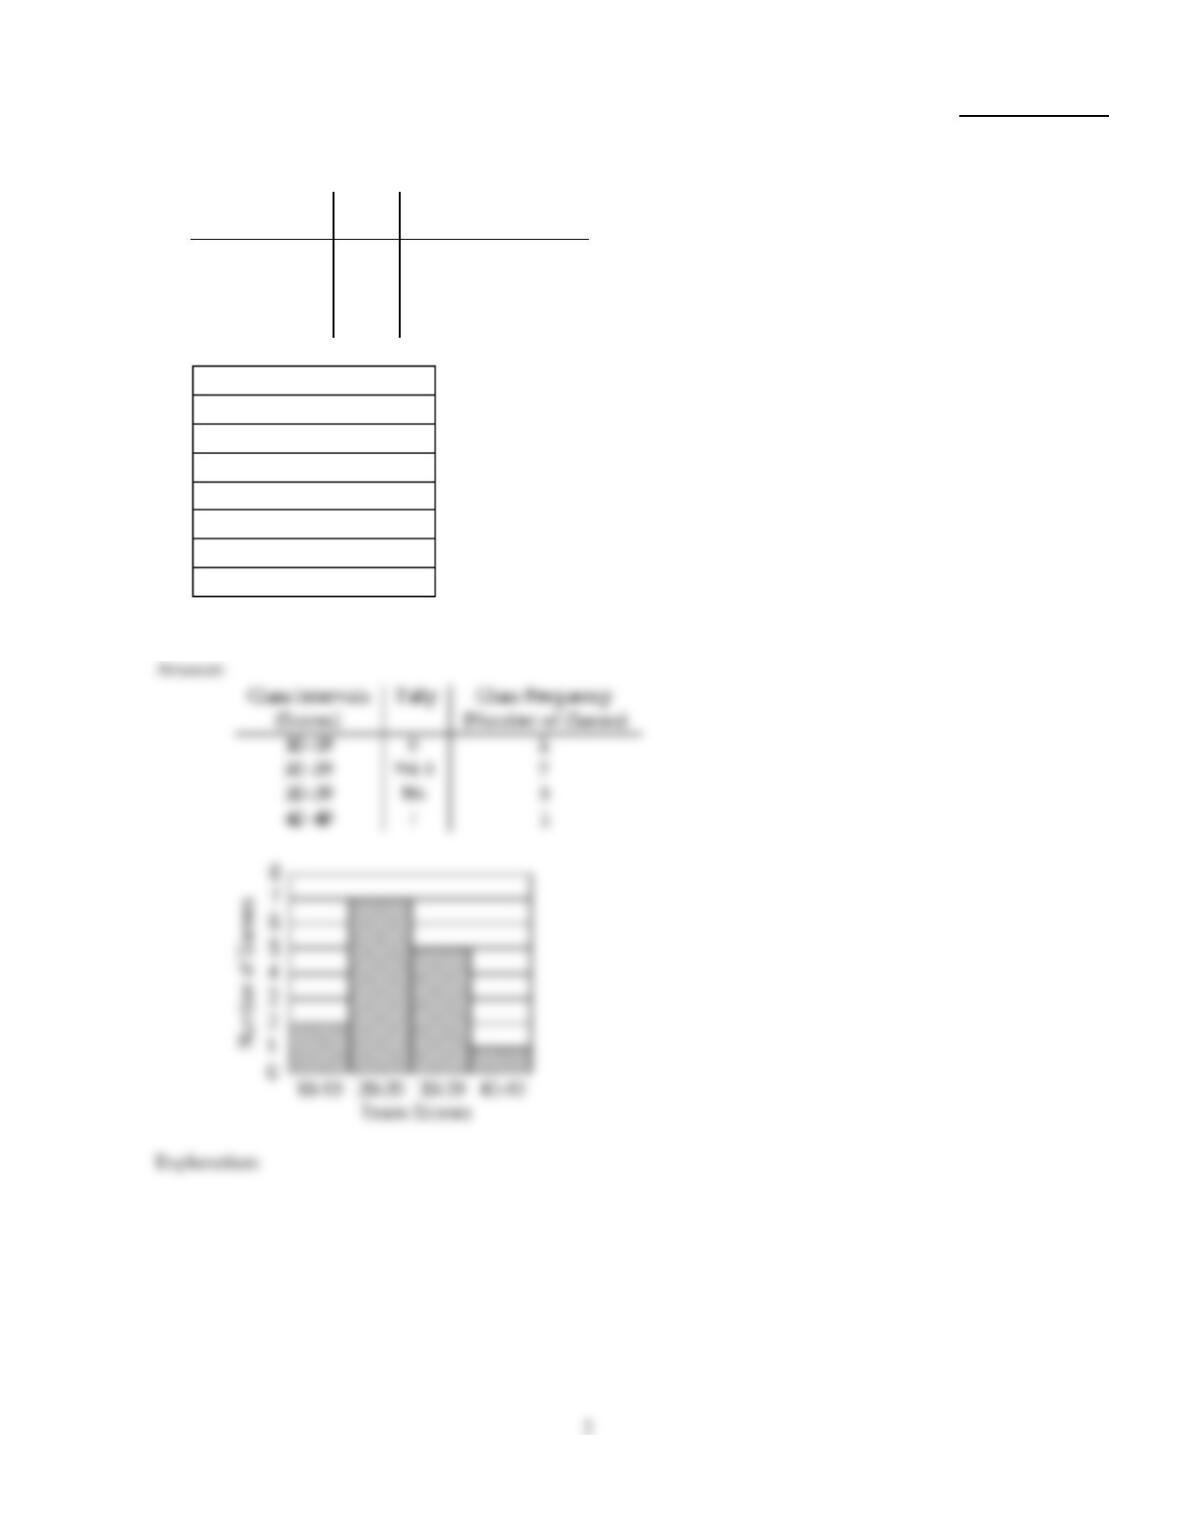
The list shows the scores for a basketball team. Use the list to complete the frequency distribution table and construct a
histogram.
1
2)
18 25 22 25 17
30 26 27 27 31
29 35 32 31 41
Class Intervals
(Scores) Tally Class Frequency
(Number of Games)
10–19
20–29
30–39
40–49
2)
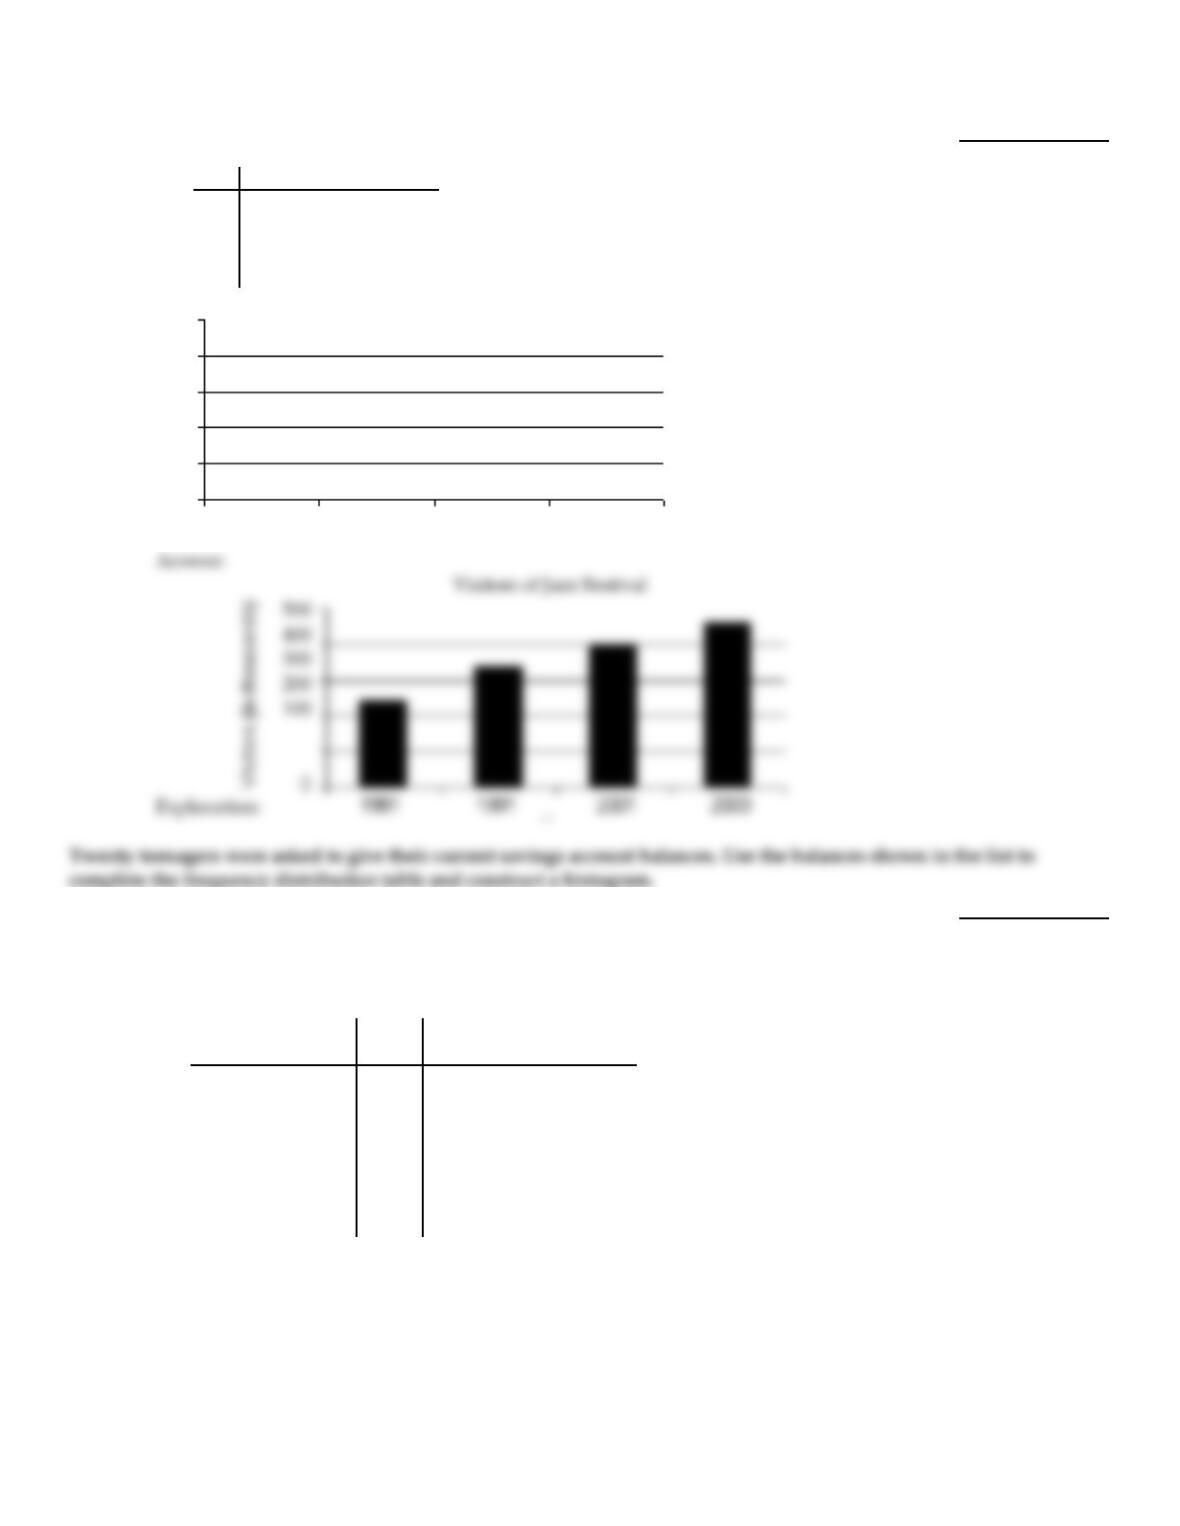
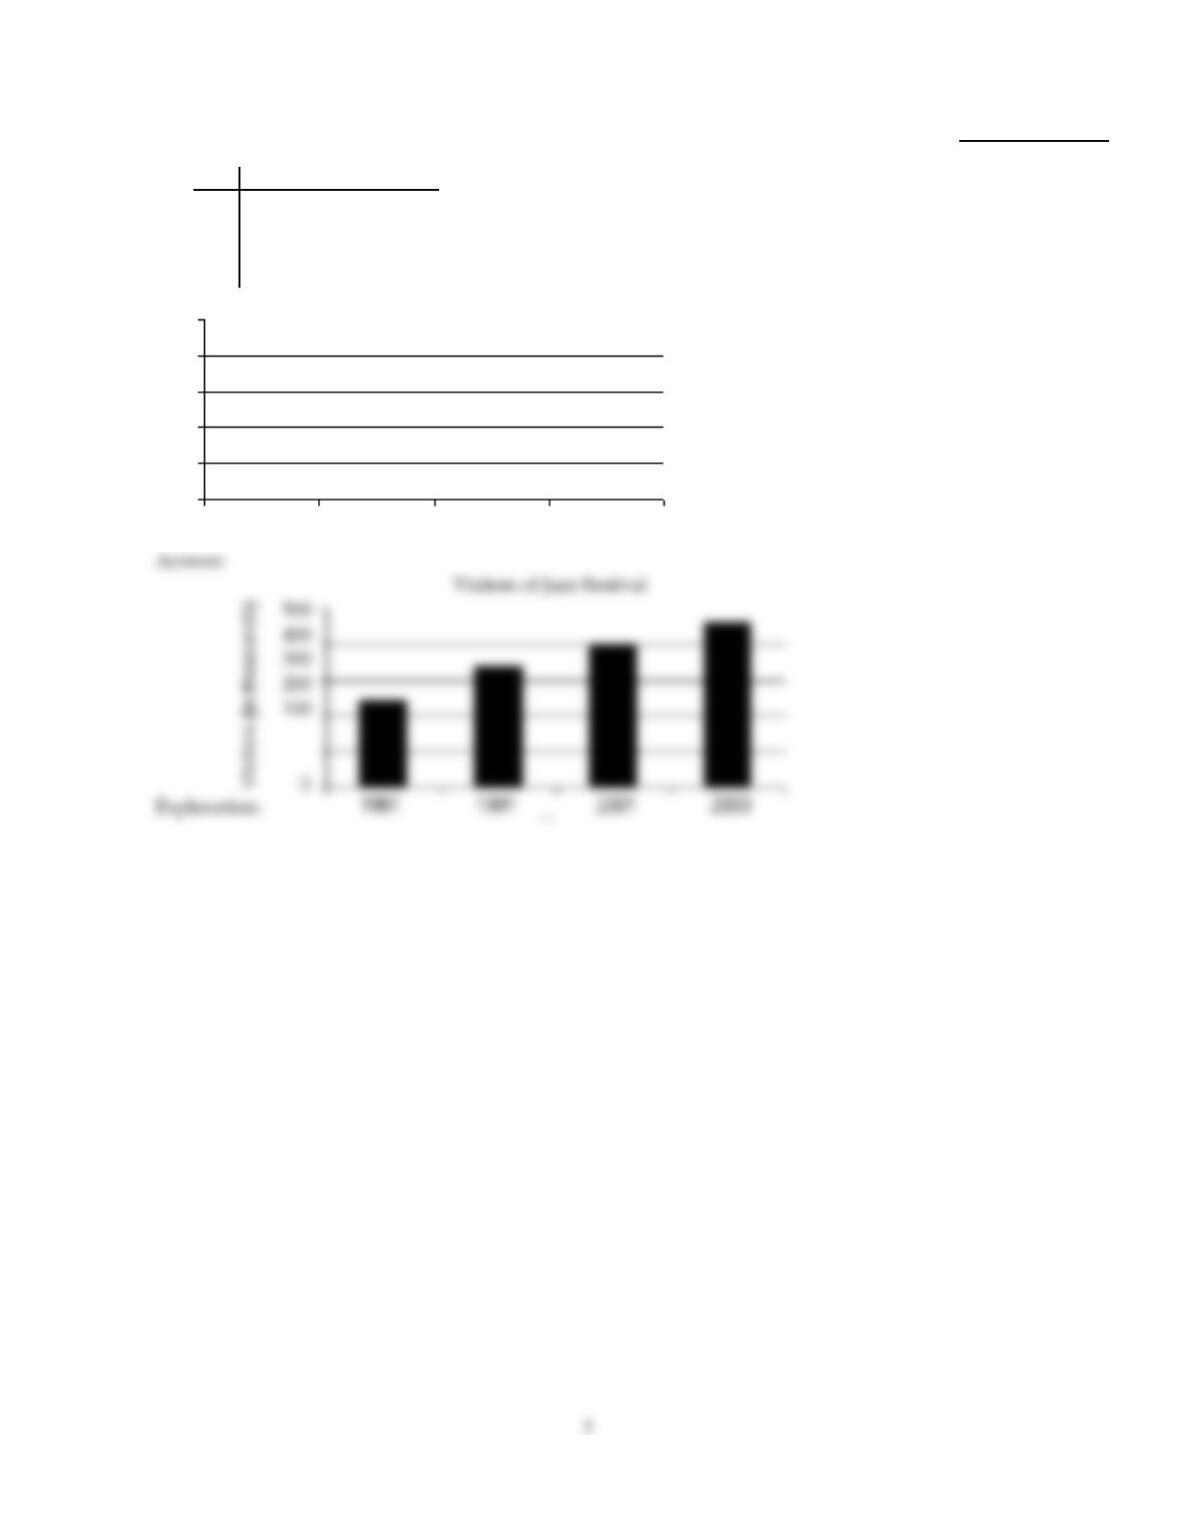
Use the information given to draw a vertical bar graph. Clearly label the bars on the graph shown below.
3)
Visitors of Jazz Festival
Year Visitors (in thousands)
1981 240
1991 340
2001 400
2003 460
3)
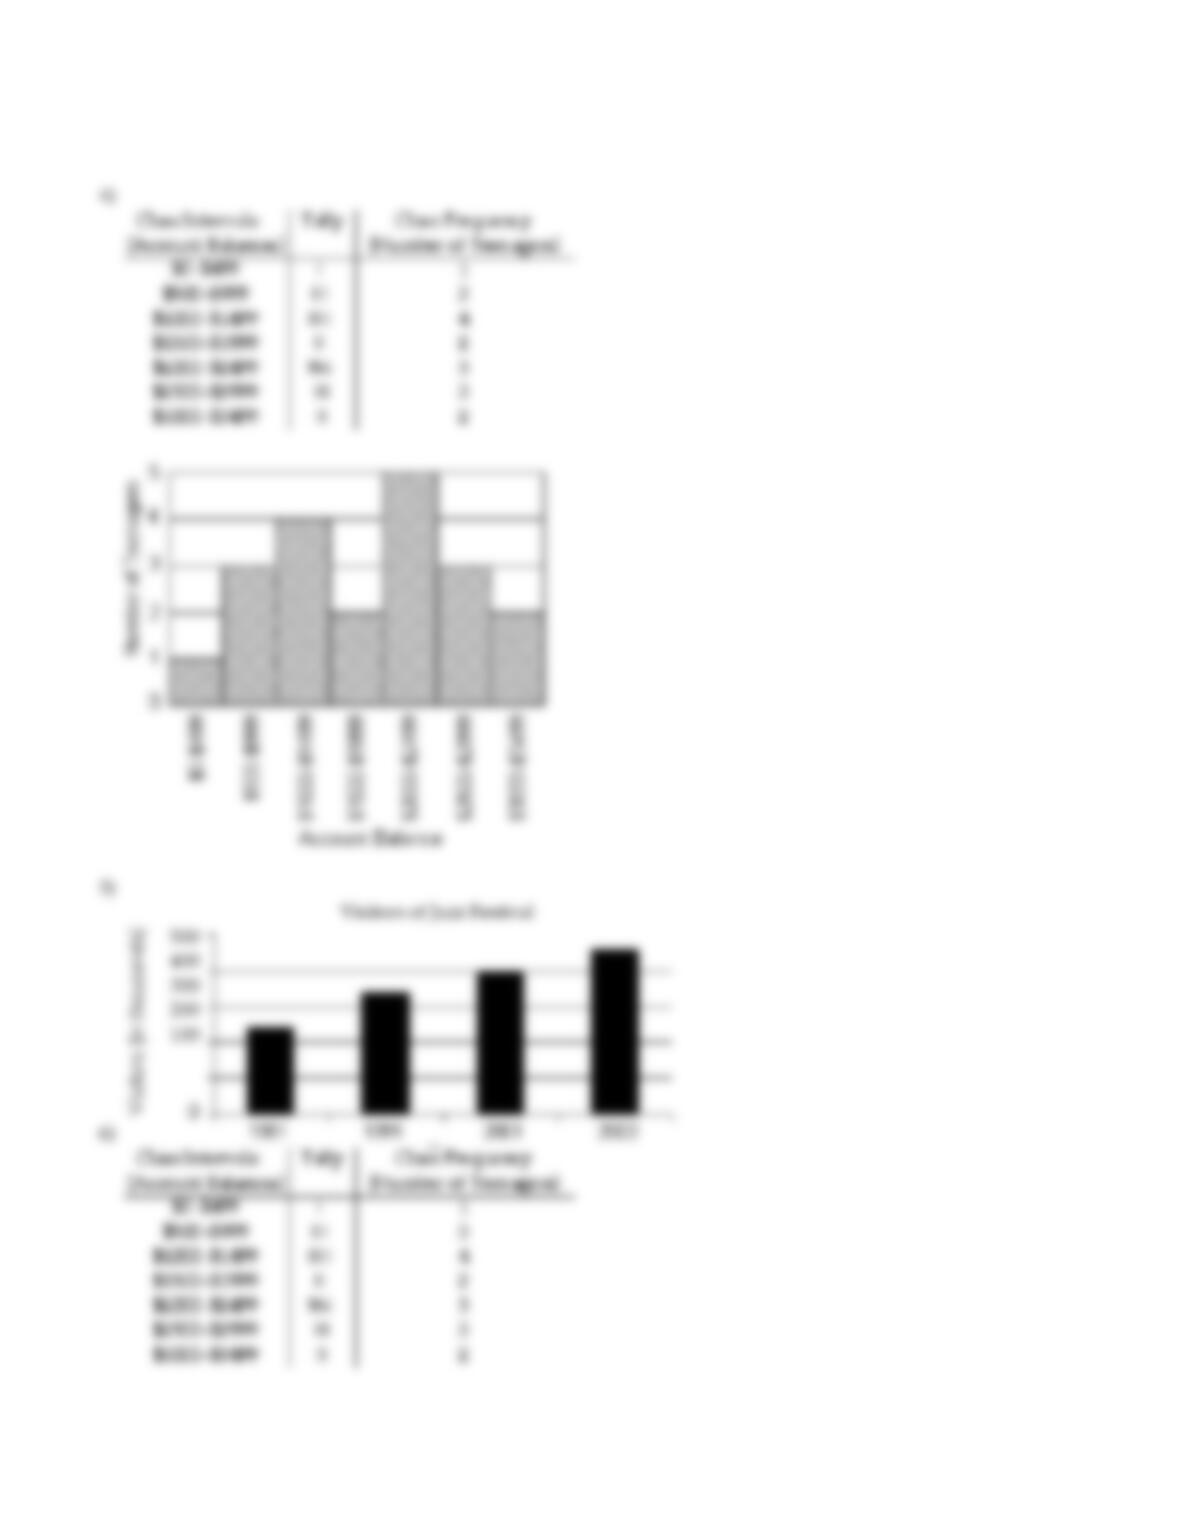
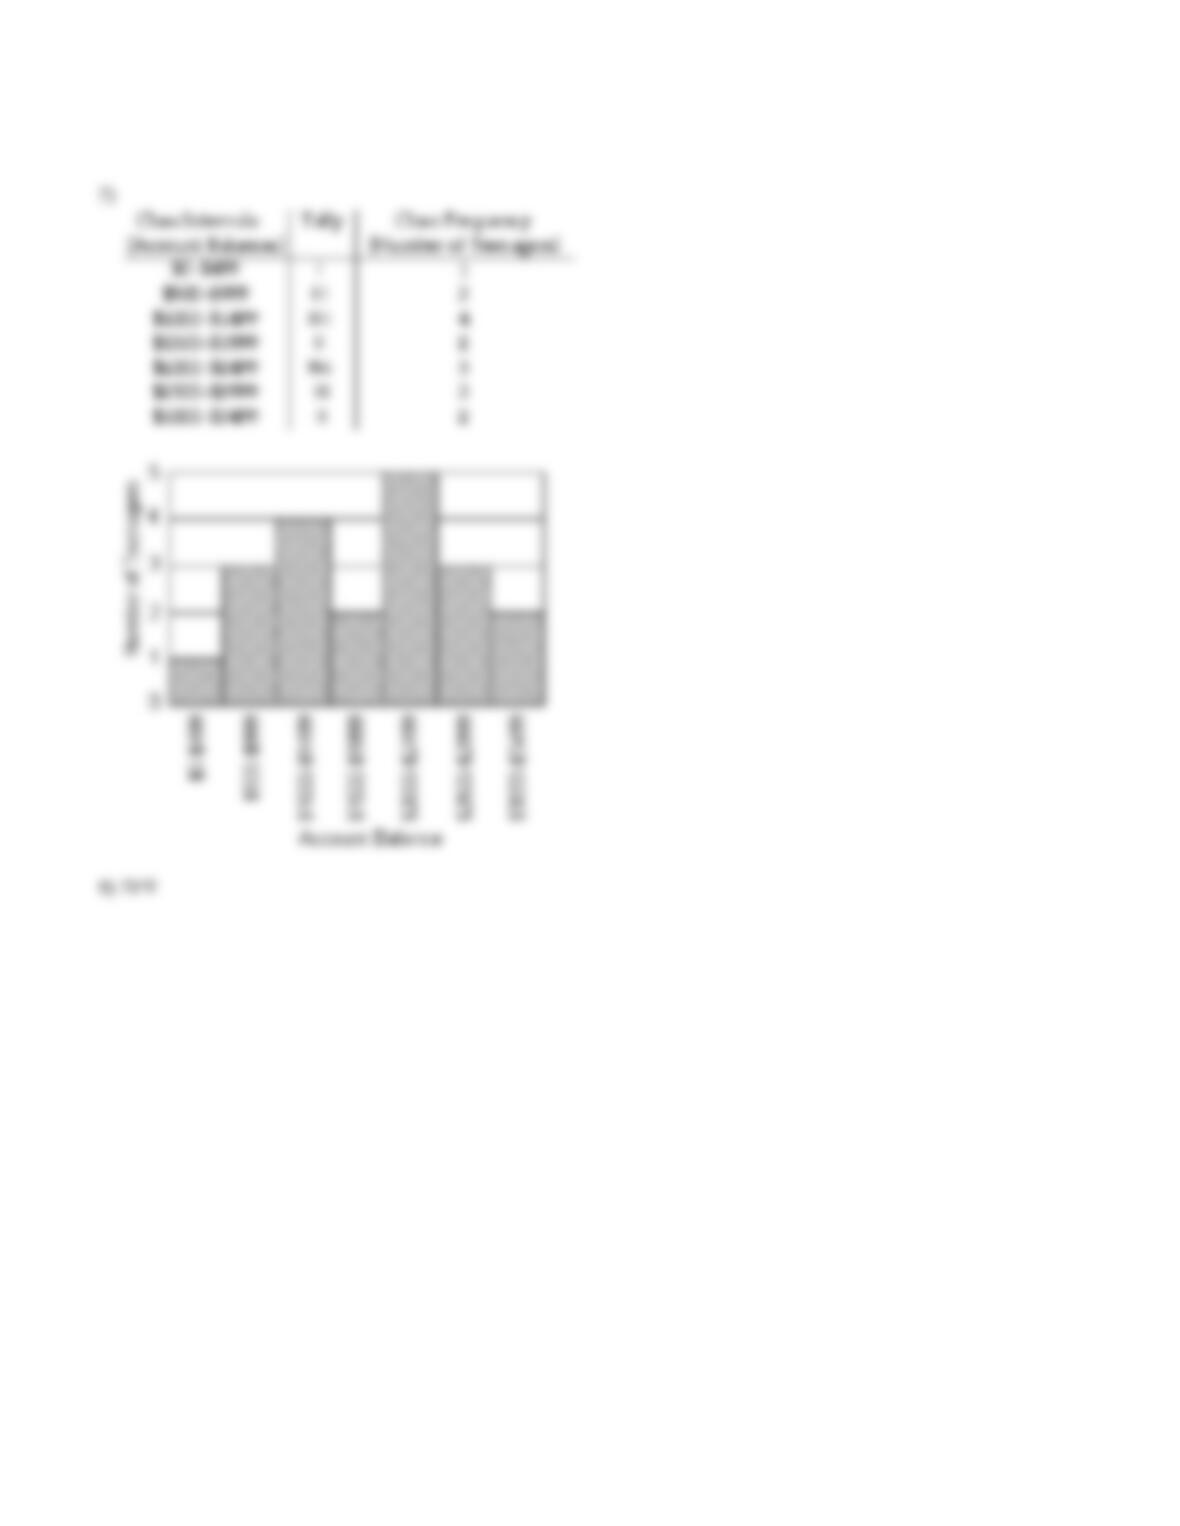
4)
425 1356 796 3056 3489
2289 645 2800 2254 1089
1456 920 2187 2334 2900
2950 1580 1296 1520 2459
Class Intervals
(Account Balances) Tally Class Frequency
(Number of Teenagers)
$0–$499
$500–$999
$1000–$1499
$1500–$1999
$2000–$2499
$2500–$2999
$3000–$3499
4)
3
Use the information given to draw a vertical bar graph. Clearly label the bars on the graph shown below.
5)
Visitors of Jazz Festival
Year Visitors (in thousands)
1981 240
1991 340
2001 400
2003 460
5)
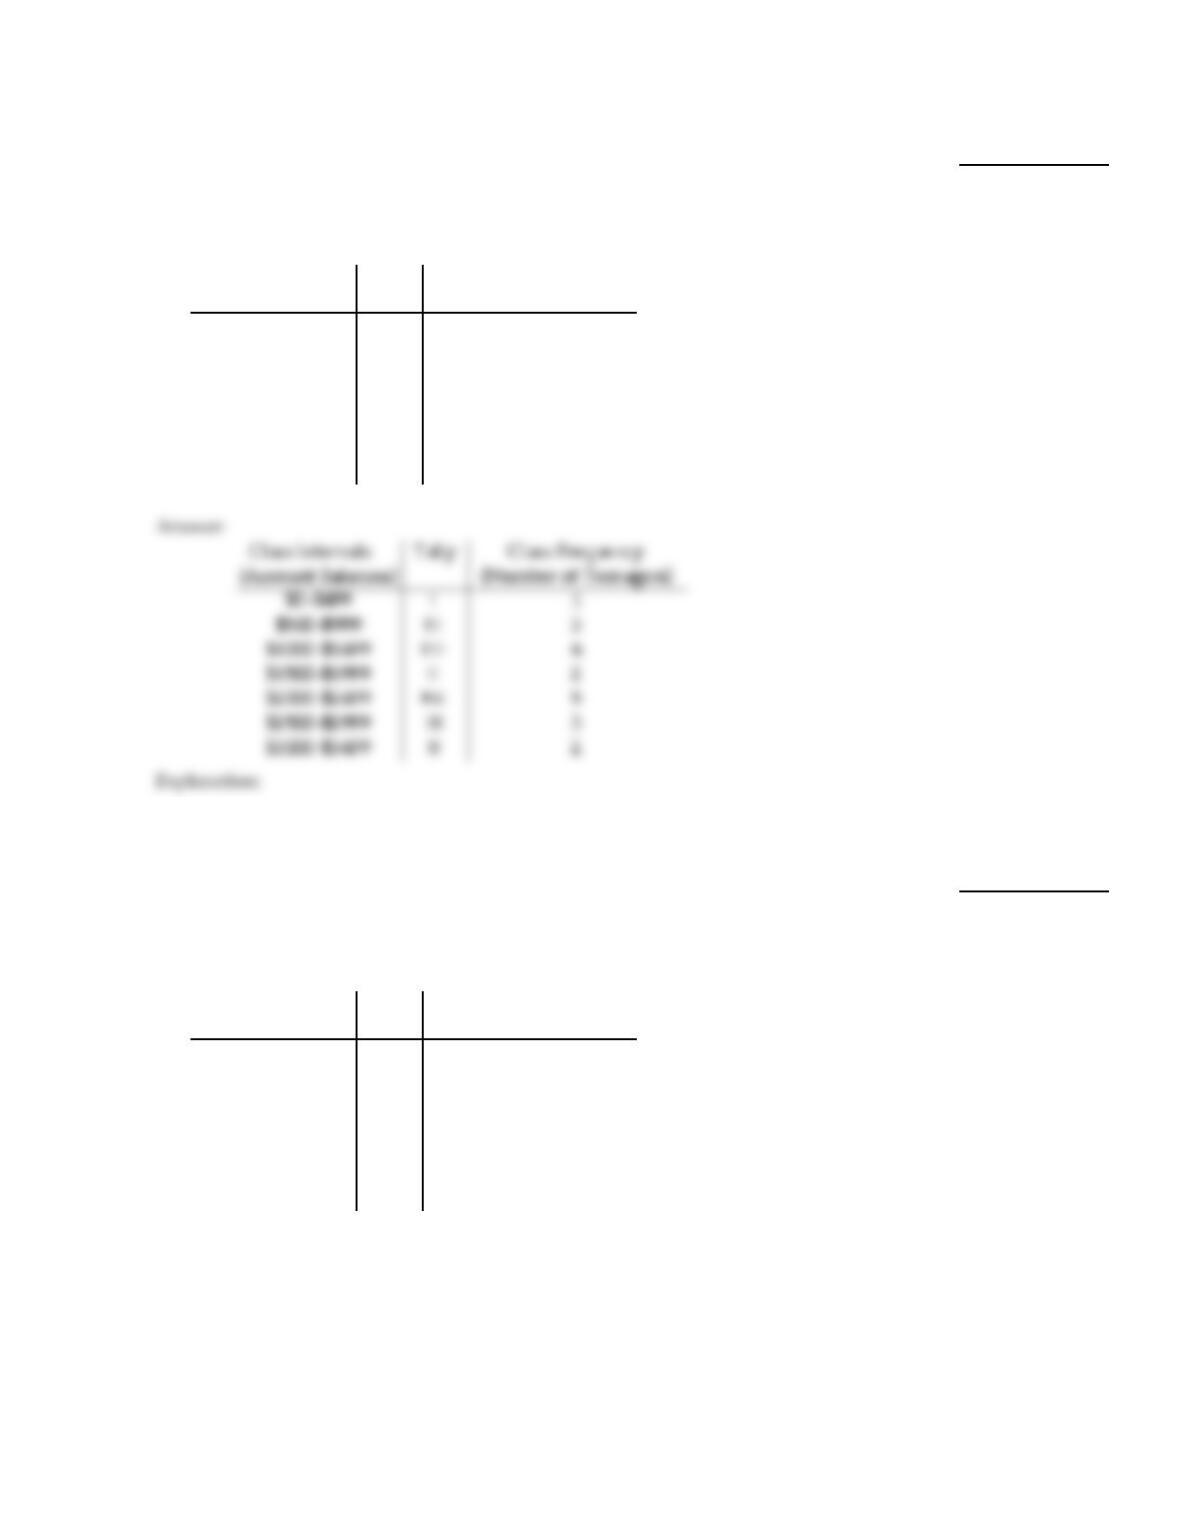
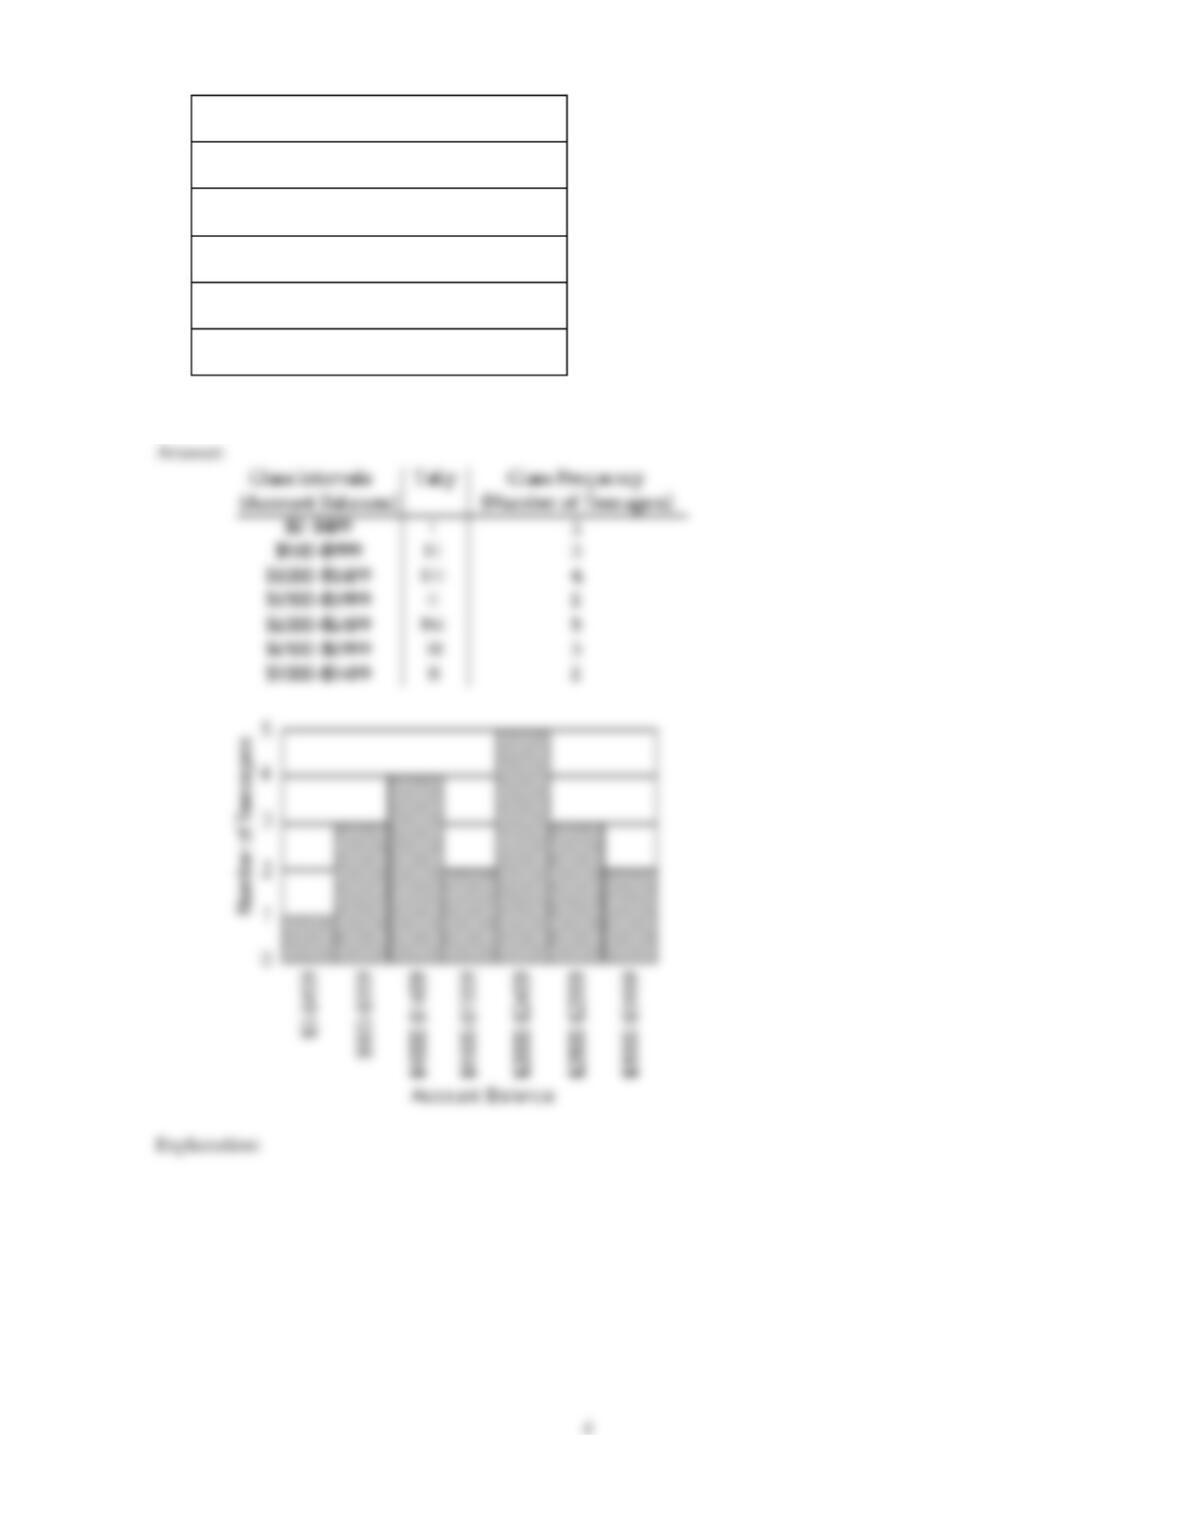
Twenty teenagers were asked to give their current savings account balances. Use the balances shown in the list to
complete the frequency distribution table.
6)
480 1049 754 3156 3056
2377 796 2510 2289 1356
1089 645 2254 2187 2800
2900 1558 1456 1580 2334
Class Intervals
(Account Balances) Tally Class Frequency
(Number of Teenagers)
$0–$499
$500–$999
$1000–$1499
$1500–$1999
$2000–$2499
$2500–$2999
$3000–$3499
6)
Twenty teenagers were asked to give their current savings account balances. Use the balances shown in the list to
complete the frequency distribution table and construct a histogram.
7)
345 1382 591 3265 3123
2399 678 2999 2299 1400
1004 692 2159 2148 2890
2780 1999 1234 1850 2377
Class Intervals
(Account Balances) Tally Class Frequency
(Number of Teenagers)
$0–$499
$500–$999
$1000–$1499
$1500–$1999
$2000–$2499
$2500–$2999
$3000–$3499
7)
6

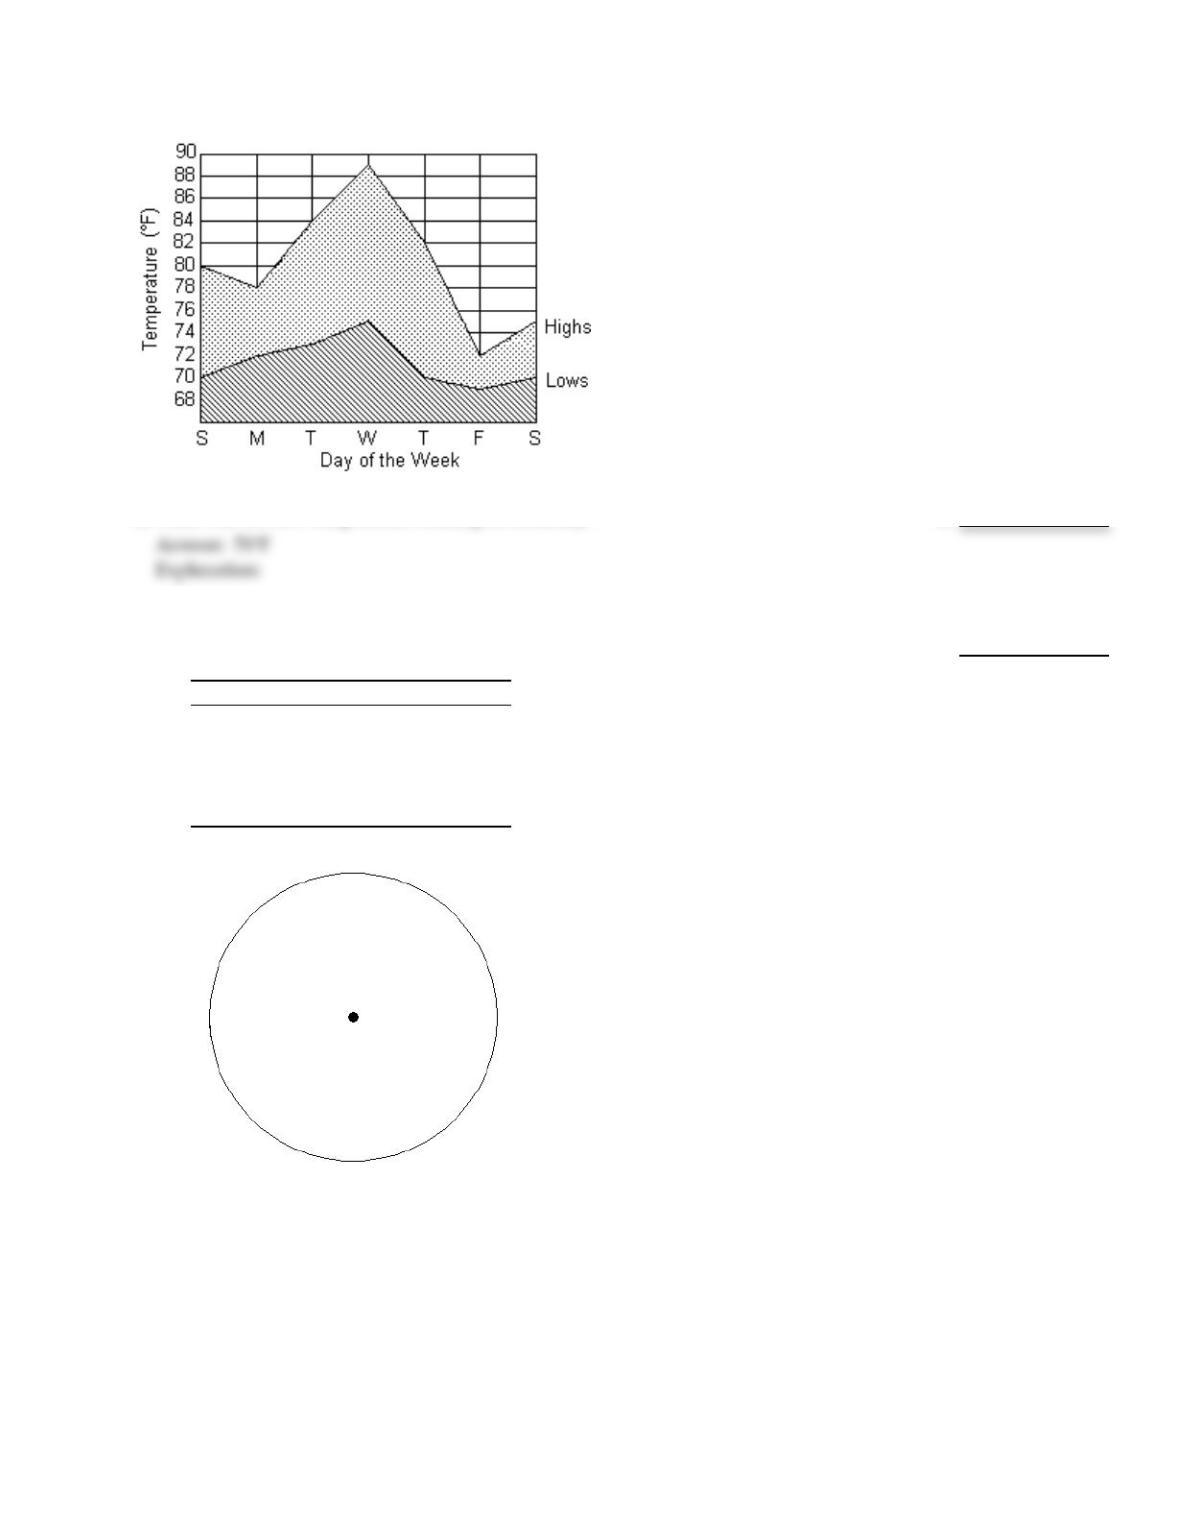
The double–line graph shows temperature highs and lows for a week.
8)
What was the low temperature reading on Saturday?
8)
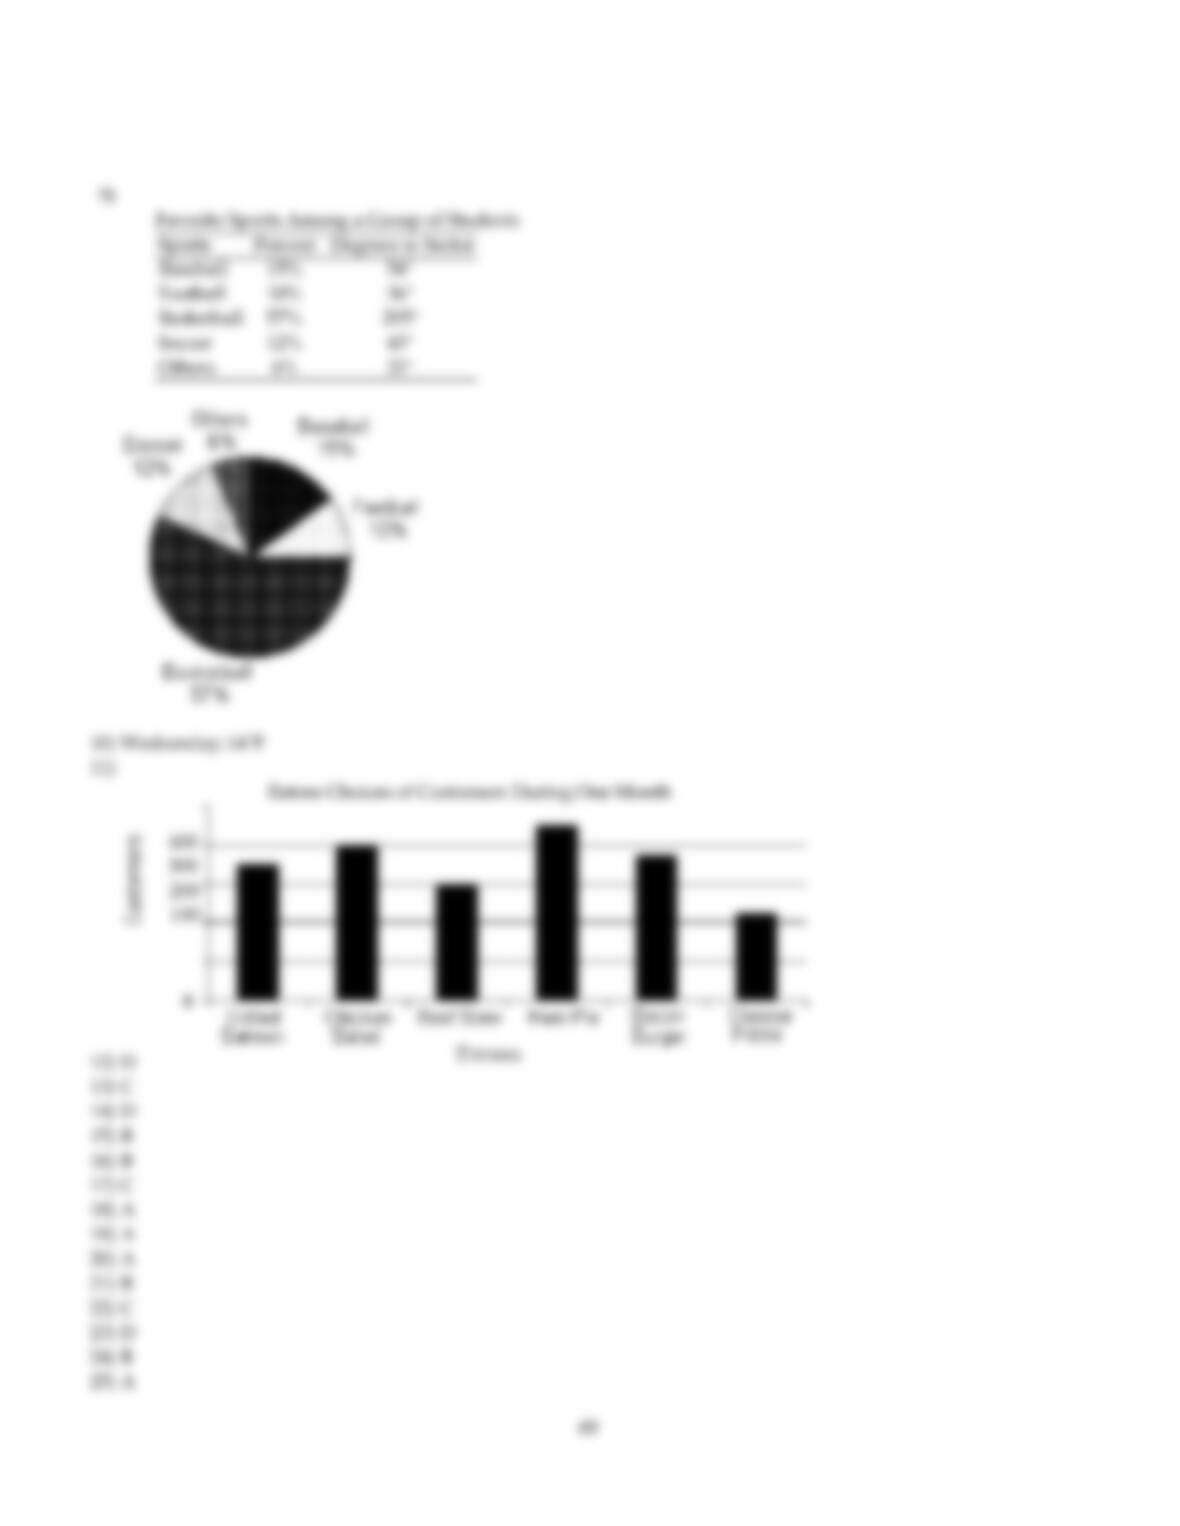
Fill in the table. Round to the nearest degree. Then draw a circle graph to represent the information given in the table.
9)
Favorite Sports Among a Group of Students
Sports Percent Degrees in Sector
Baseball 15%
Football 10%
Basketball 57%
Soccer 12%
Others 6%
9)
8
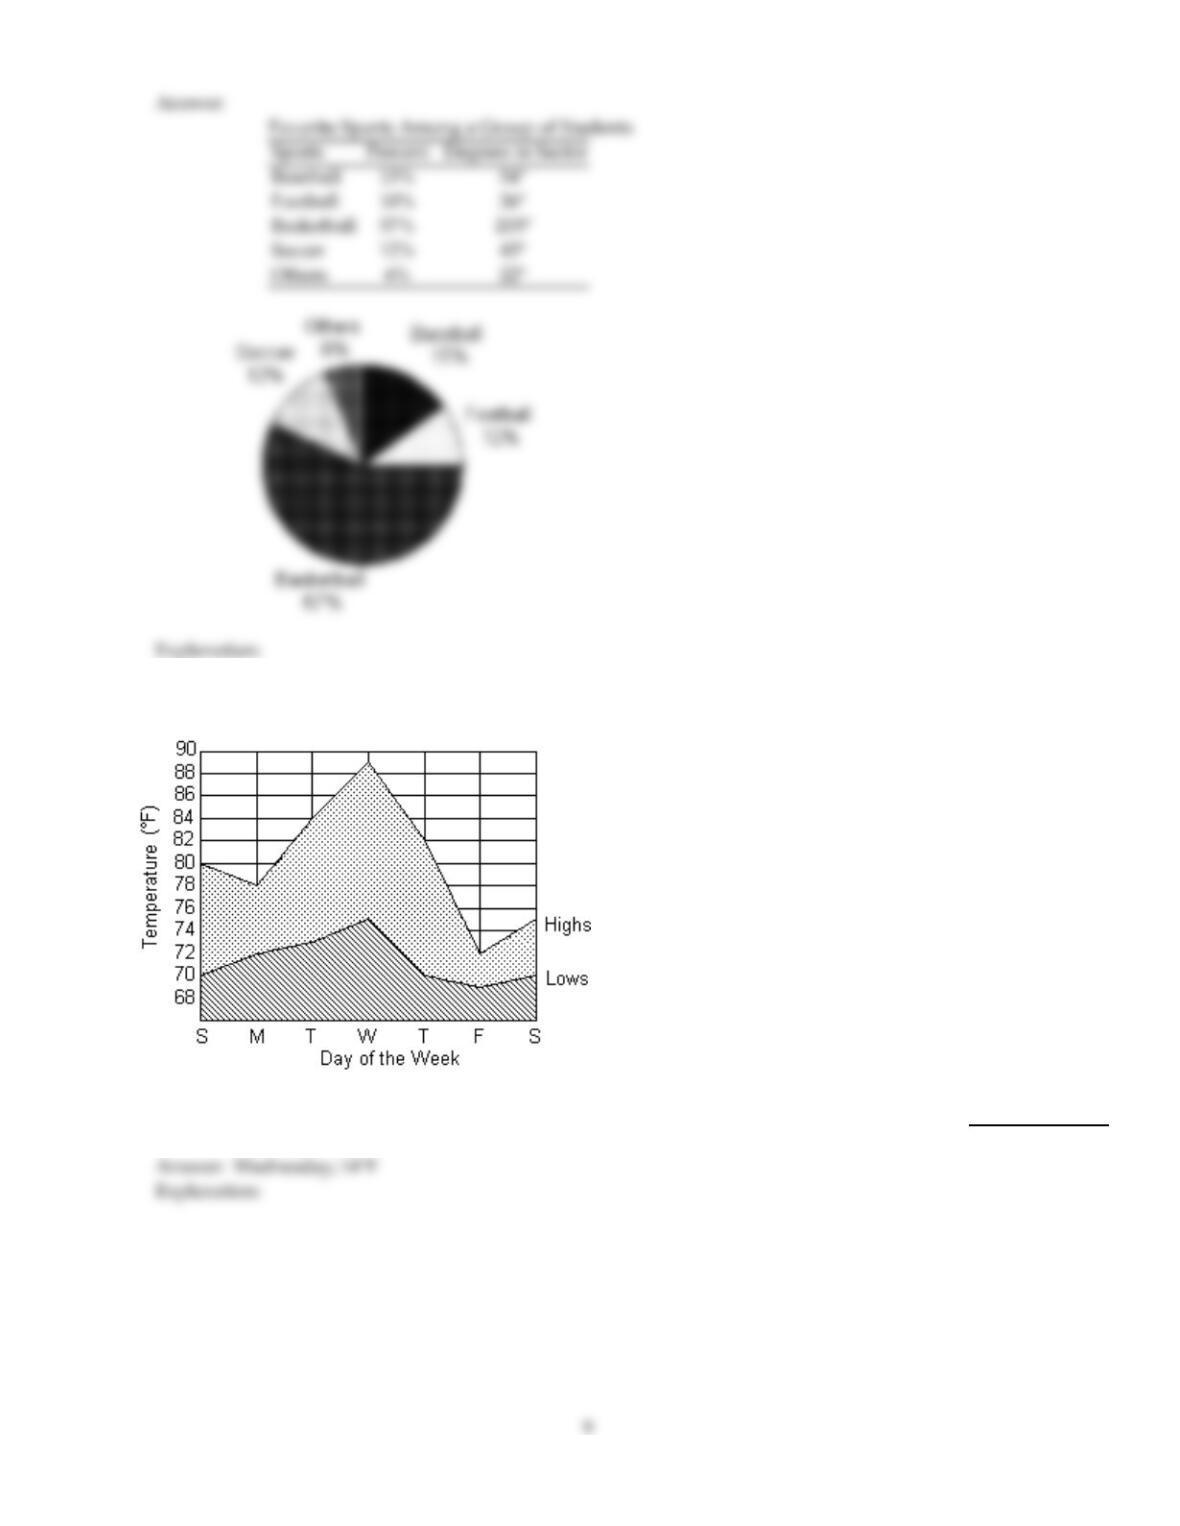
The double–line graph shows temperature highs and lows for a week.
10)
On what day of the week was the difference between the high temperature and the low
temperature the greatest? What was this difference in temperature?
10)
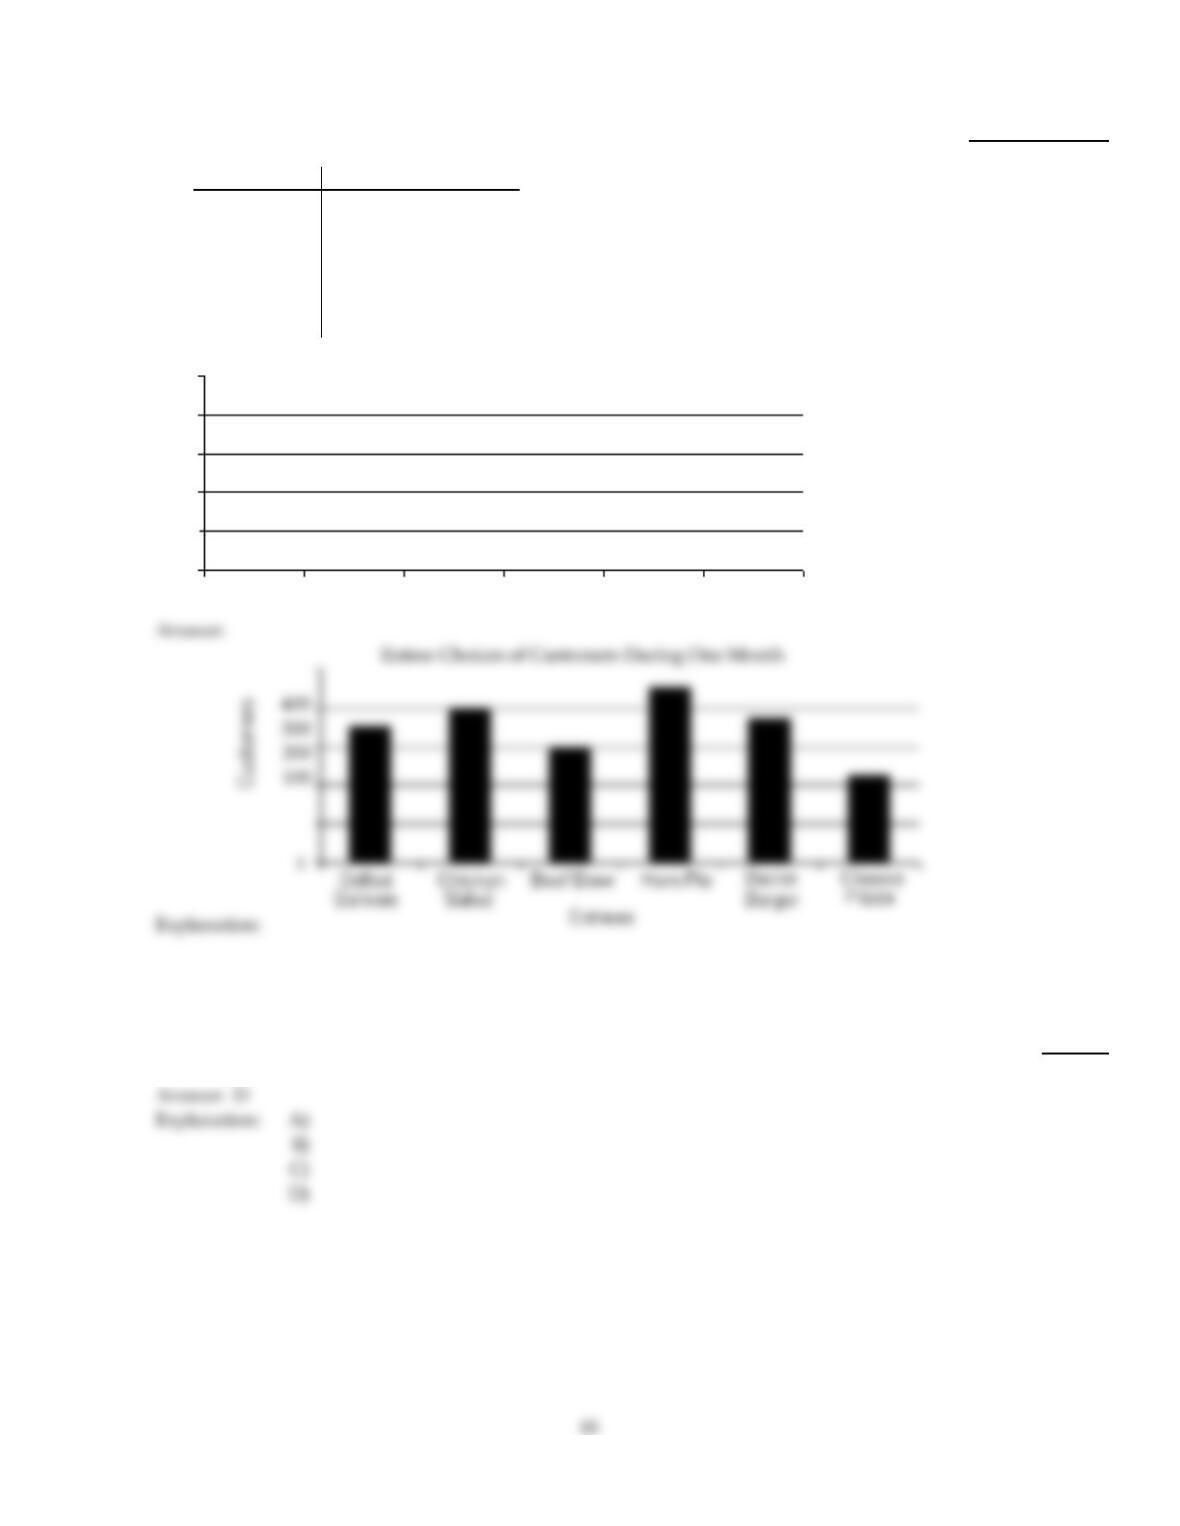
Use the information given to draw a vertical bar graph. Clearly label the bars on the graph shown below.
11)
Entree Choices of Customers During One Month
Entree Number of Customers
Grilled Salmon 350
Chicken Salad 400
Beef Stew 300
Ham Pie 450
Bacon Burger 375
Cheese Pizza 225
11)
MULTIPLE CHOICE. Choose the one alternative that best completes the statement or answers the question.
Find the mean. If necessary, round to one decimal place.
12)
4, 5, 10, 6, 13, 9
12)
A)
8.3
B)
6.3
C)
9.4
D)
7.8
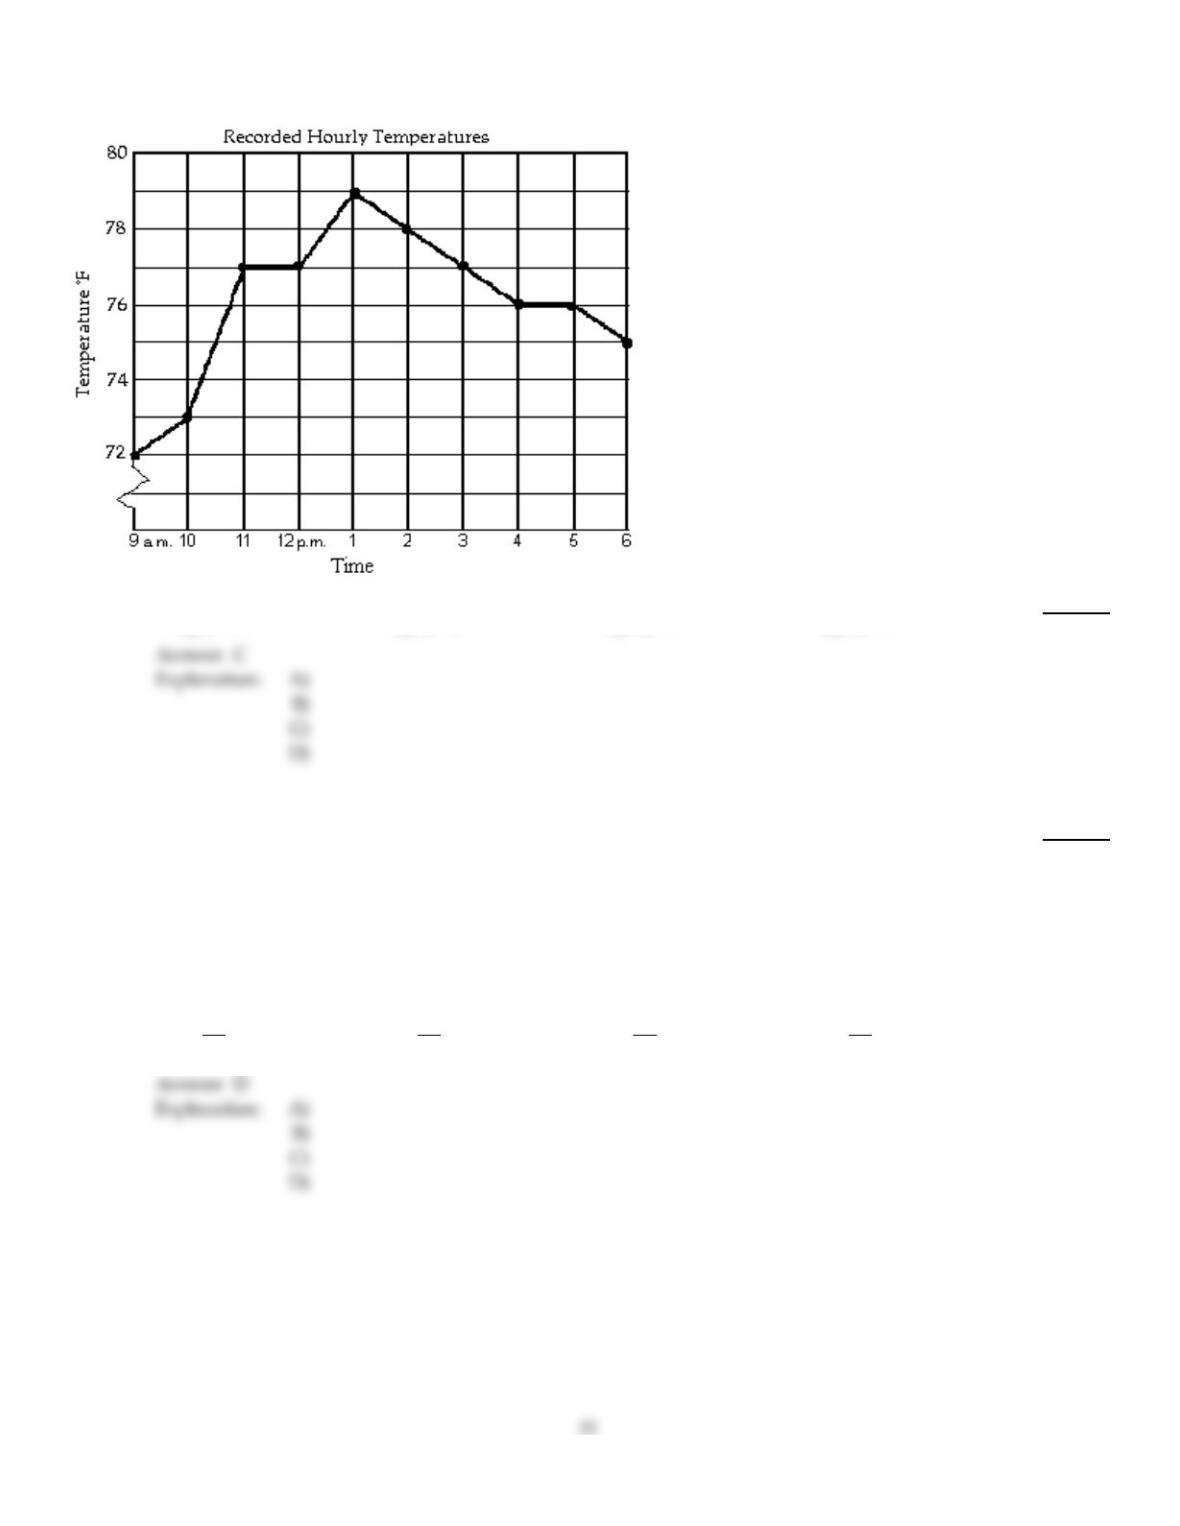
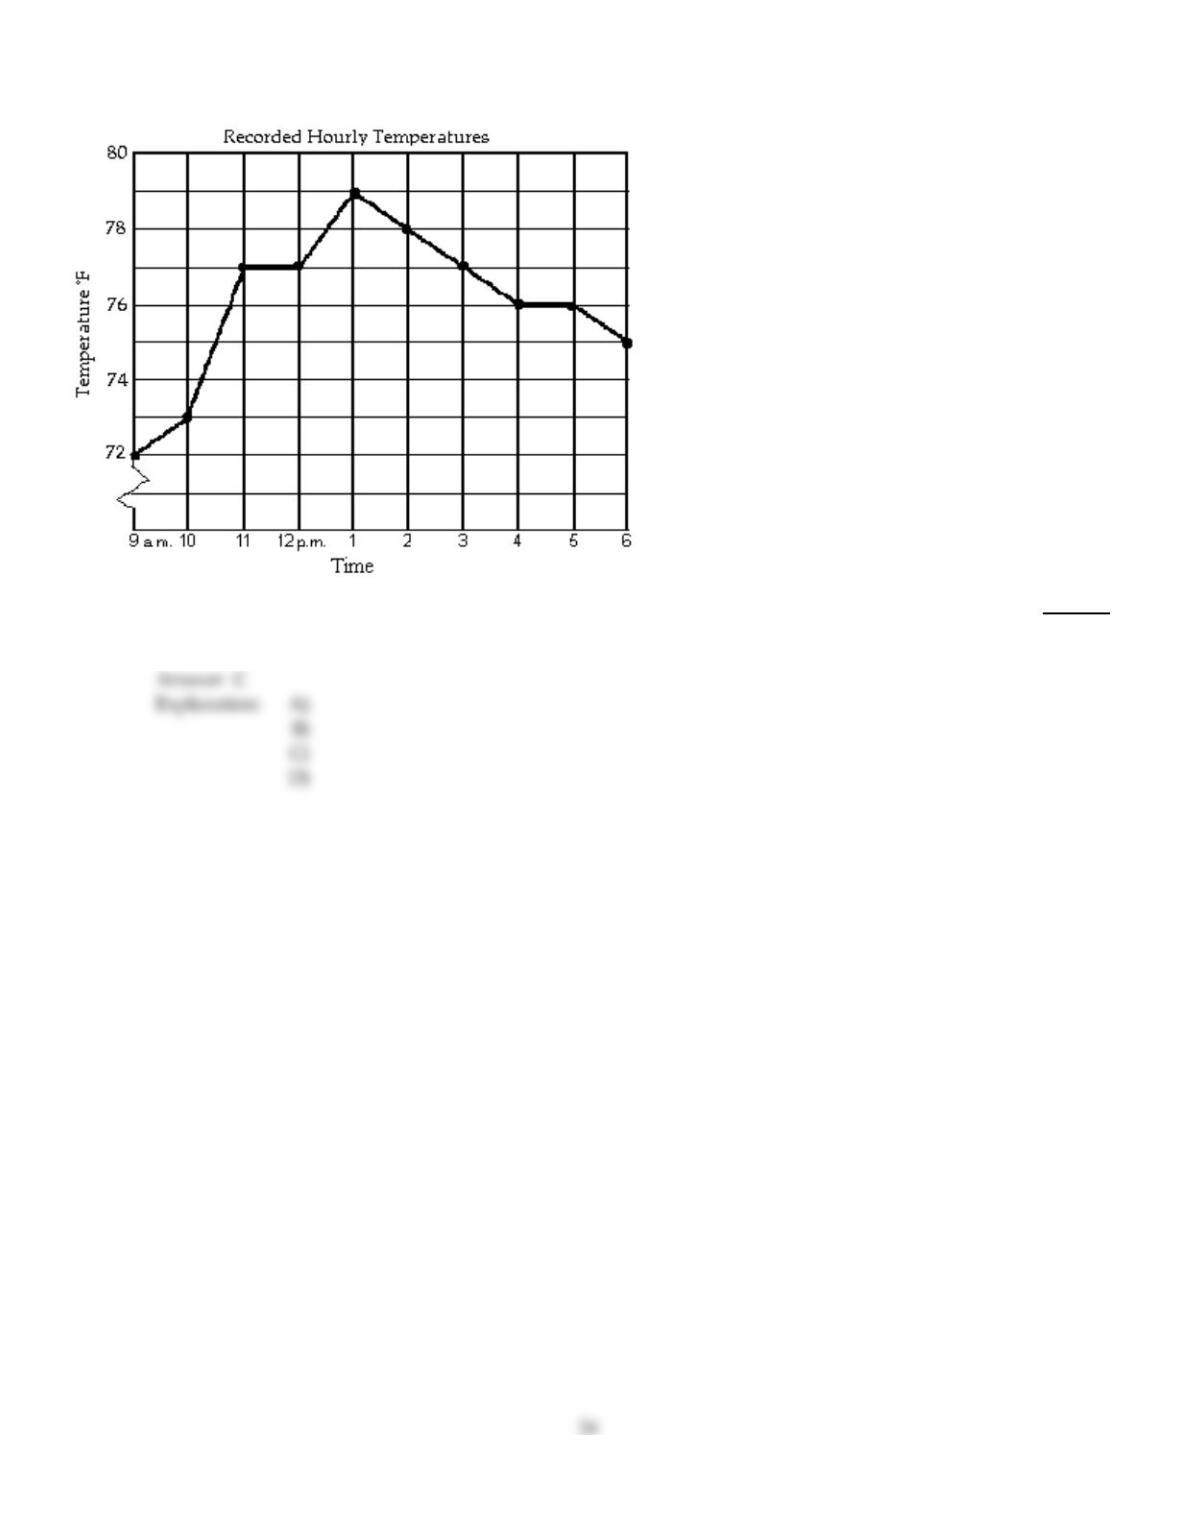
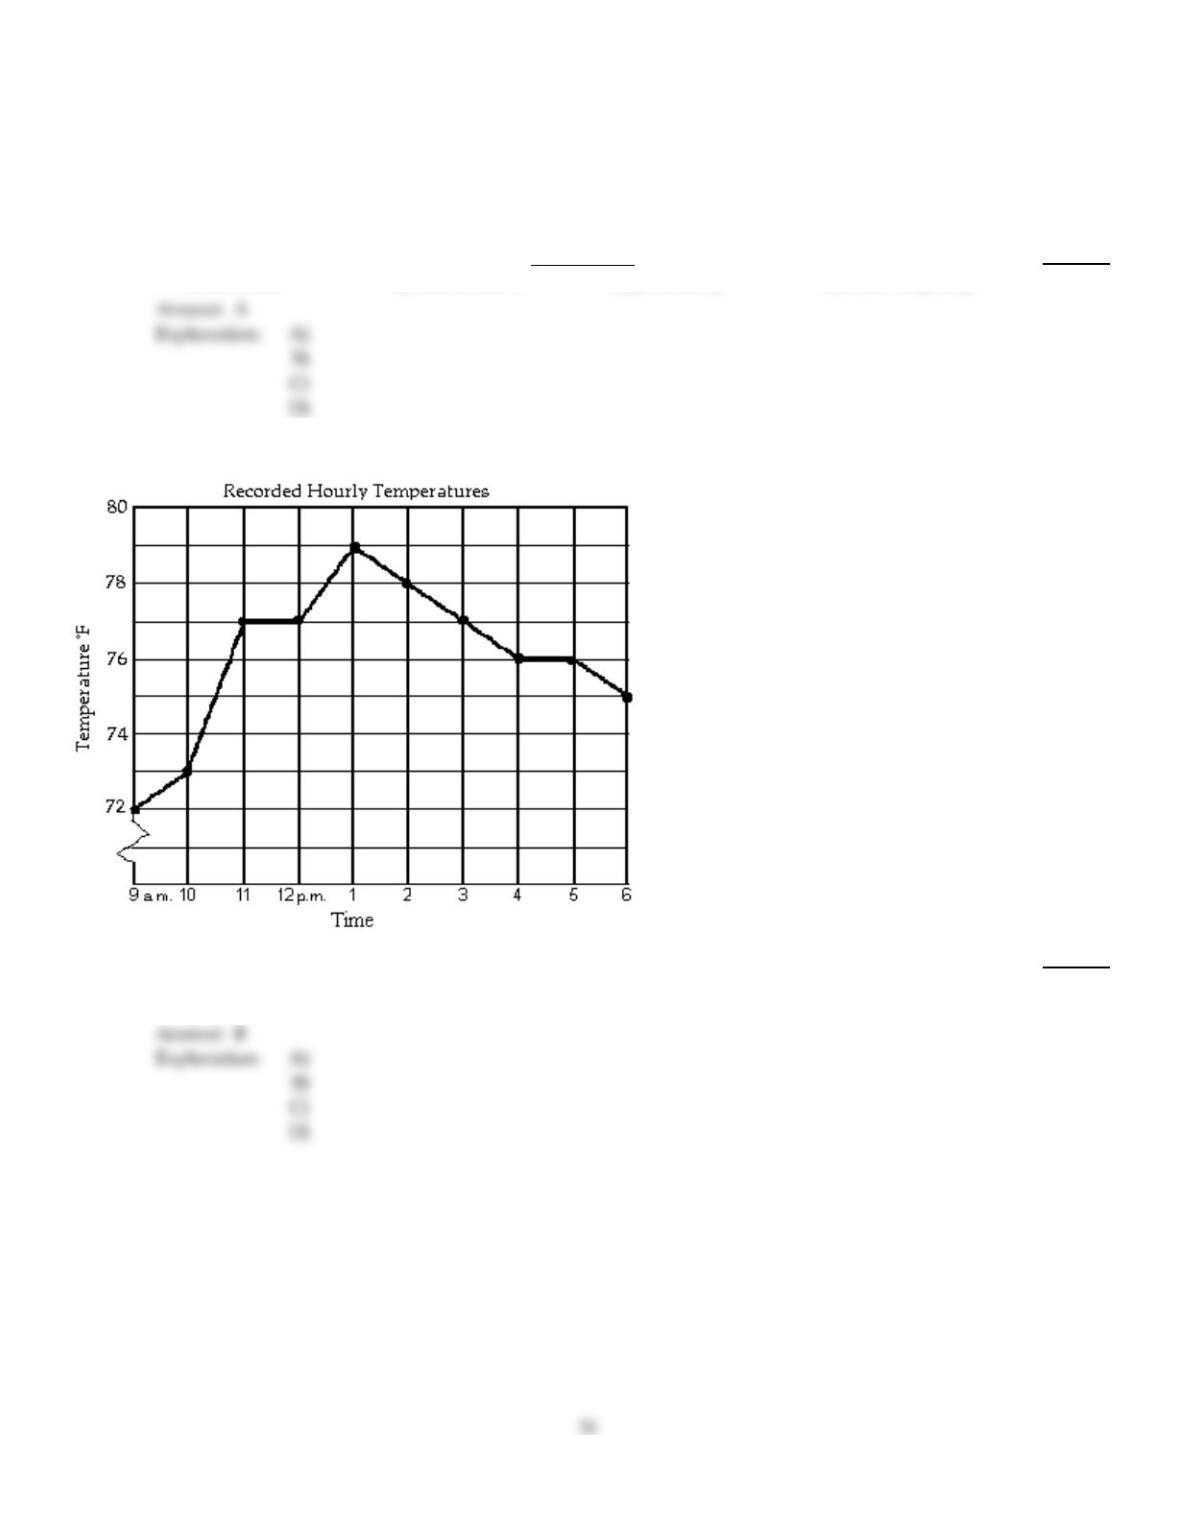
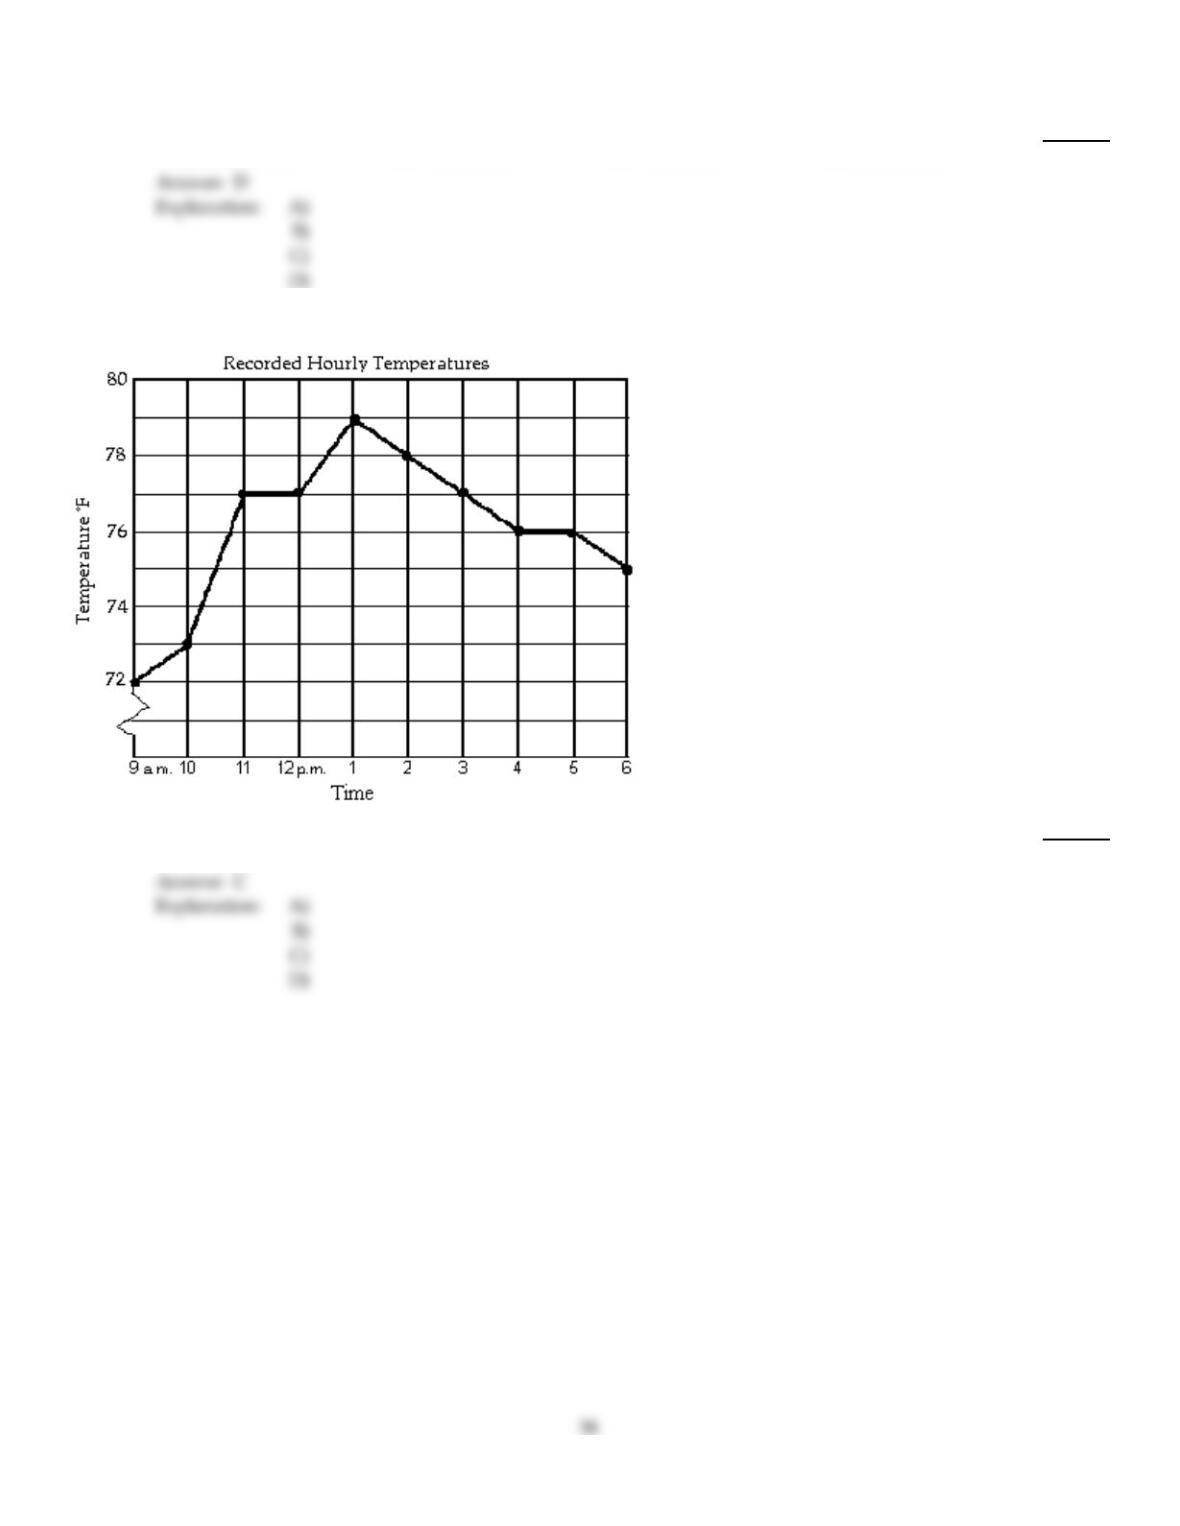
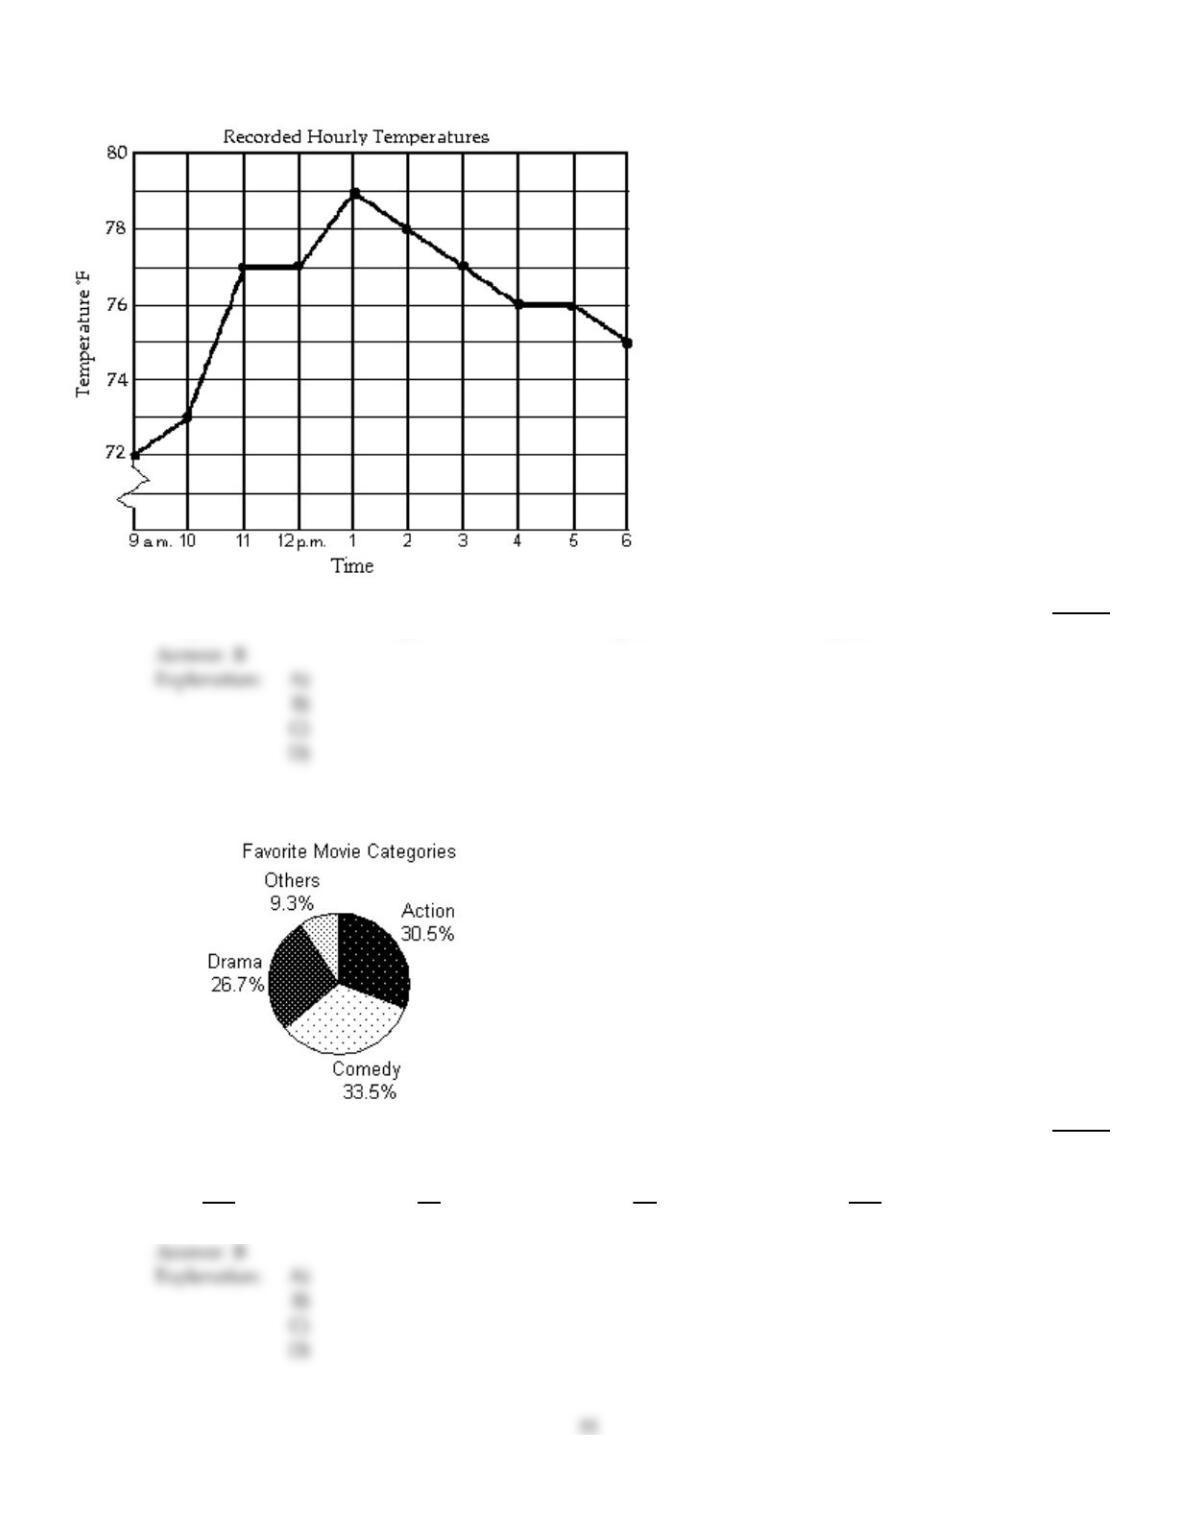
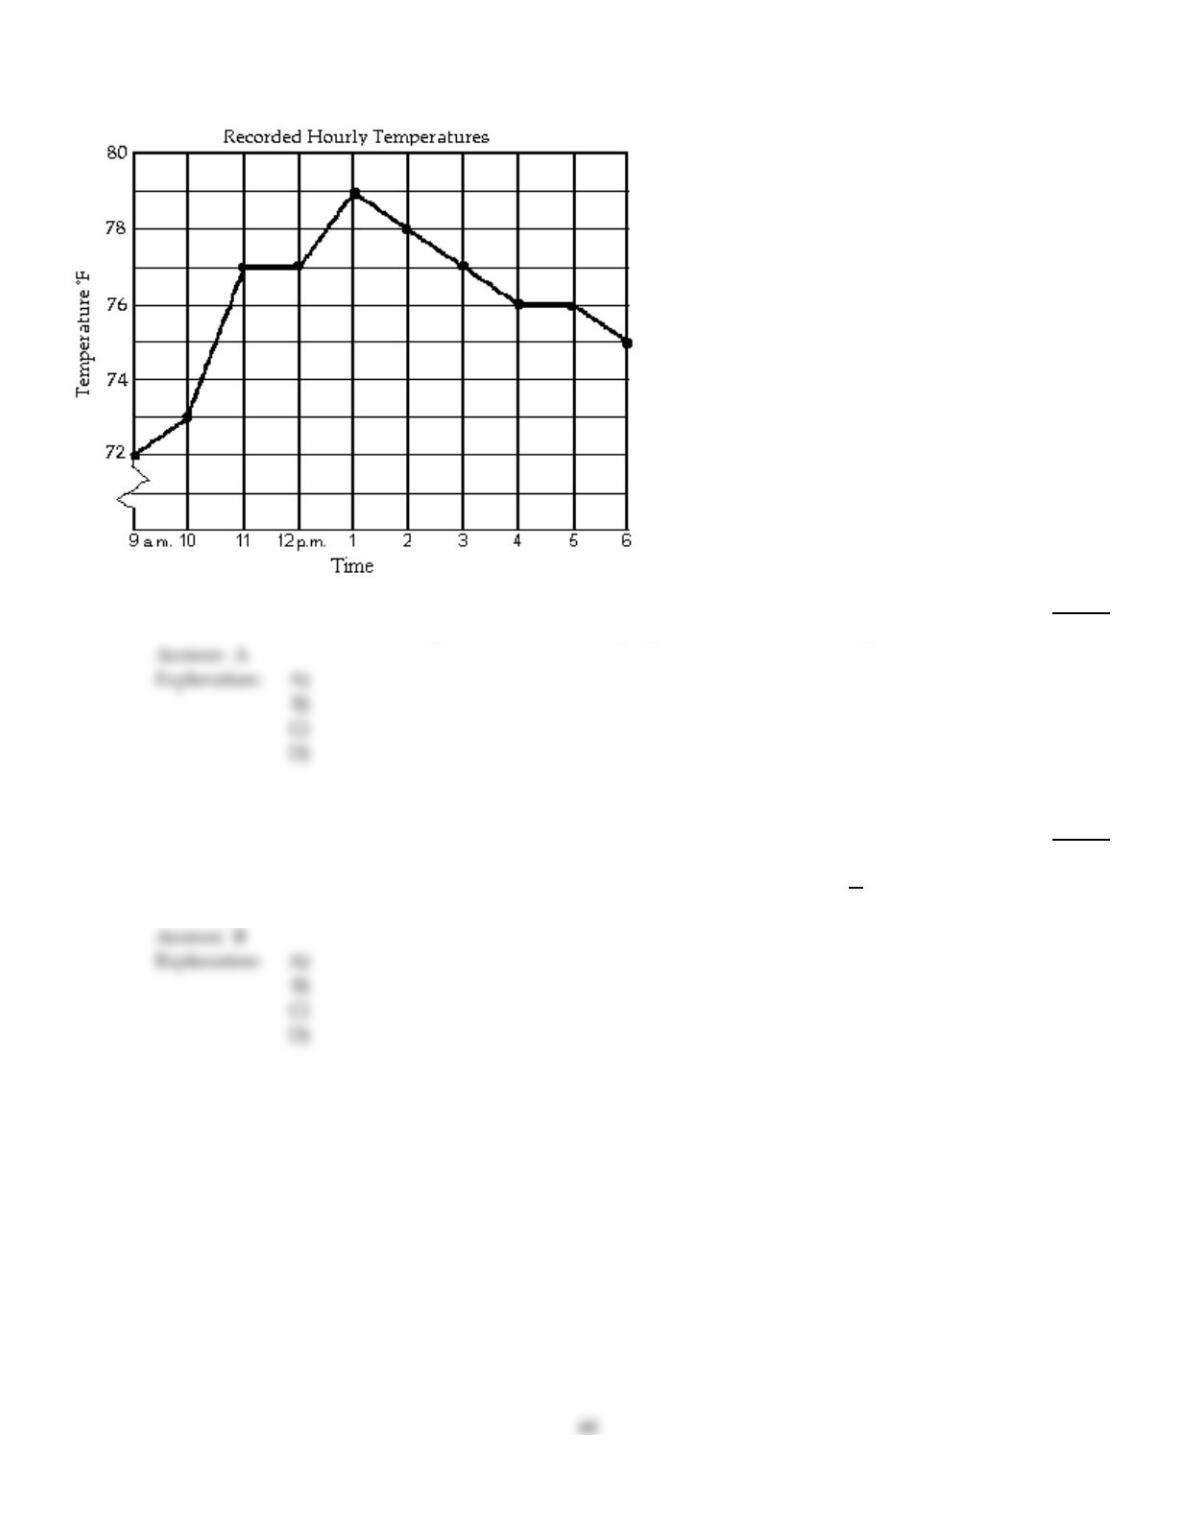
The line graph shows the recorded hourly temperatures in degrees Fahrenheit at an airport.
13)
What temperature was recorded at 4 p.m.?
13)
A)
77 ° F
B)
78 ° F
C)
76 ° F
D)
74 ° F
Solve.
14)
A new drug is being tested that is supposed to lower cholesterol. This drug was given to 300 people
and the results are below.
Lower
Cholesterol Higher
Cholesterol Cholesterol
not Changed
116 54 130
If a person is testing this drug, what is the probability that their cholesterol will be higher?
14)
A)
41
50
B)
17
30
C)
46
75
D)
9
50
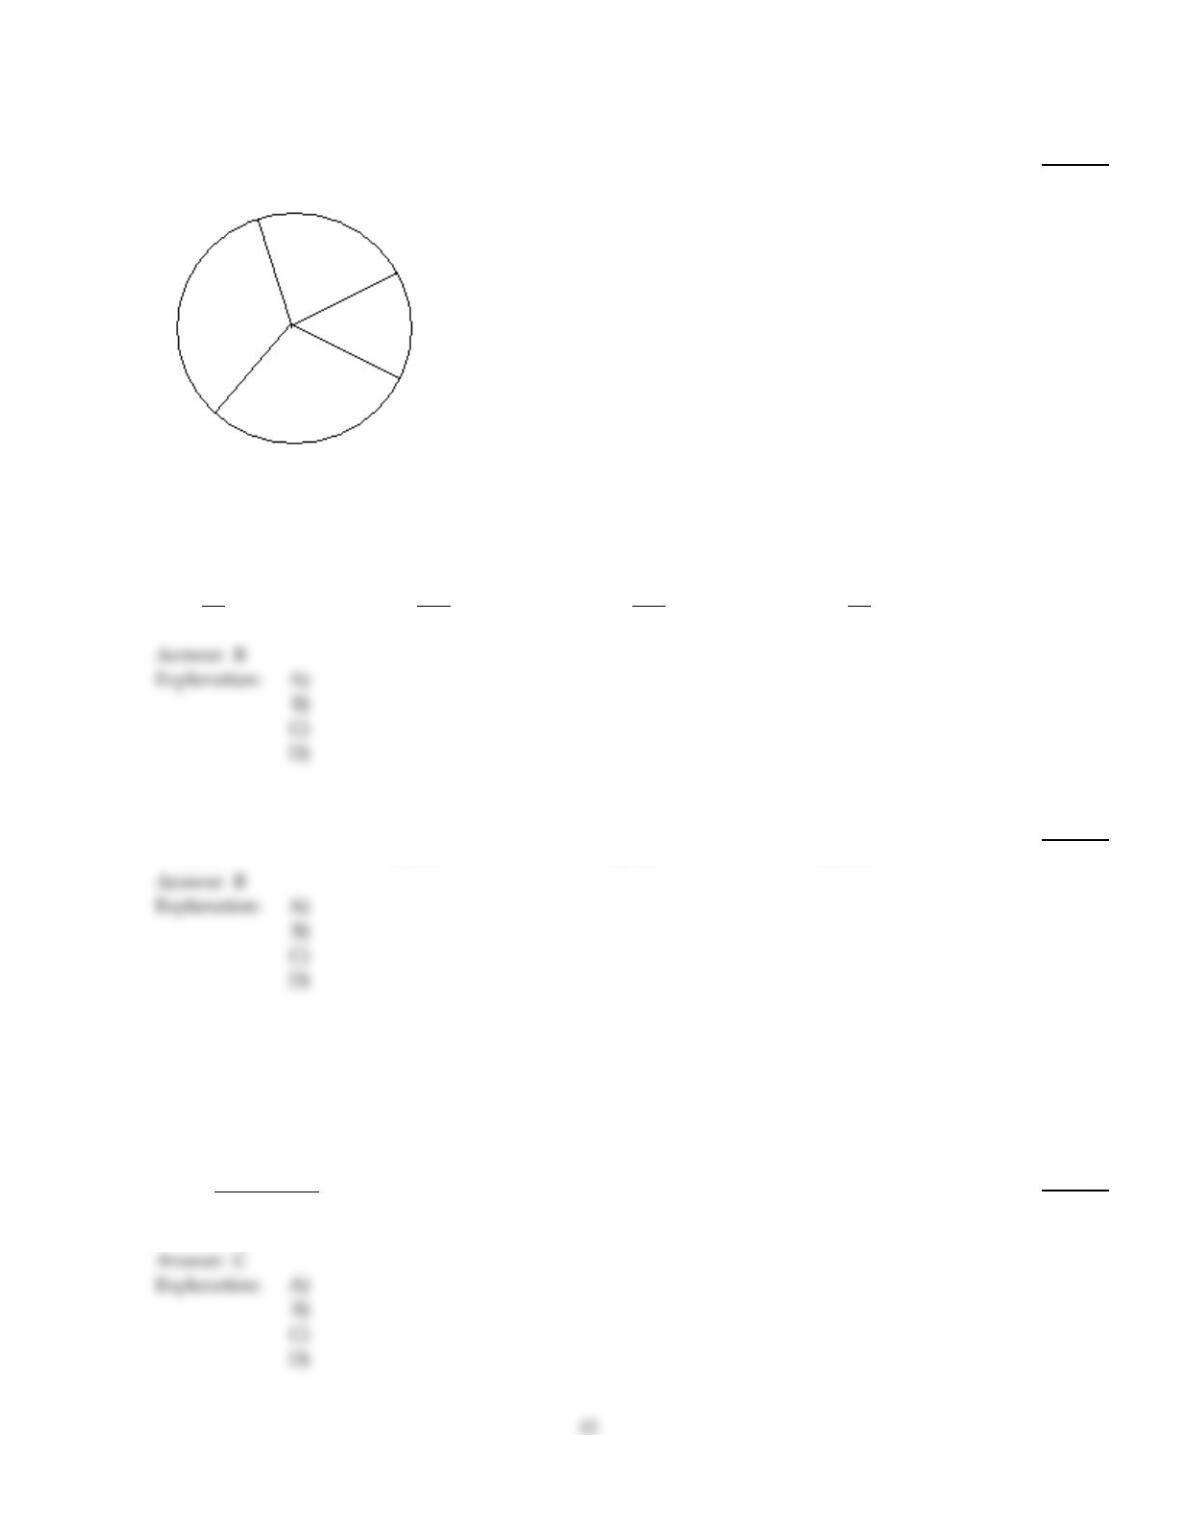
The circle graph shows the results of the student council presidential election. The complete circular area represents 100%
of the votes.
15)
Student Council President
Ben
25%
Jim
29%Ted
20%
Lili
26%
700 total votes
The circle graph shows what percent of the vote each person received.
Find the ratio of Jim‘s votes to total votes cast.
15)
A)
29
71
B)
29
100
C)
100
29
D)
71
29
Find the median. If necessary, round to one decimal place.
16)
1.4, 0.6, 0.8, 1.4, 0.4, 1.6, 0.4, 1.7, 2.1
16)
A)
1.1
B)
1.4
C)
1.2
D)
0.7
Fill in the blank with one of the words or phrases listed below.
outcomes bar experiment mean tree diagram
pictograph line class interval median probability
histogram circle class frequency mode
17)
In a(n) graph, each section (shaped like a piece of pie) shows a category and the
relative size of the category.
17)
A)
probability
B)
line
C)
circle
D)
bar

The histogram shows the scores of each participant in a game from a total of 100 participants.
18)
How many more participants scored 40–59 than 0–19?
18)
A)
19 participants
B)
9 participants
C)
22 participants
D)
13 participants
Suppose that the numbers 1 through 10 are each written on a scrap of paper and placed in a bag. You then select one
number from the bag.
19)
What is the probability of choosing a 2 from the bag?
19)
A)
1
10
B)
1
9
C)
2
9
D)
1
5
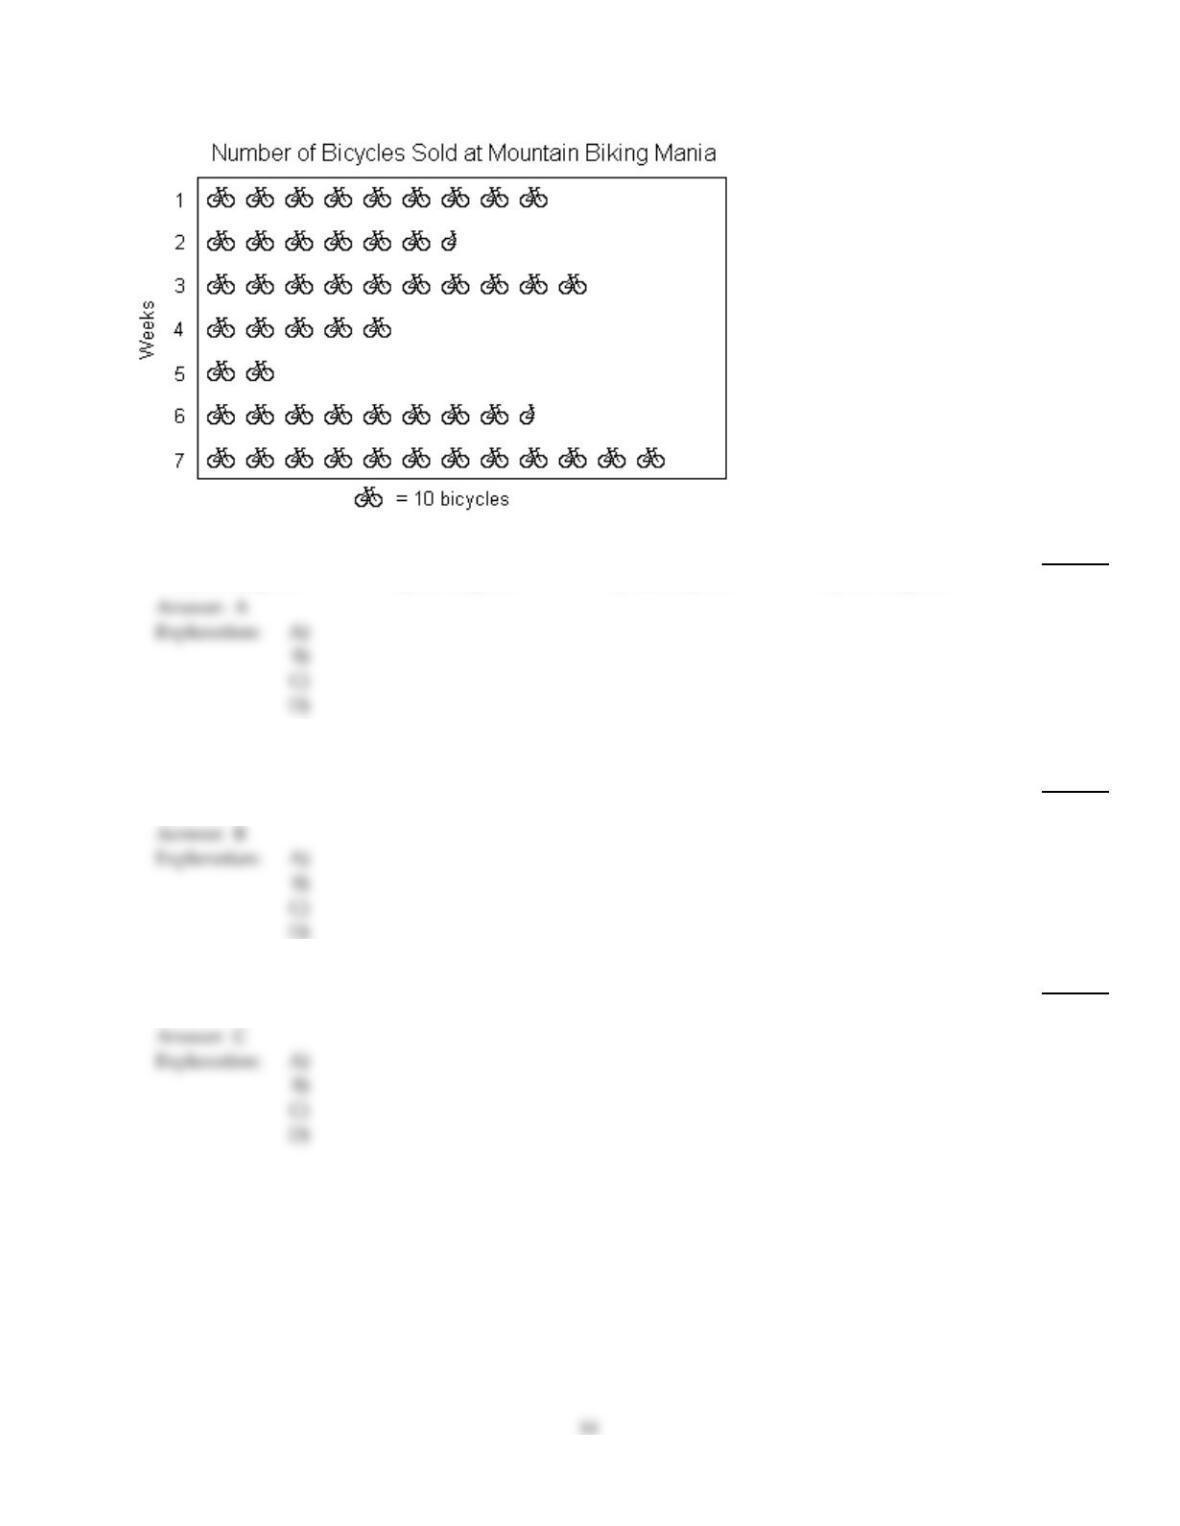
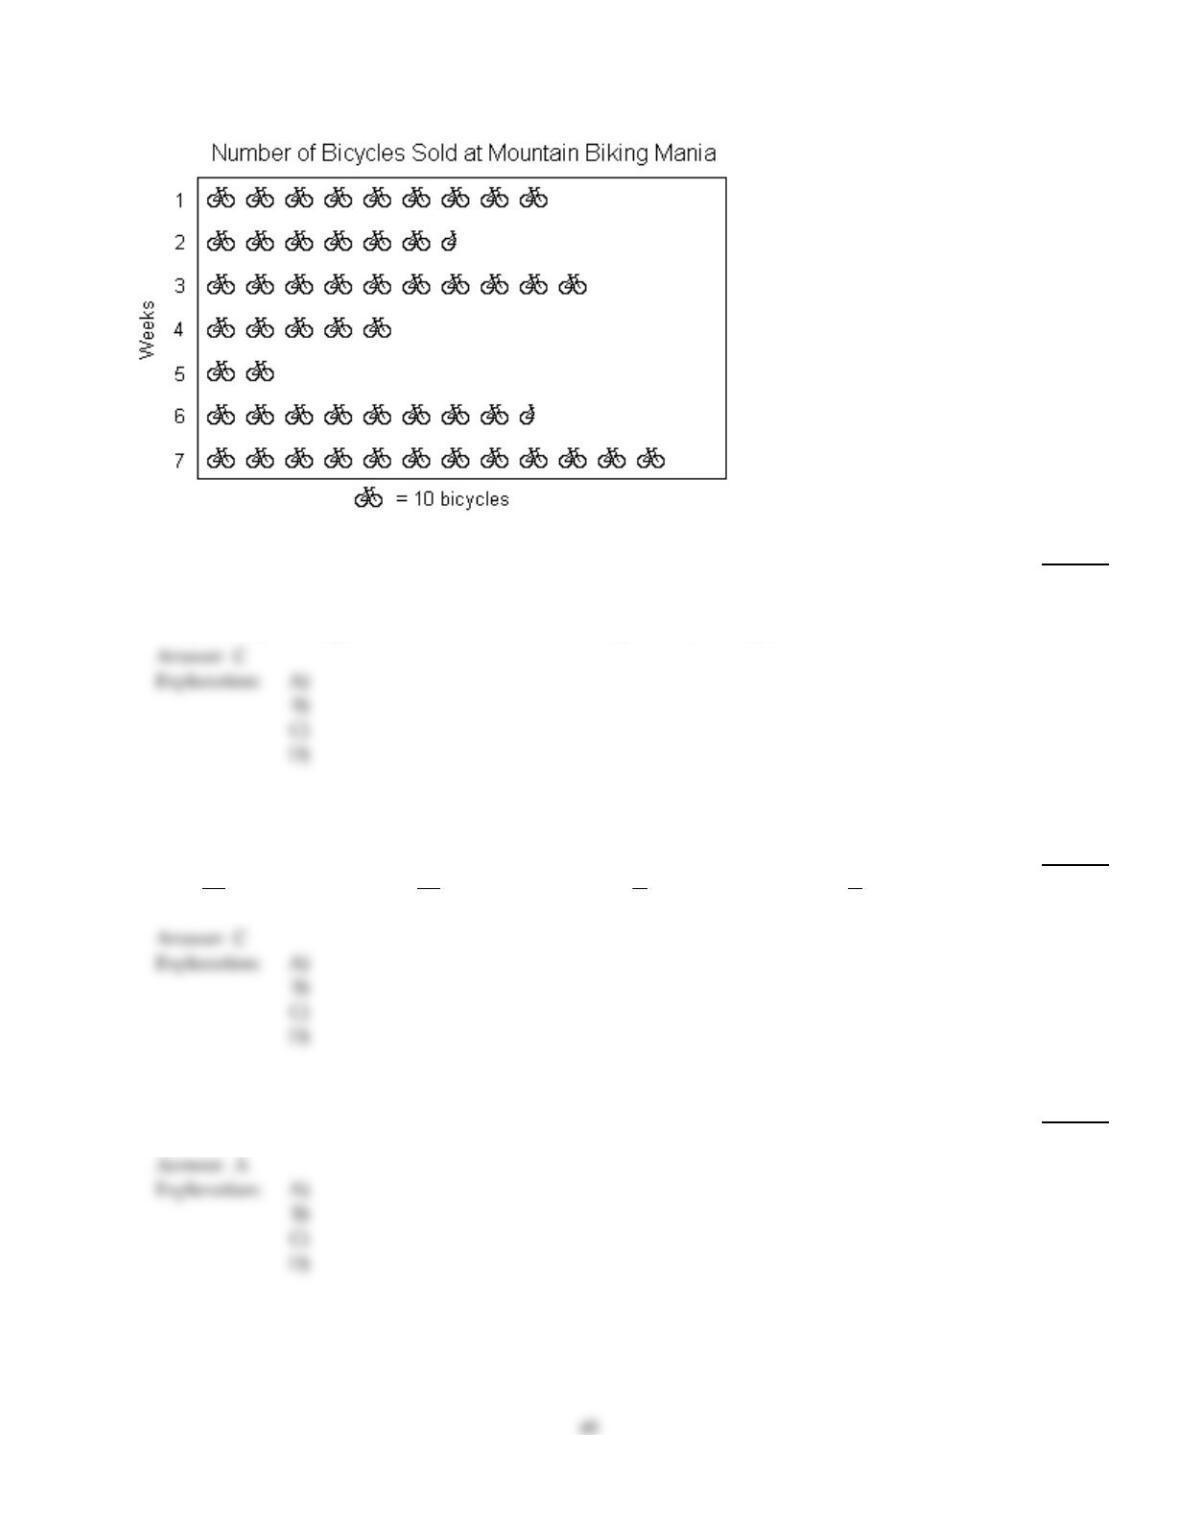
The pictograph shows the number of bicycles sold at Mountain Biking Mania for a 7–week period.
20)
What was the total number of bicycles sold in this 7–week period?
20)
A)
530 bicycles
B)
535 bicycles
C)
520 bicycles
D)
545 bicycles
Find the mode or modes (if any).
21)
84, 38, 32, 38, 29, 84
21)
A)
84
B)
84, 38
C)
50.8
D)
38
22)
20, 43, 46, 43, 49, 43, 49
22)
A)
46
B)
49
C)
43
D)
41.9
Find the probability of the event.
23)
If a single die is tossed once, find the probability of the following event.
A 3
23)
A)
1
2
B)
0
C)
3
D)
1
6
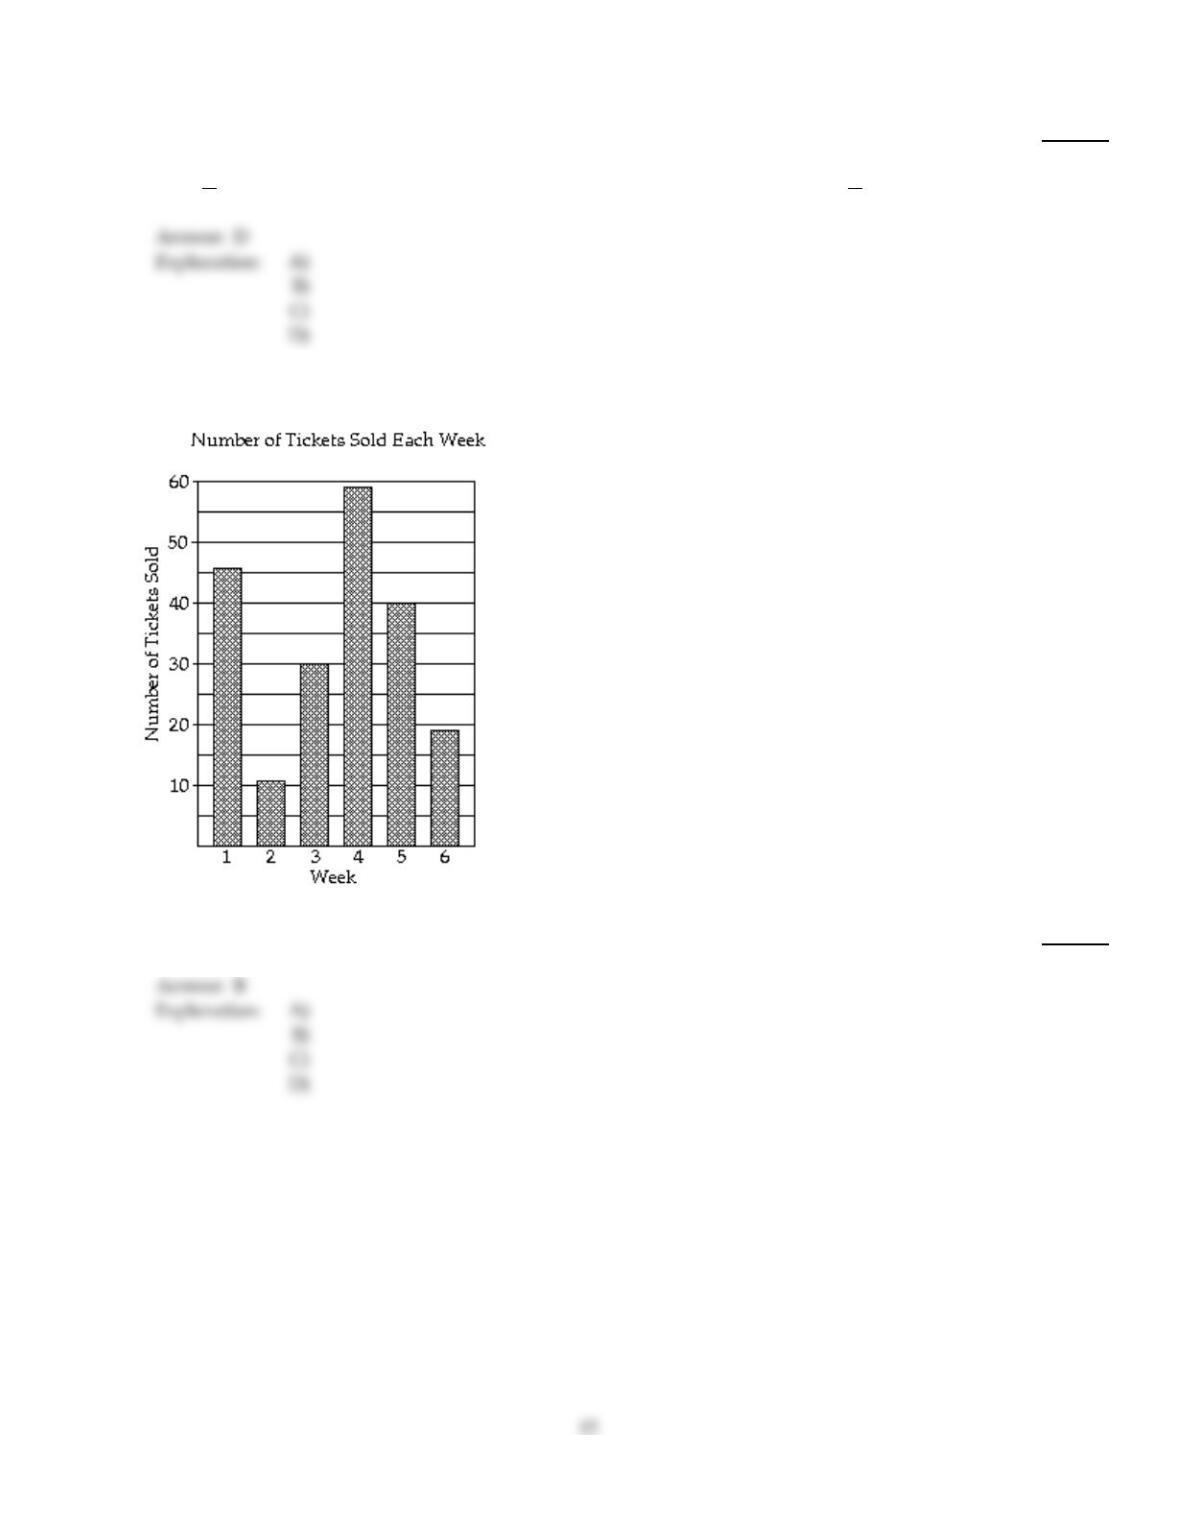
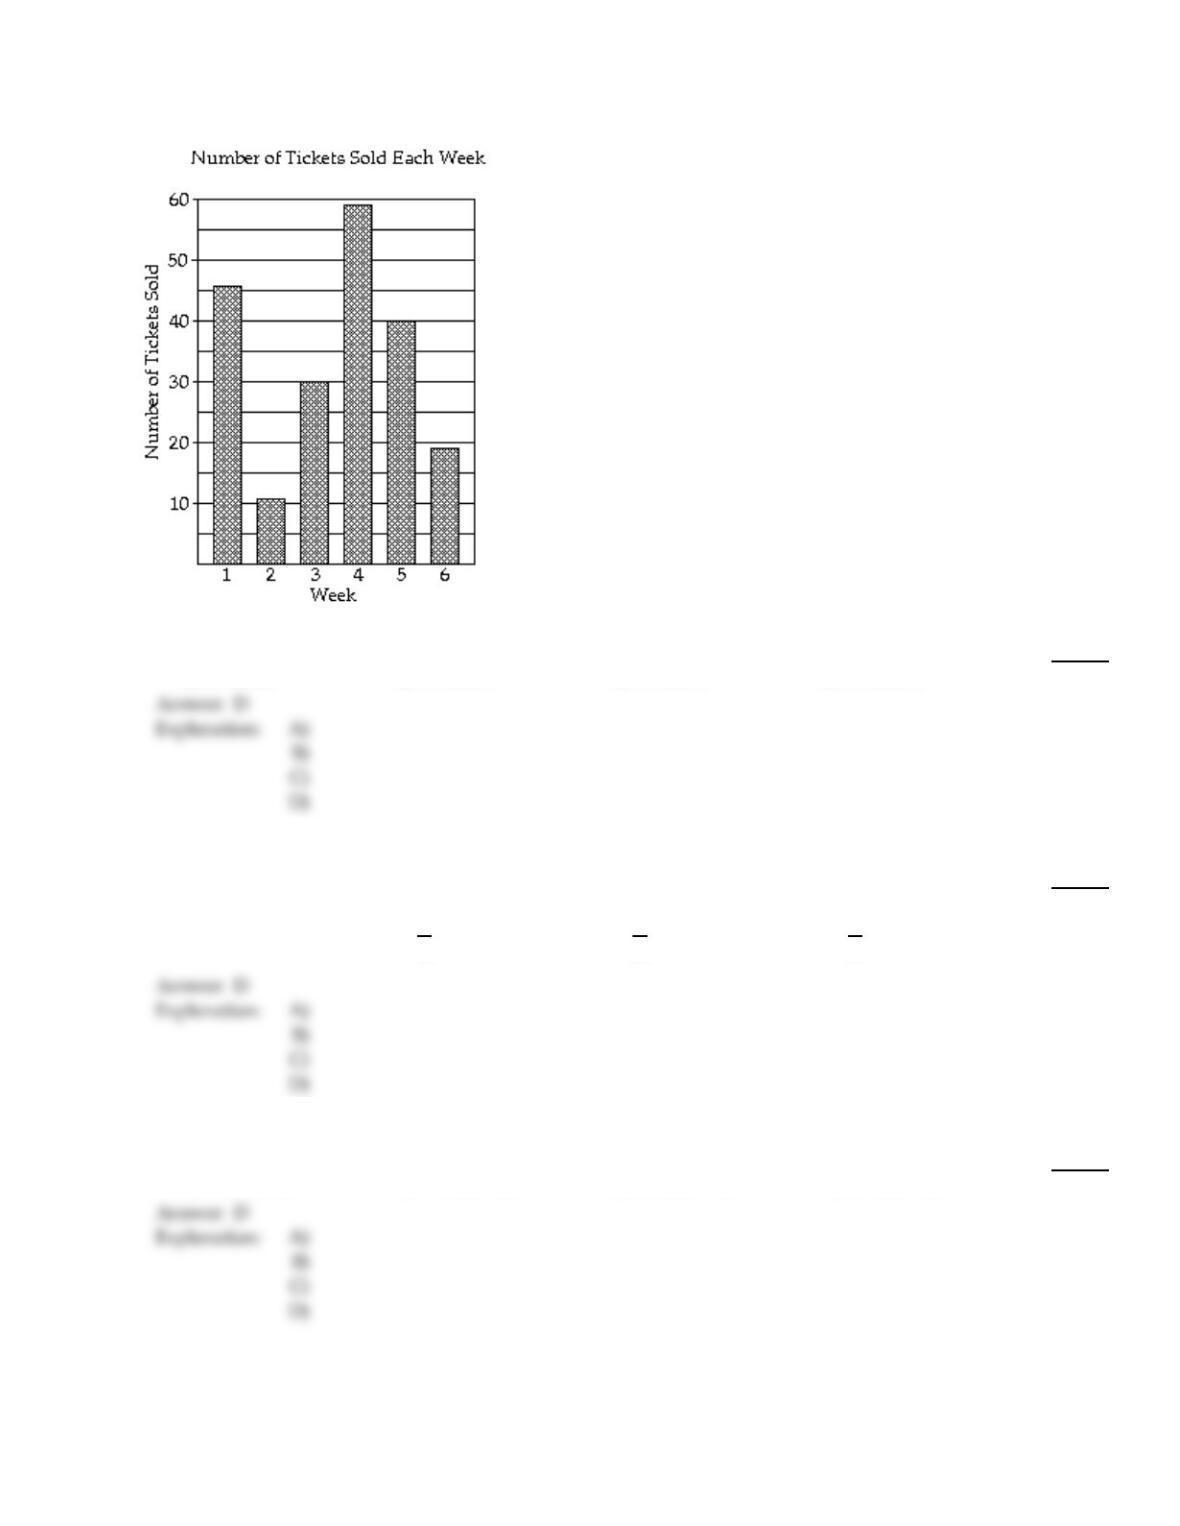
The bar graph shows the number of tickets sold each week by the garden club for their annual flower show.
24)
During which week was the fewest number of tickets sold?
24)
A)
week 6
B)
week 2
C)
week 4
D)
week 5
B
D
The circle graph shows the results of the student council presidential election. The complete circular area represents
100% of the votes.
25)
Student Council President
Ming
24%
Ann
30%Gina
18%
Matt
28%
300 total votes
The circle graph shows what percent of the vote each person received.
If 300 total votes were cast, how many votes did Ann get?
25)
A)
90
B)
54
C)
84
D)
72
Find the probability of the event if a single choice is made from a bag.
26)
A bag contains 3 red marbles, 5 blue marbles, 8 yellow marbles, and 7 green marbles. What is the
probability of choosing a yellow or green marble when one marble is drawn?
26)
A)
7
23
B)
15
23
C)
8
23
D)
1
2
Find the probability of the event.
27)
Two dice are rolled. What is the probability that the sum of the two numbers on the dice will be
greater than 10?
27)
A)
1
18
B)
3
C)
1
12
D)
5
18
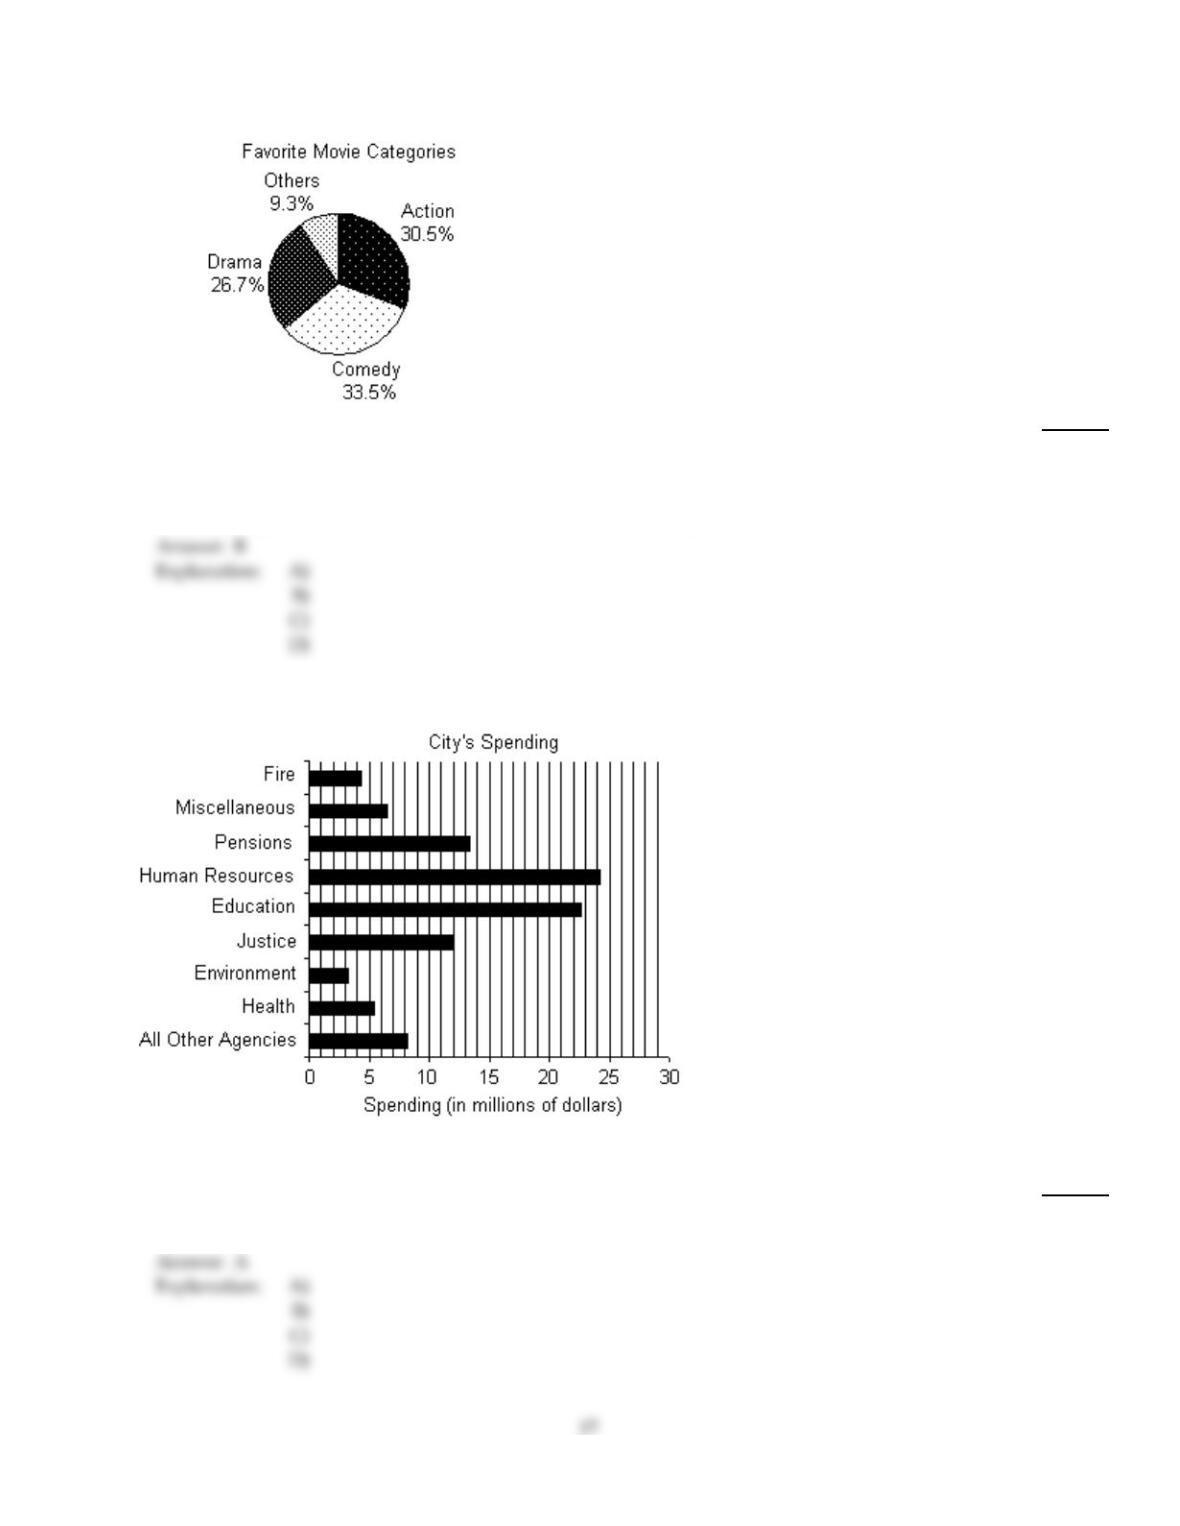
The circle graph summarizes the results of a survey of the favorite movie category chosen by a group of adults.
28)
1500 adults answer the survey.
How many of the survey respondents said that they favor drama movies? Round to the nearest
whole.
28)
A)
2670 respondents
B)
401 respondents
C)
458 respondents
D)
140 respondents
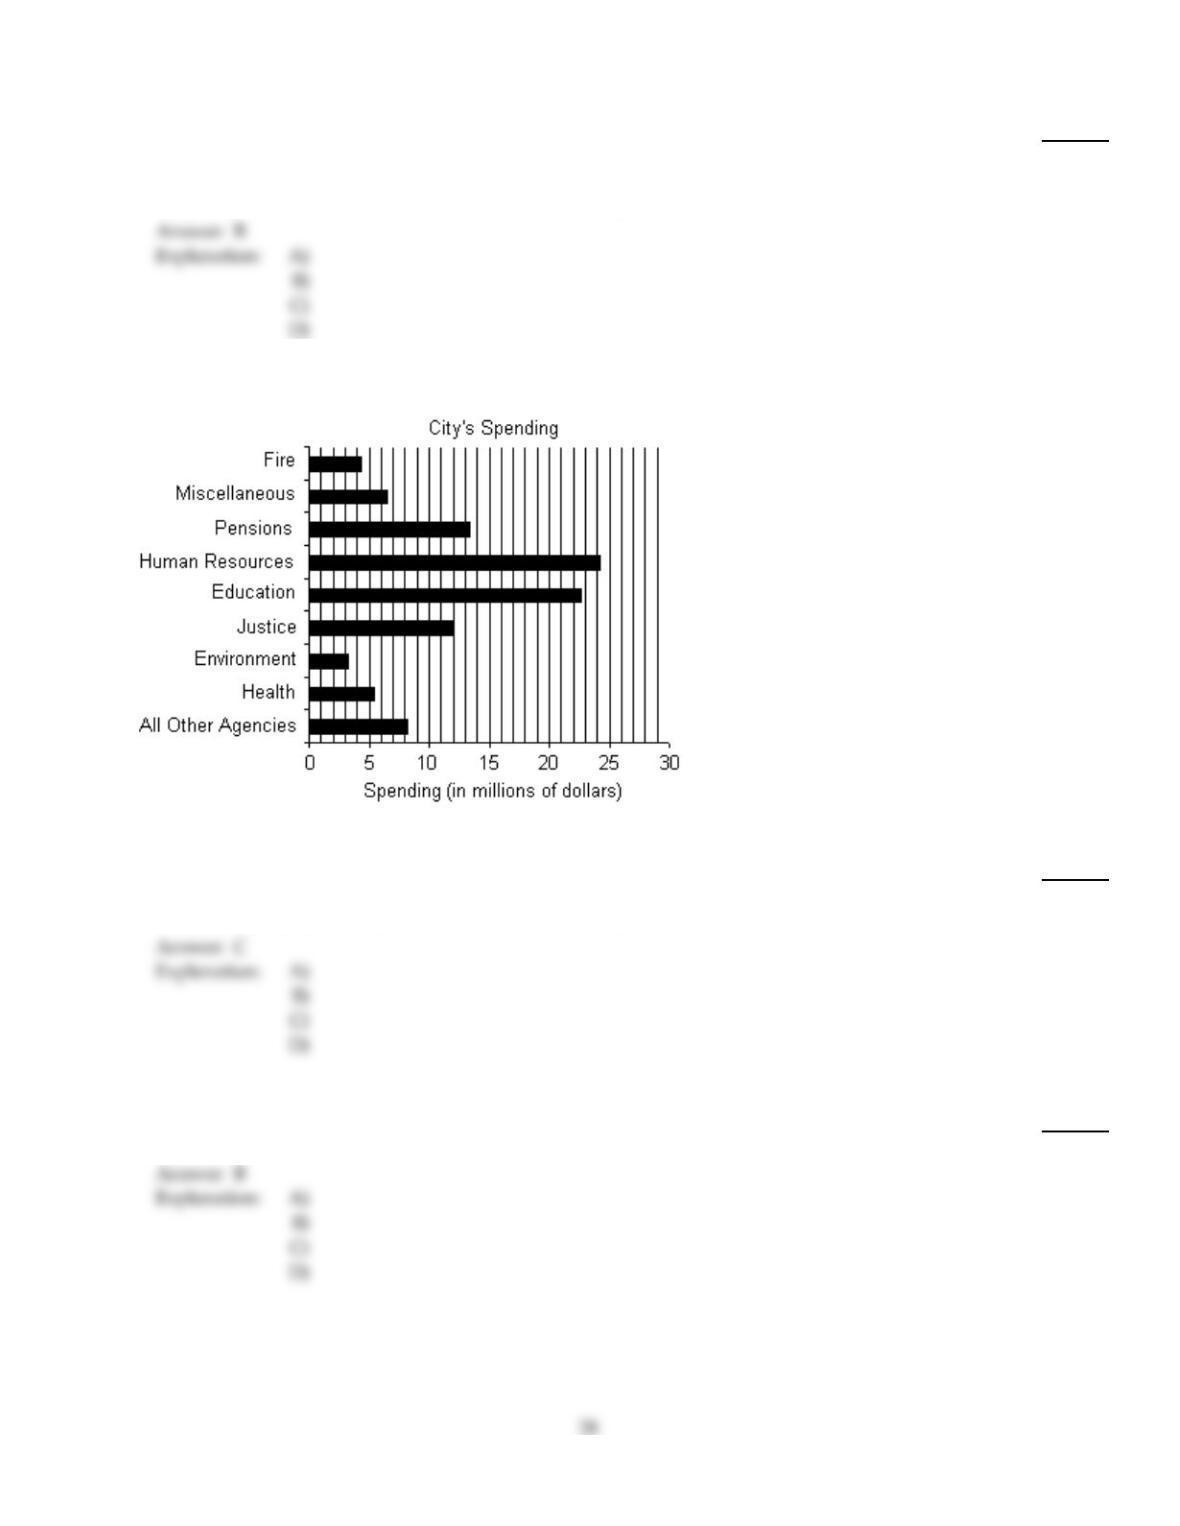
The bar graph shows the expenditures of one city government in a recent year.
29)
Name the agency with the largest spending and estimate this value.
29)
A)
Human Resources; $24.2 million
B)
Pensions; $13.4 million
C)
Environment; $3.2 million
D)
Health; $5.4 million
Fill in the blank with one of the words or phrases listed below.
outcomes bar experiment mean tree diagram
pictograph line class interval median probability
histogram circle class frequency mode
30)
The of an event is number of ways that event can occur
number of possible outcomes .
30)
A)
mode
B)
probability
C)
median
D)
mean
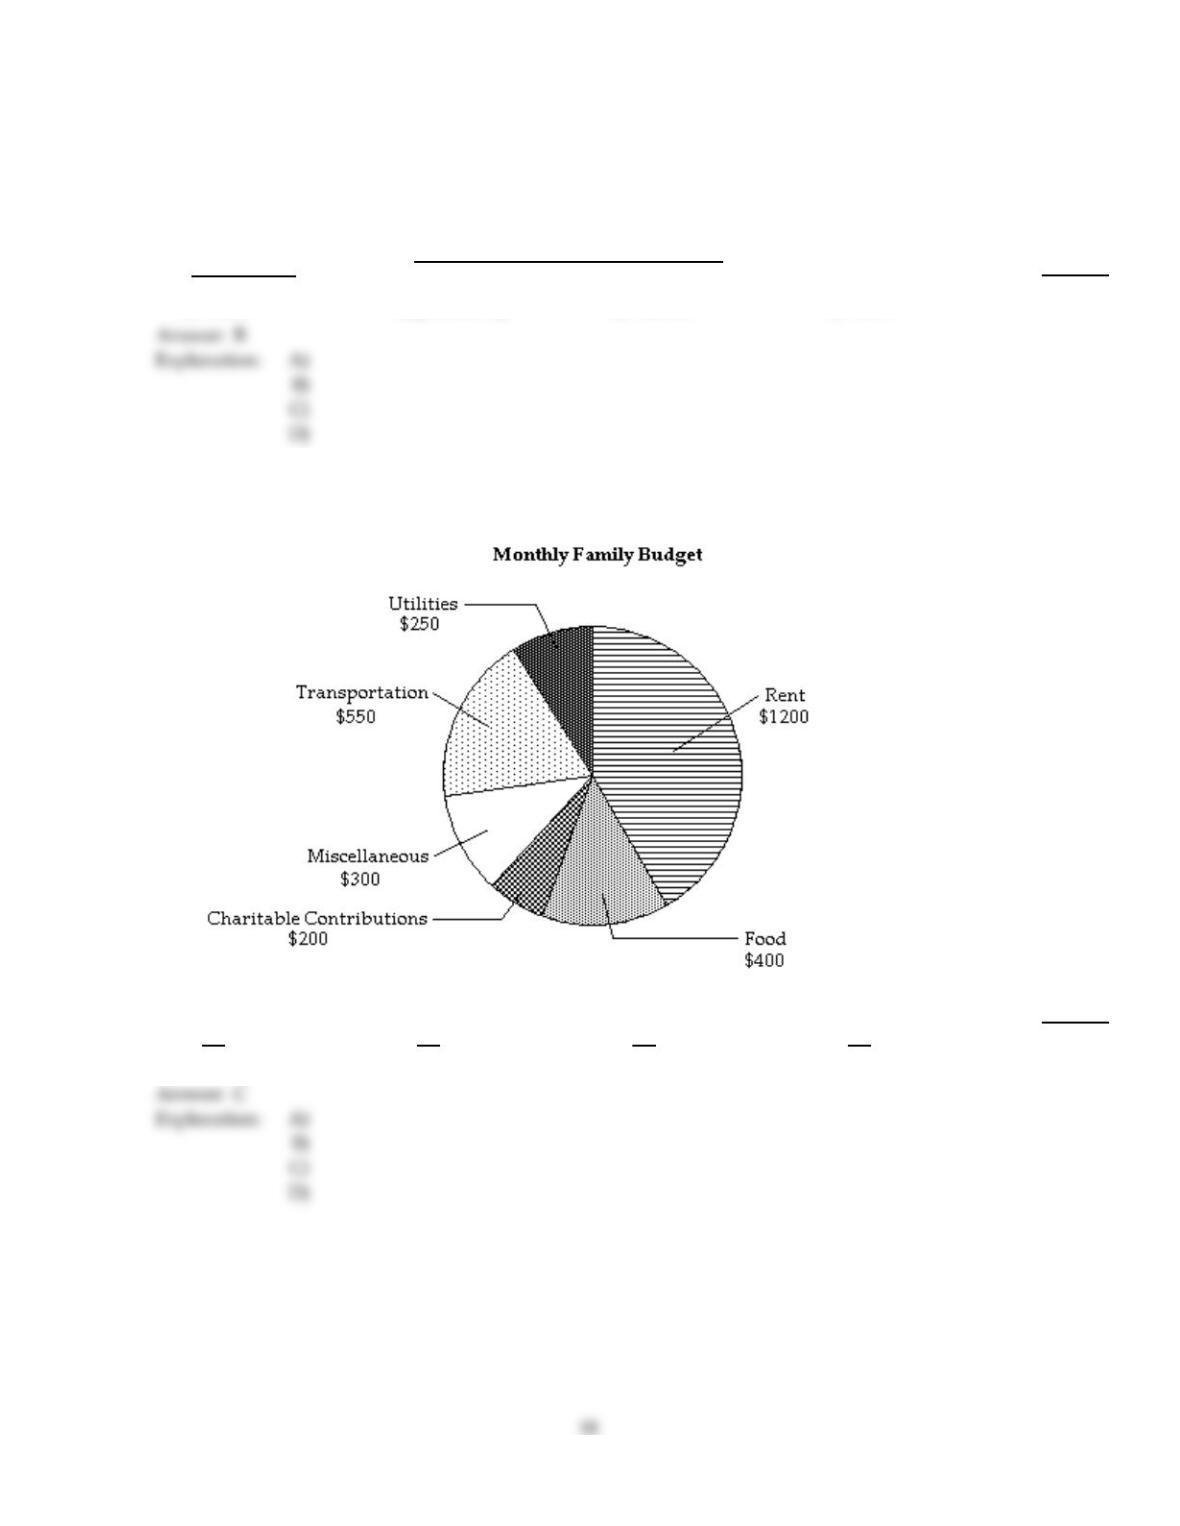
The following circle graph displays Chris and Mary Smith’s monthly $2900 family budget. Use the circle graph to answer
the question.
31)
What is the ratio of money spent on utilities to the total amount of the monthly budget?
31)
A)
58
11
B)
11
58
C)
5
58
D)
58
5
Find the mean. If necessary, round to one decimal place.
32)
1.5, 0.6, 0.8, 1.5, 0.4, 1.7, 0.4, 1.8, 2.2
32)
A)
1.2
B)
1
C)
1.3
D)
10.9
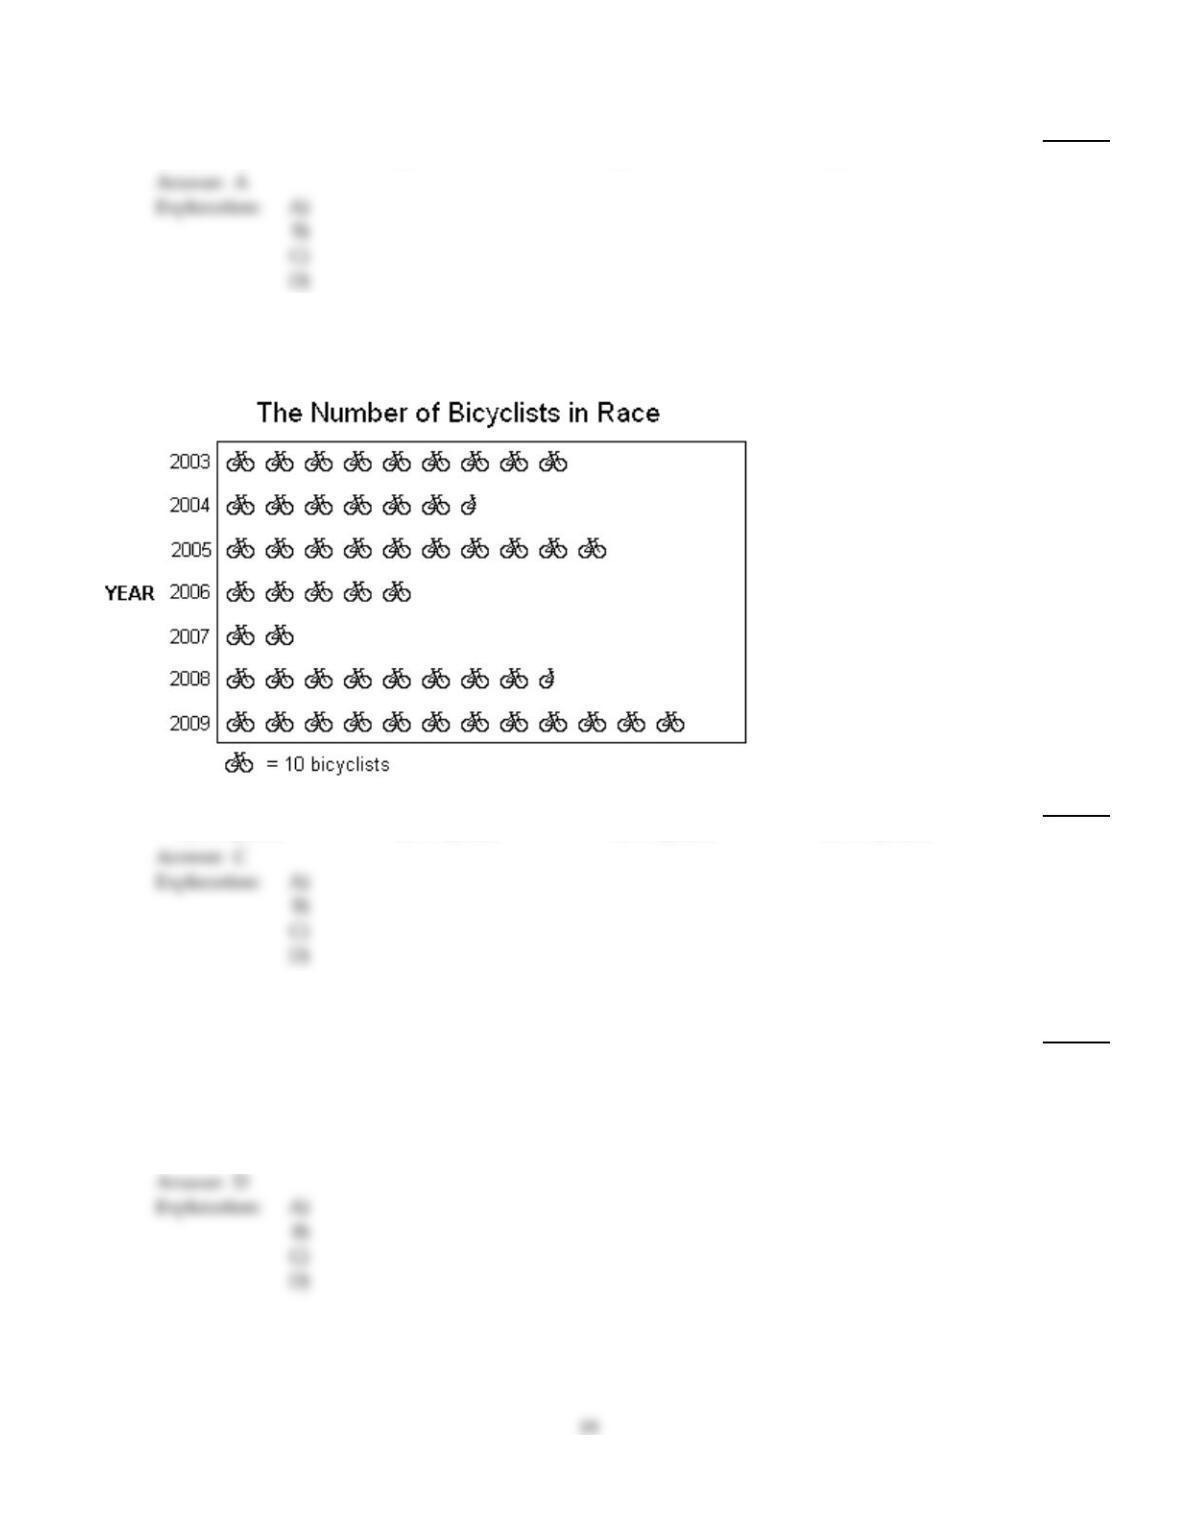
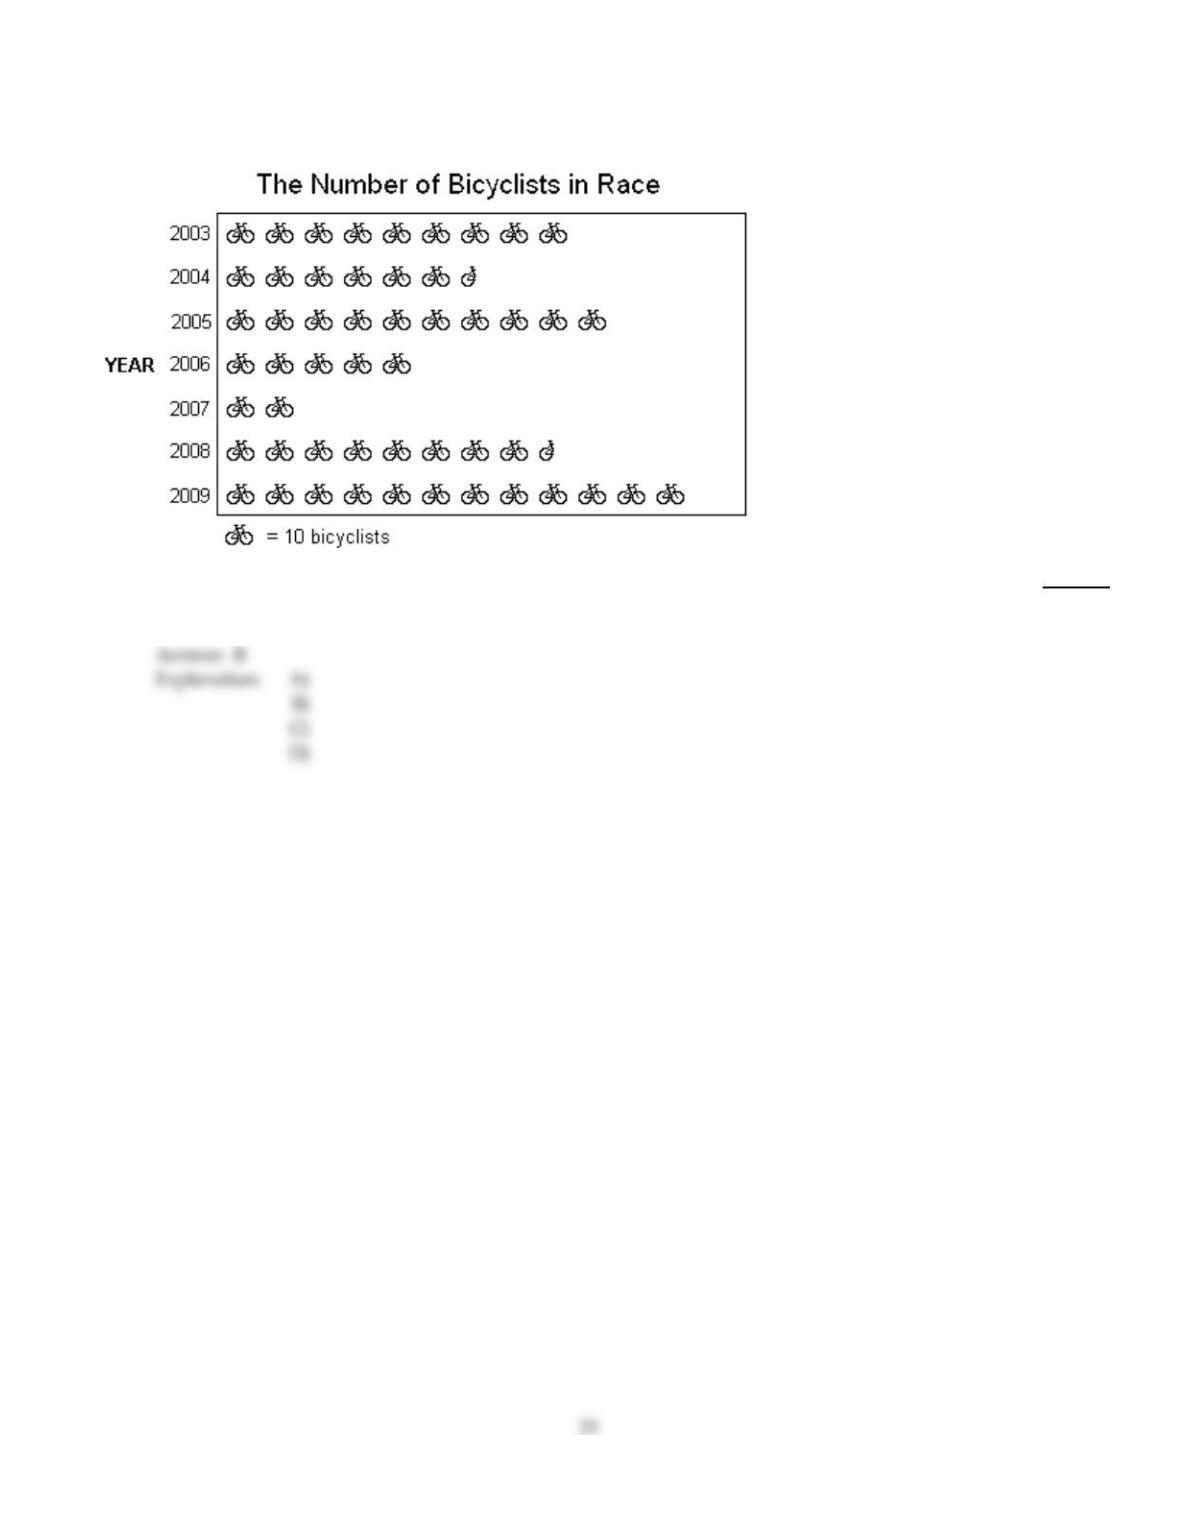
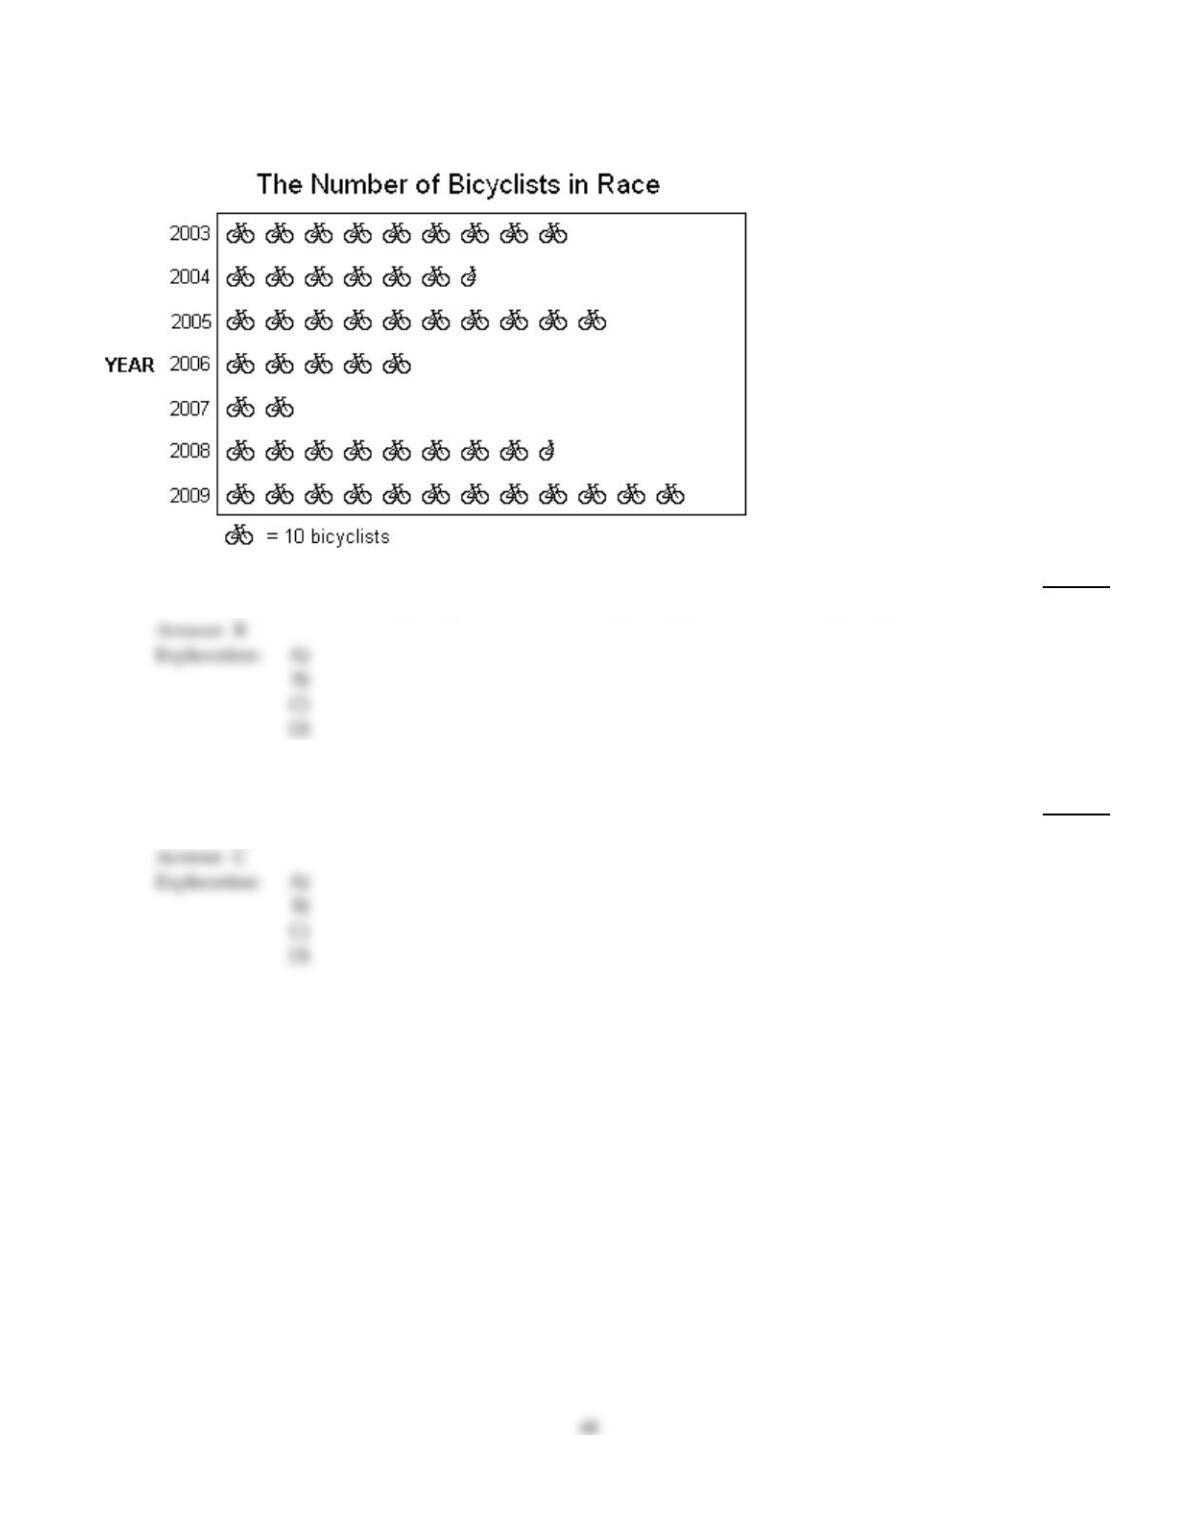
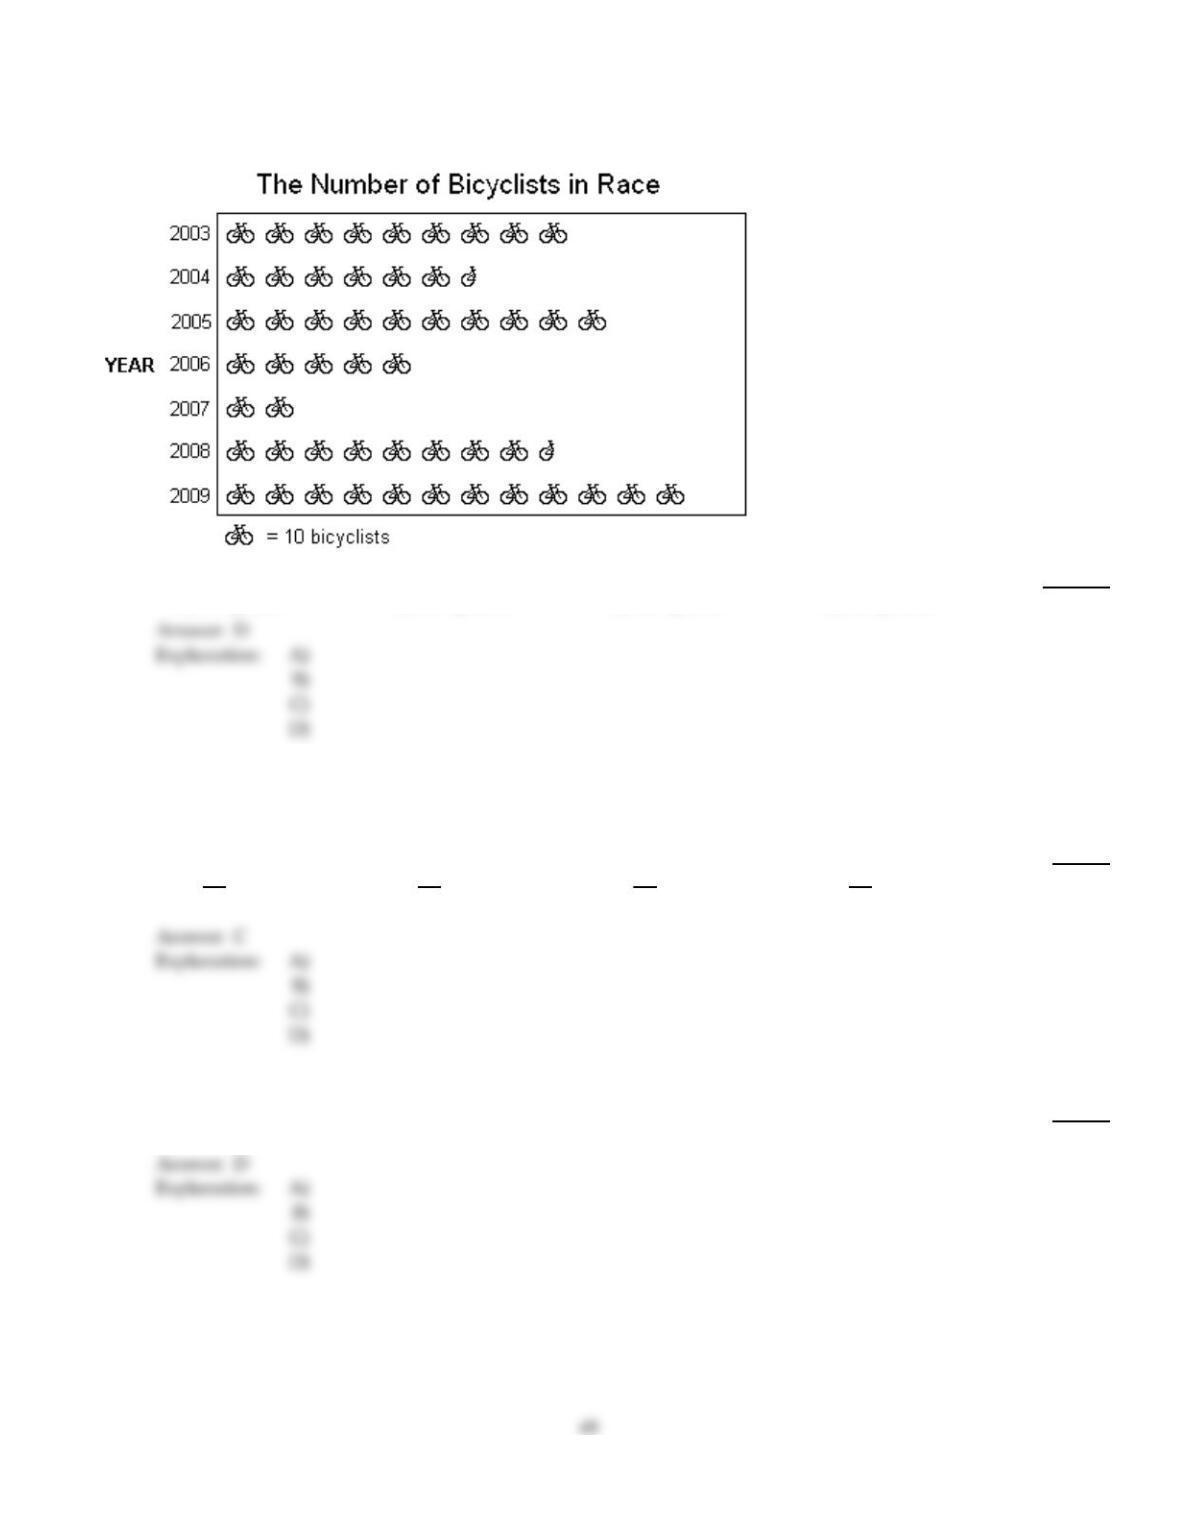
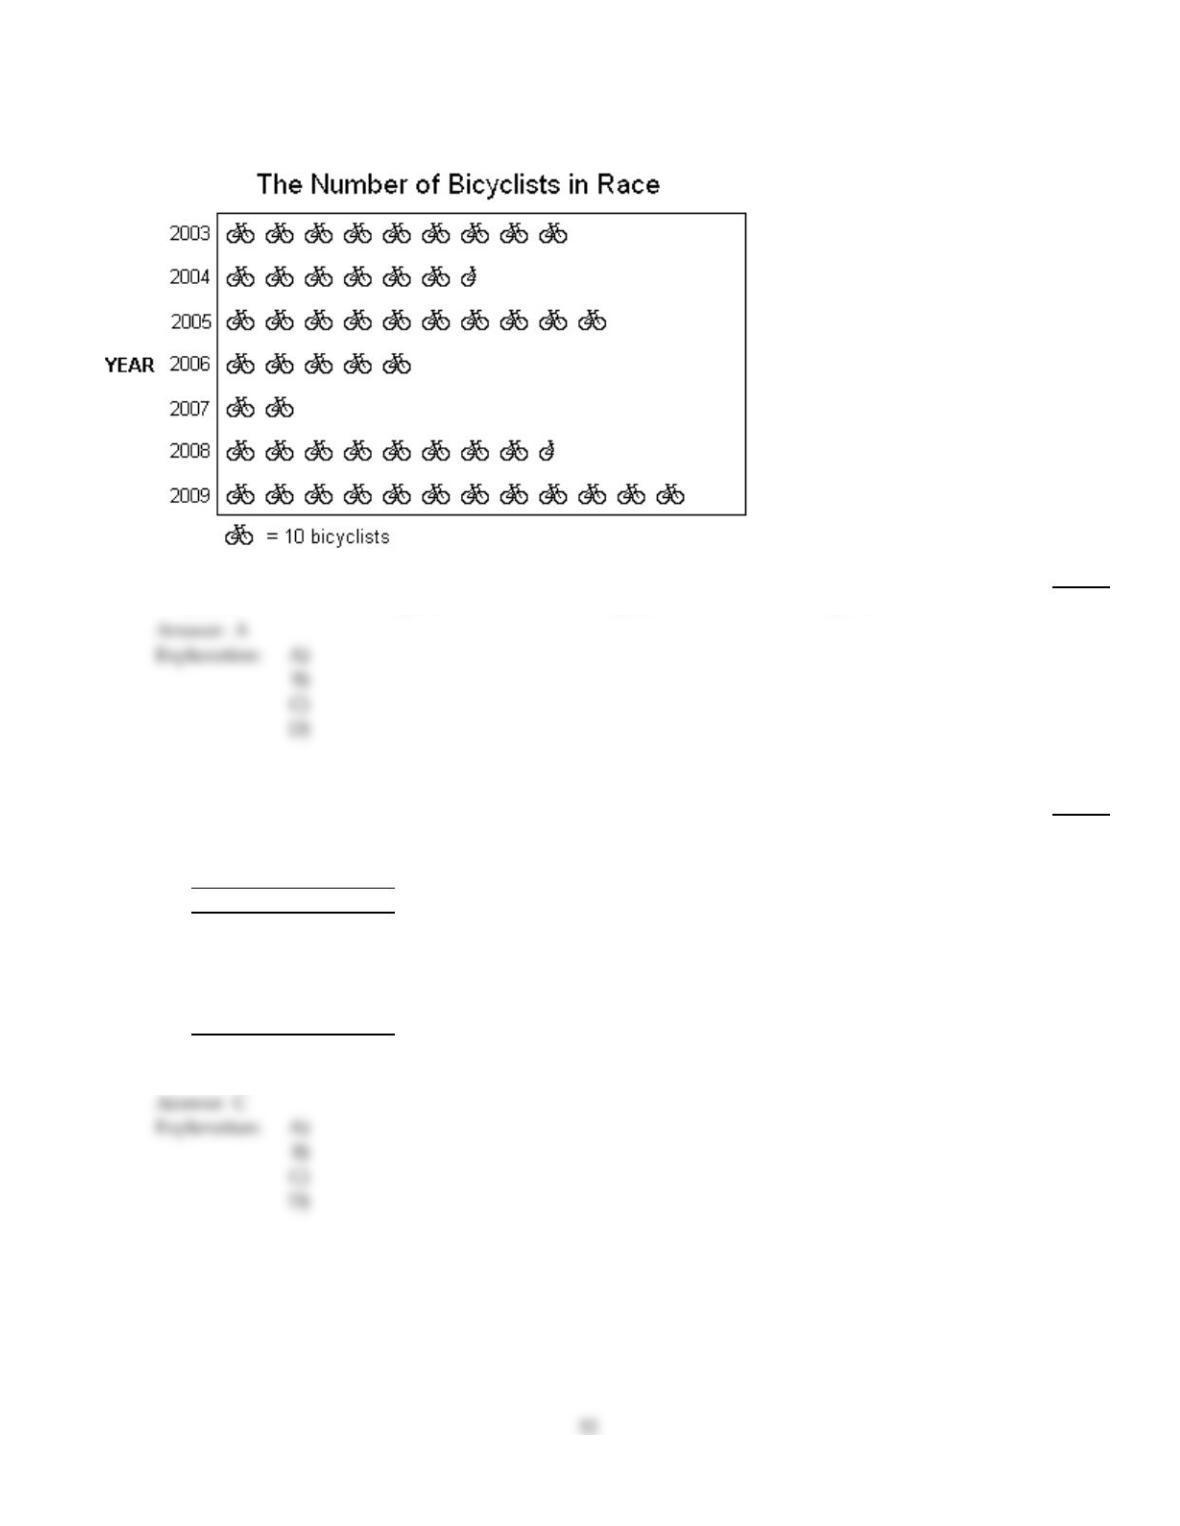
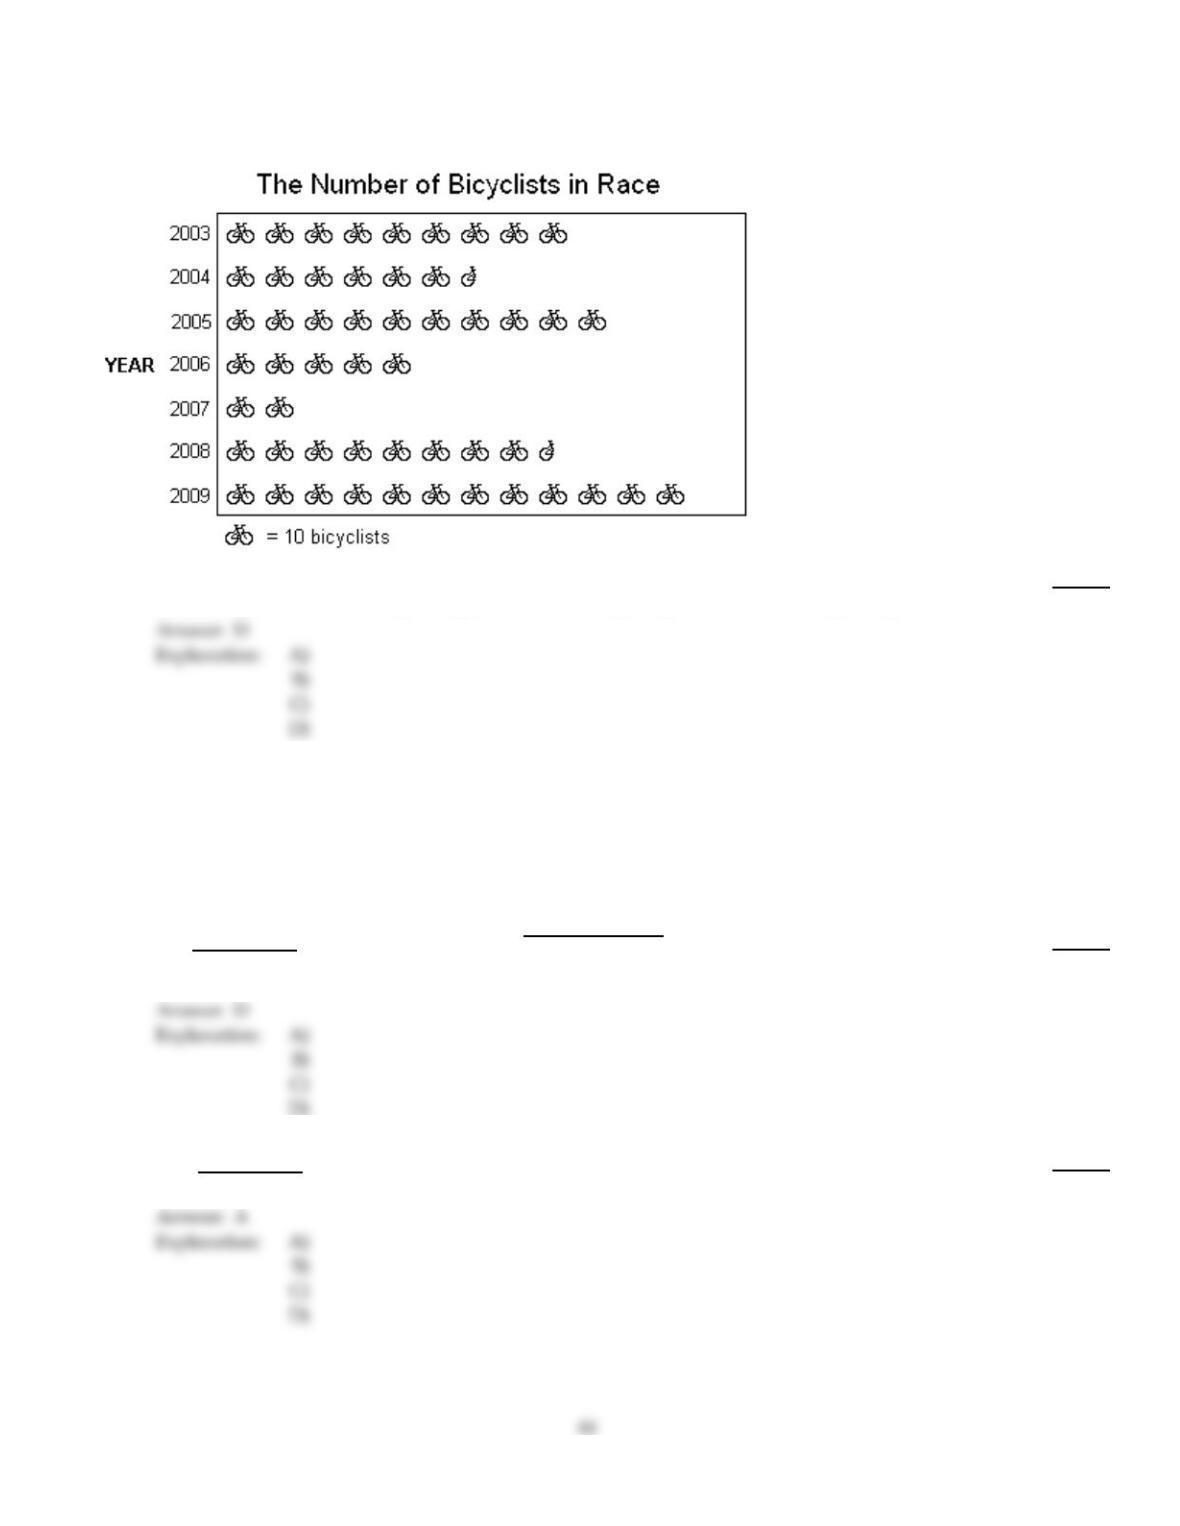
The following pictograph shows the number of bicyclists who participated in the Labor Day weekend bicycle race for the
years 2003–2009. Use the graph to answer the question.
33)
What was the increase in the number of participants from 2007 to 2008?
33)
A)
75 cyclists
B)
70 cyclists
C)
65 cyclists
D)
60 cyclists
Solve. If necessary, round answers to the nearest hundredth.
34)
The following test scores were recorded for a student: 95, 87, 83, 83, 95, 97. Find the mean, median,
and mode.
34)
A)
mean: 90 median: 83 mode: 97
B)
mean: 91 median: 90 mode: 95
C)
mean: 91 median: 91 mode: 83
D)
mean: 90 median: 91 mode: 83 and 95
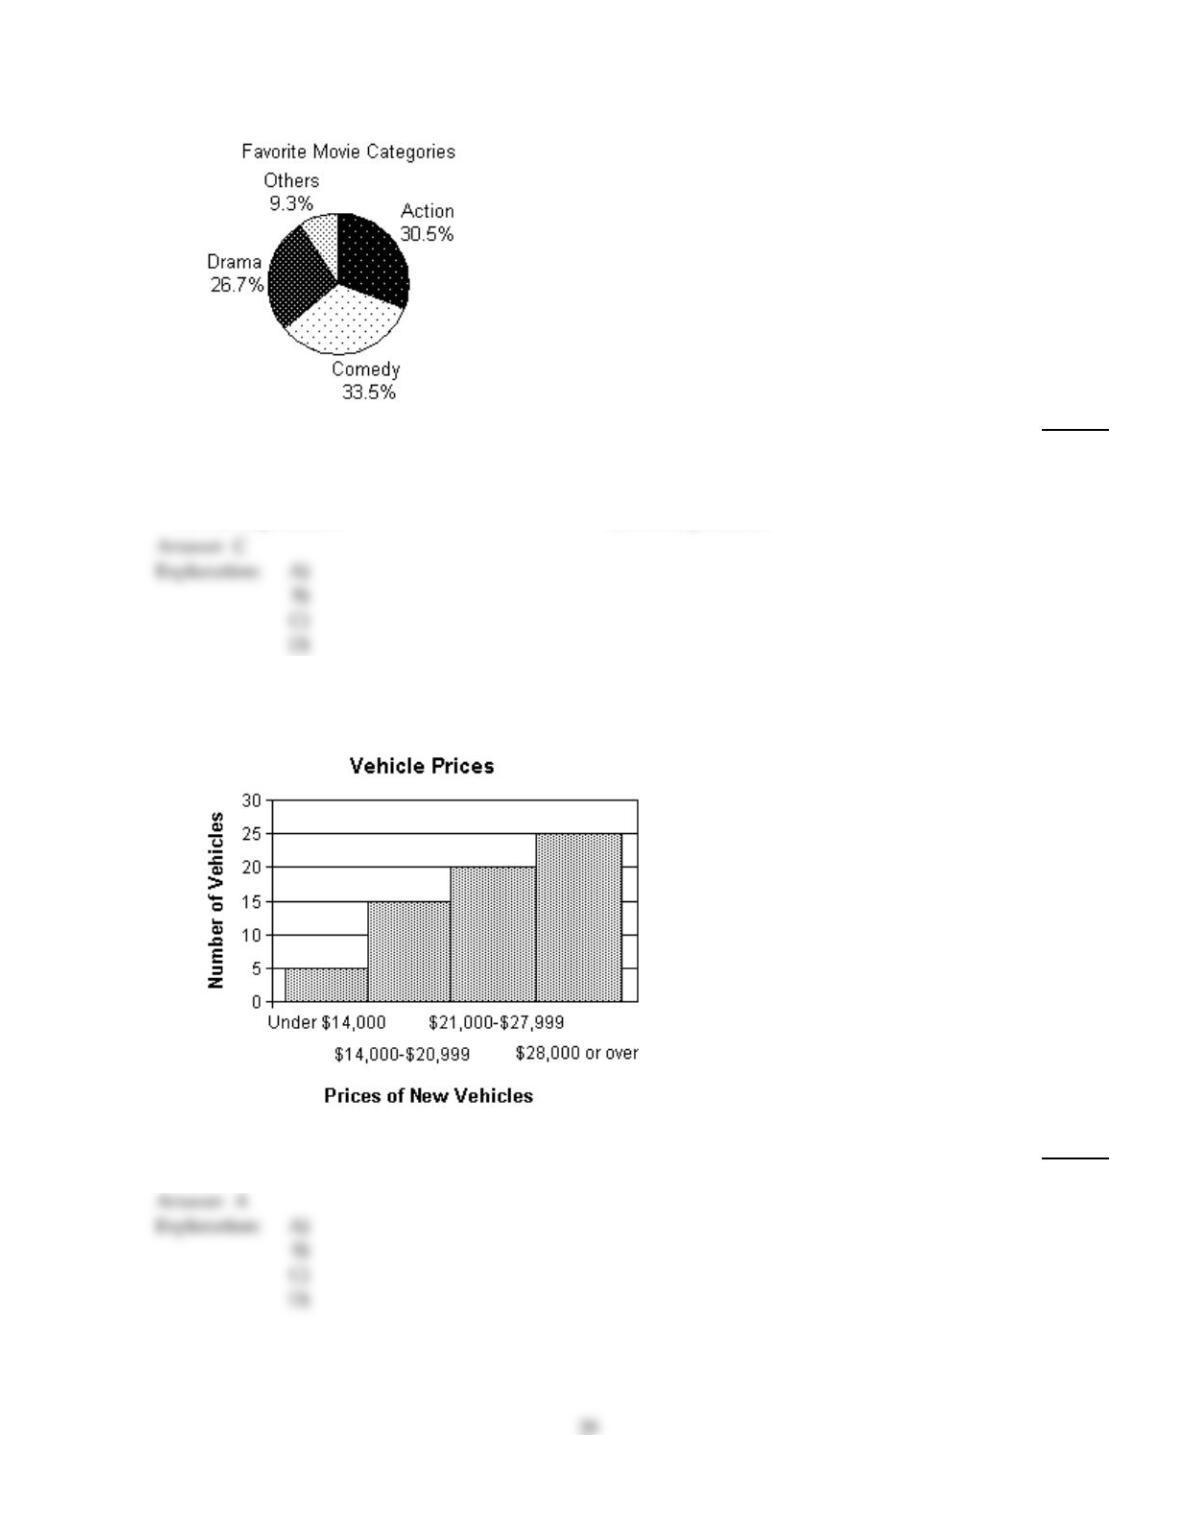
The circle graph summarizes the results of a survey of the favorite movie category chosen by a group of adults.
35)
2300 adults answer the survey.
How many of the survey respondents said that they favor action movies? Round to the nearest
whole.
35)
A)
771 respondents
B)
3050 respondents
C)
702 respondents
D)
614 respondents
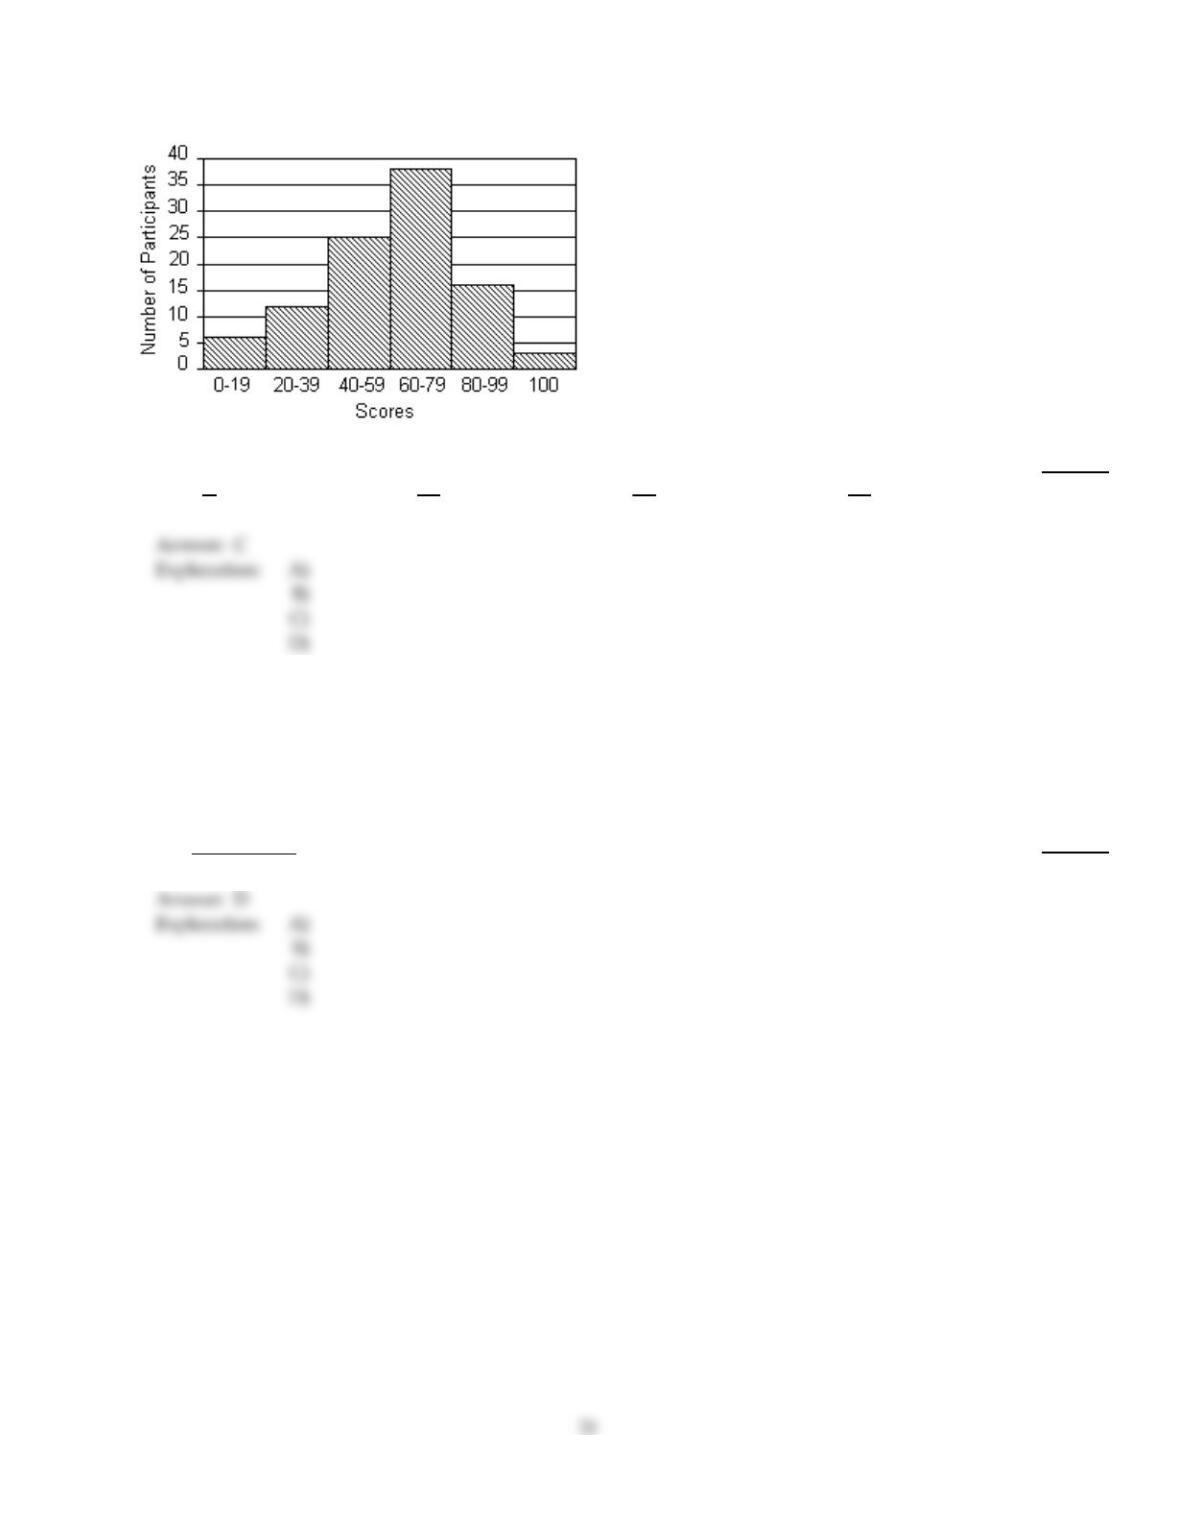
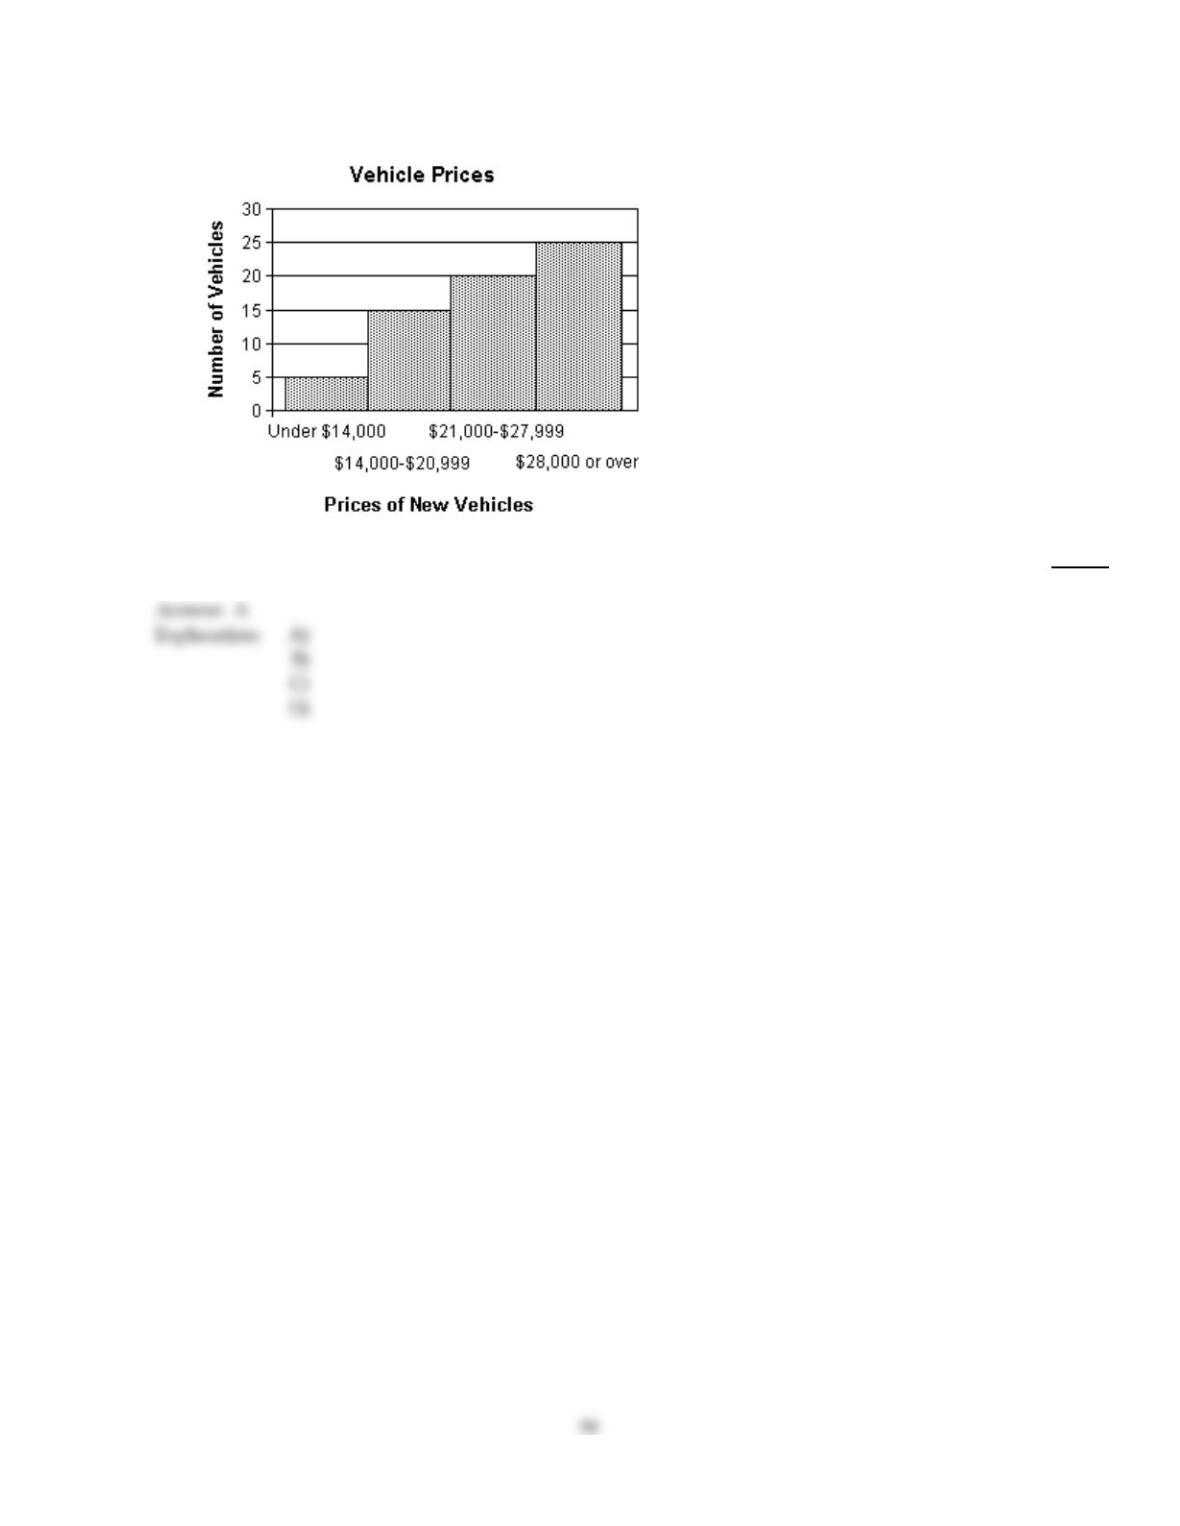
A new car dealership has taken an inventory of the vehicles it has in stock. Below is a histogram indicating the number
of vehicles in stock in certain price ranges. Use the histogram to answer the question.
36)
How many vehicles in stock are priced $14,000 or more?
36)
A)
60 vehicles
B)
65 vehicles
C)
55 vehicles
D)
5 vehicles
The histogram shows the scores of each participant in a game from a total of 100 participants.
37)
What is the ratio of participants who score 0–19 to the total number of participants?
37)
A)
1
4
B)
3
25
C)
3
50
D)
50
3
Fill in the blank with one of the words or phrases listed below.
outcomes bar experiment mean tree diagram
pictograph line class interval median probability
histogram circle class frequency mode
38)
The of a set of numbers is the number that occurs the most often.
38)
A)
mean
B)
probability
C)
median
D)
mode
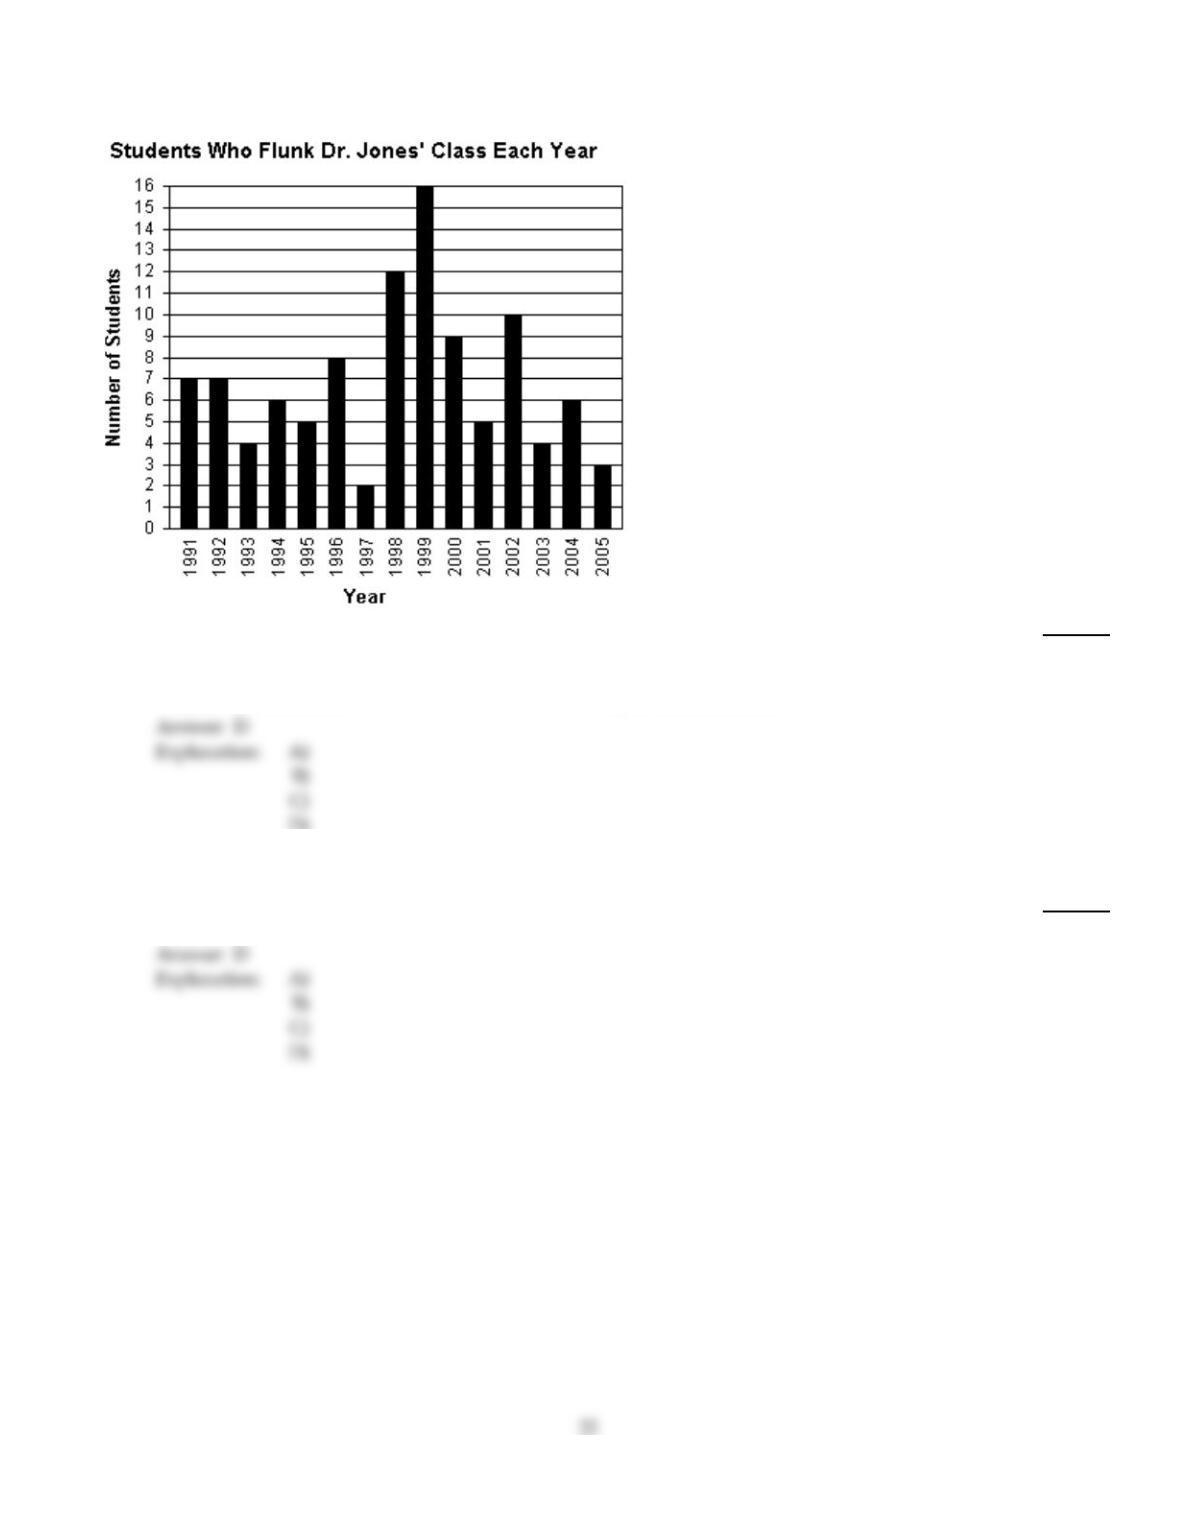
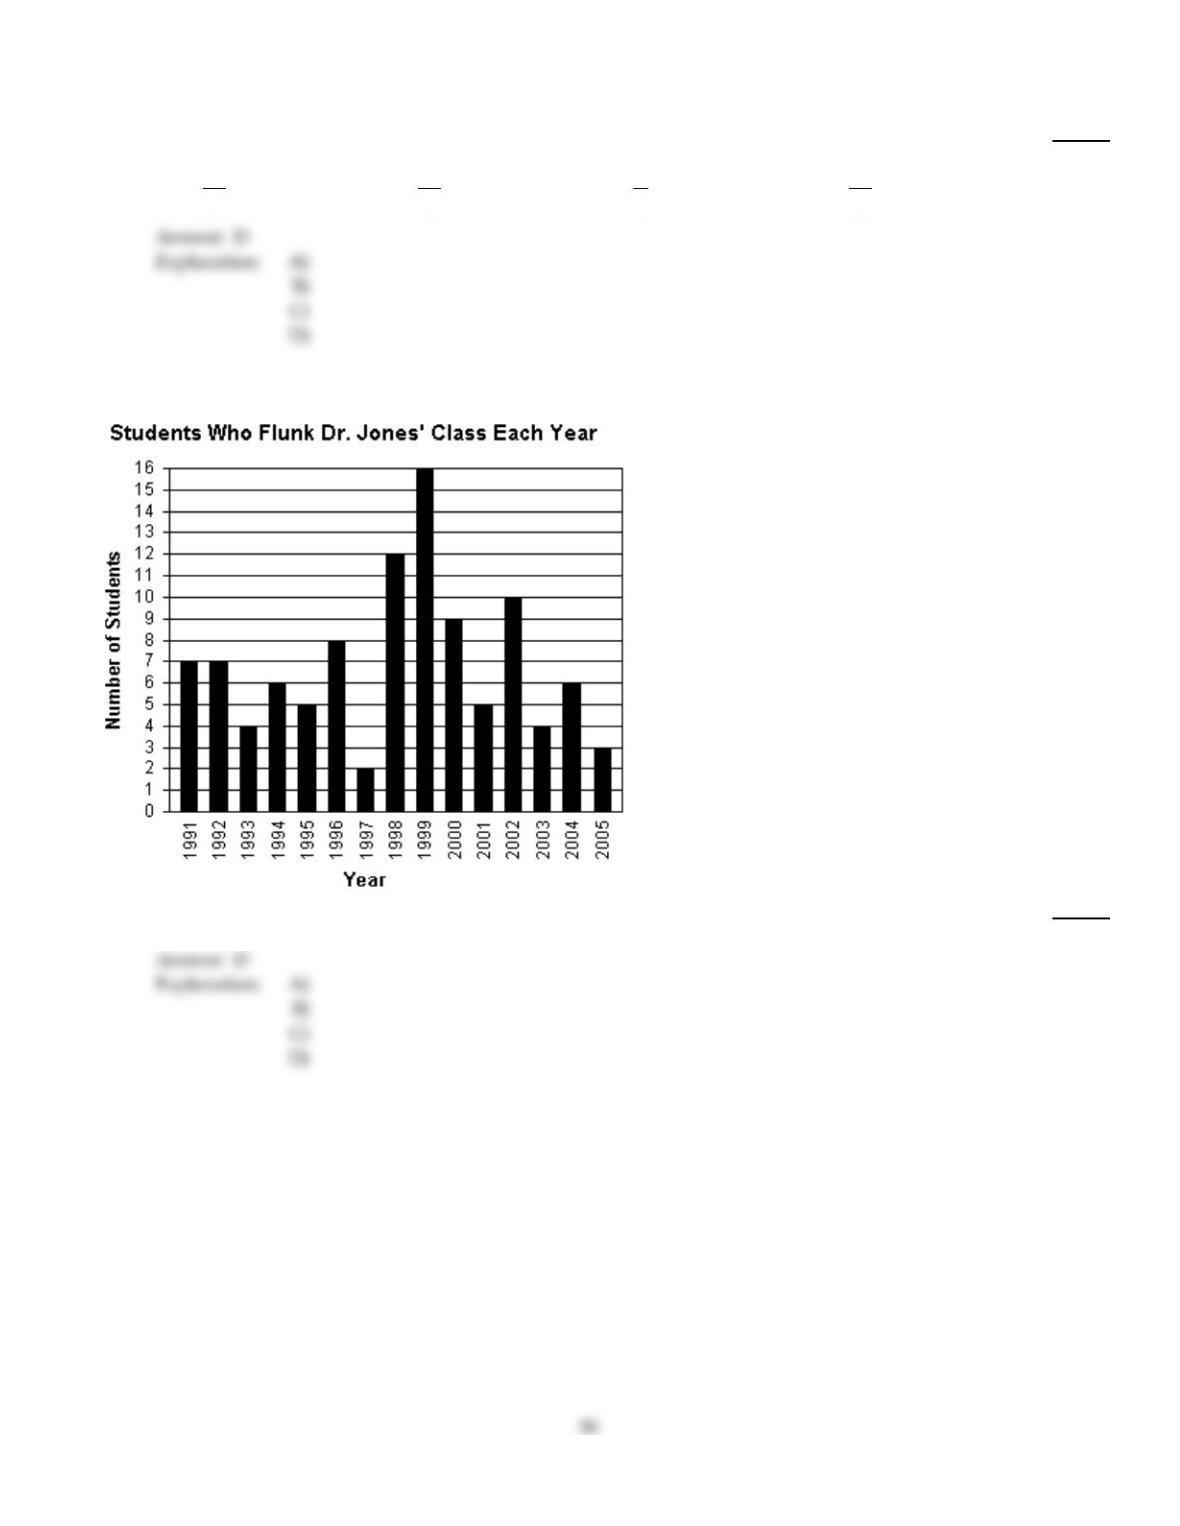
The bar graph shows the number of students who flunk Dr. Jones’ class each year.
39)
During which year did Dr. Jones’ have the greatest number of students flunk his class? How many
students flunked during that year?
39)
A)
1997, 2 students
B)
1998, 12 students
C)
1998, 16 students
D)
1999, 16 students
D)
Find the median. If necessary, round to one decimal place.
40)
7, 2, 21, 16, 48, 41, 39
40)
A)
16
B)
39
C)
25.4
D)
21
D)
The following pictograph shows the number of bicyclists who participated in the Labor Day weekend bicycle race for the
years 2003–2009. Use the graph to answer the question.
41)
In what years was there a decline in the number of cyclists who participated in the race?
41)
A)
2004, 2006
B)
2004, 2006, 2007
C)
2005, 2008, 2009
D)
2004, 2006, 2007, 2008
The line graph shows the recorded hourly temperatures in degrees Fahrenheit at an airport.
42)
During which hours shown was the temperature greater than 77°F?
42)
A)
1 p.m. to 3 p.m.
B)
11 a.m. to 3 p.m.
C)
1 p.m. to 2 p.m.
D)
11 a.m. to 2 p.m.
The circle graph shows the results of the student council presidential election. The complete circular area represents 100%
of the votes.
43)
Student Council President
Gina
25%
Ming
32%Jim
15%
Ann
28%
400 total votes
The circle graph shows what percent of the vote each person received.
Find the ratio of Jim‘s votes to Gina‘s votes.
43)
A)
15
32
B)
3
20
C)
3
5
D)
5
3
A deck of cards contains 52 cards. These cards consist of four suits (hearts, spades, clubs, and diamonds) of each of the
following: 2, 3, 4, 5, 6, 7, 8, 9, 10, jack, queen, king, and ace. If a card is chosen from a deck of cards, find the probability of
each event.
44)
Selecting the 10 of clubs
44)
A)
1
13
B)
1
52
C)
1
26
D)
4
13
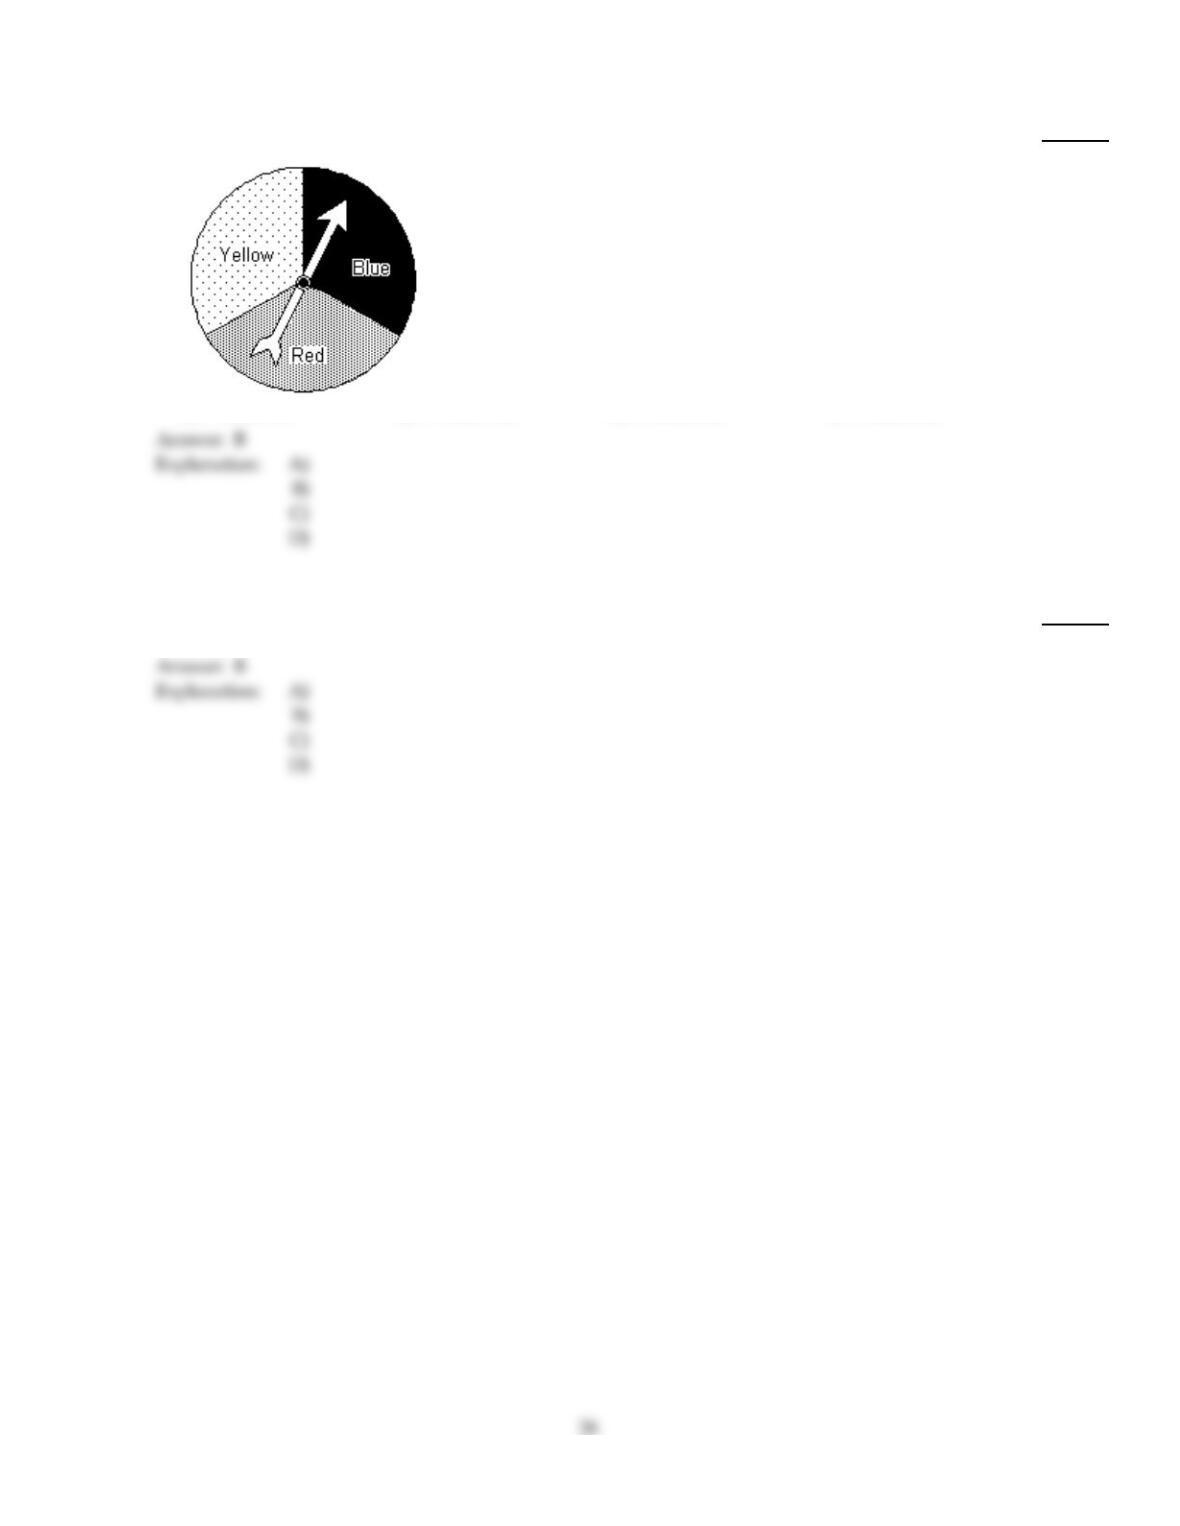
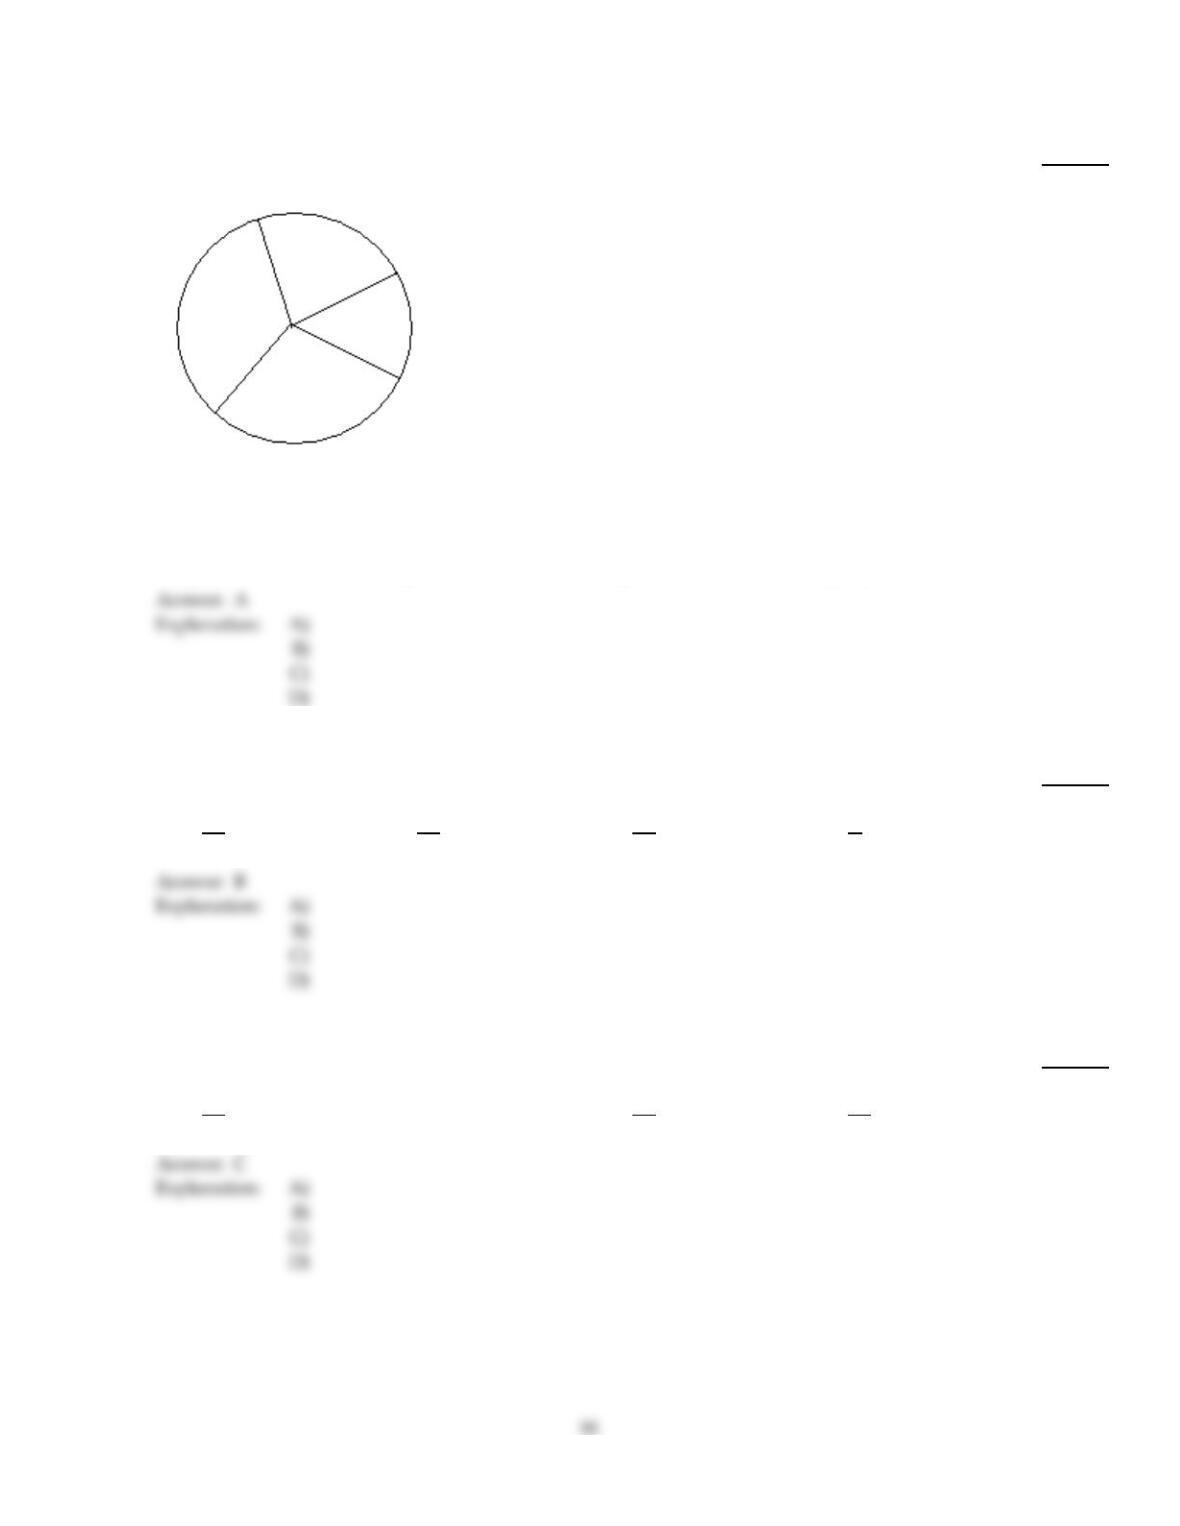
Draw a tree diagram for the experiment to find the number of outcomes.
45)
Spinning the spinner three times
45)
A)
9 outcomes
B)
27 outcomes
C)
6 outcomes
D)
3 outcomes
Find the mode or modes (if any).
46)
7.02, 7.41, 7.56, 7.02, 7.88, 7.99, 7.62
46)
A)
7.56
B)
7.02
C)
7.5
D)
7.41

The circle graph shows the results of the student council presidential election. The complete circular area represents 100%
of the votes.
47)
Student Council President
Jim
22%
Ted
36%Ann
18%
Matt
24%
500 total votes
The circle graph shows what percent of the vote each person received.
How many votes did Ted get?
47)
A)
120
B)
180
C)
90
D)
110
48)
Student Council President
Ming
22%
Jim
36%Ted
18%
Ben
24%
600 total votes
The circle graph shows what percent of the vote each person received.
What percent of the votes did Ted and Ming receive together?
48)
A)
60%
B)
18%
C)
22%
D)
40%
Solve. If necessary, round answers to the nearest hundredth.
49)
The following test scores were recorded for a student: 92, 87, 85, 81, 87, 73, 83. Find the mean,
median, and mode.
49)
A)
mean: 84 median: 81 mode: 92
B)
mean: 84 median: 85 mode: 87
C)
mean: 85 median: 84 mode: 92
D)
mean: 85 median: 81 mode: 87
The bar graph shows the expenditures of one city government in a recent year.
50)
Name the agency whose spending is between $13 million and $14 million and estimate its value.
50)
A)
Pensions; $22.7 million
B)
Education; $22.7 million
C)
Pensions; $13.4 million
D)
Education; $13.4 million
Draw a tree diagram to find the number of possible outcomes.
51)
Choose a number, 1, 2, 3, and then a vowel, a,e,i,o,u.
51)
A)
12 outcomes
B)
15 outcomes
C)
8 outcomes
D)
5 outcomes
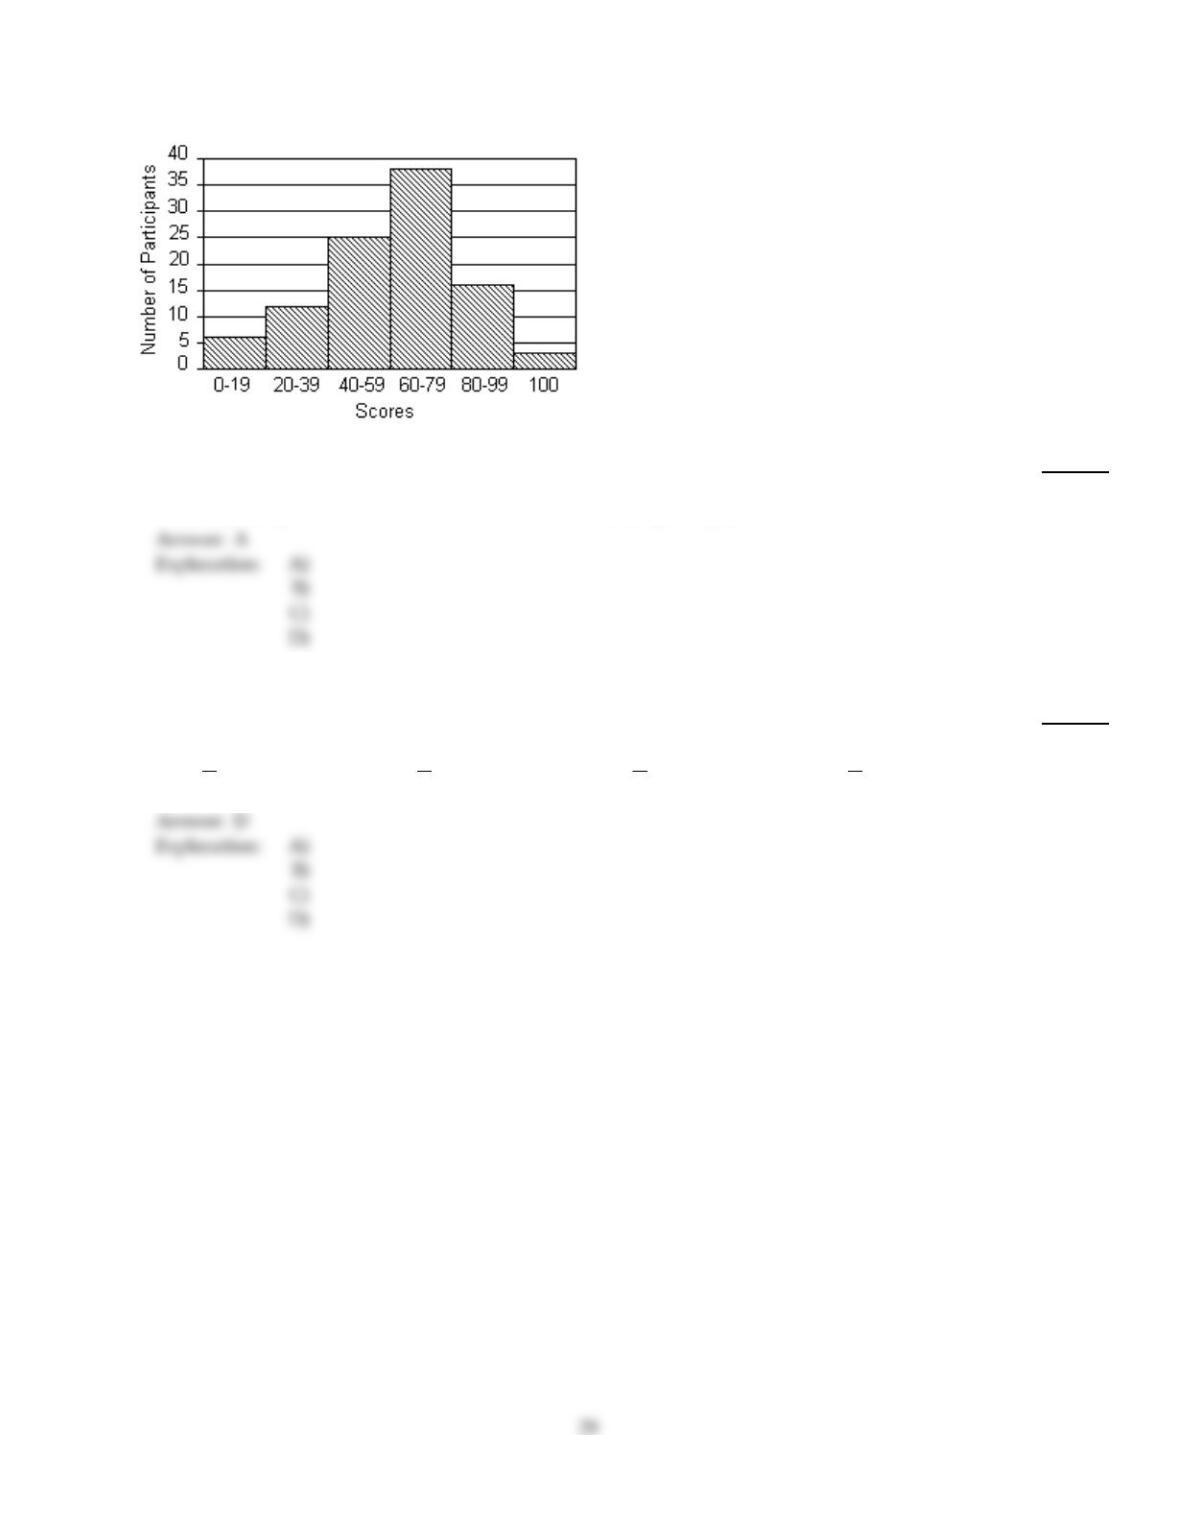
The histogram shows the scores of each participant in a game from a total of 100 participants.
52)
How many participants scored more than 0?
52)
A)
100 participants
B)
3 participants
C)
57 participants
D)
19 participants
Find the probability of the event.
53)
If a single die is rolled, find the probability of the following event.
A number less than 6?
53)
A)
5
7
B)
1
3
C)
1
6
D)
5
6
D
A
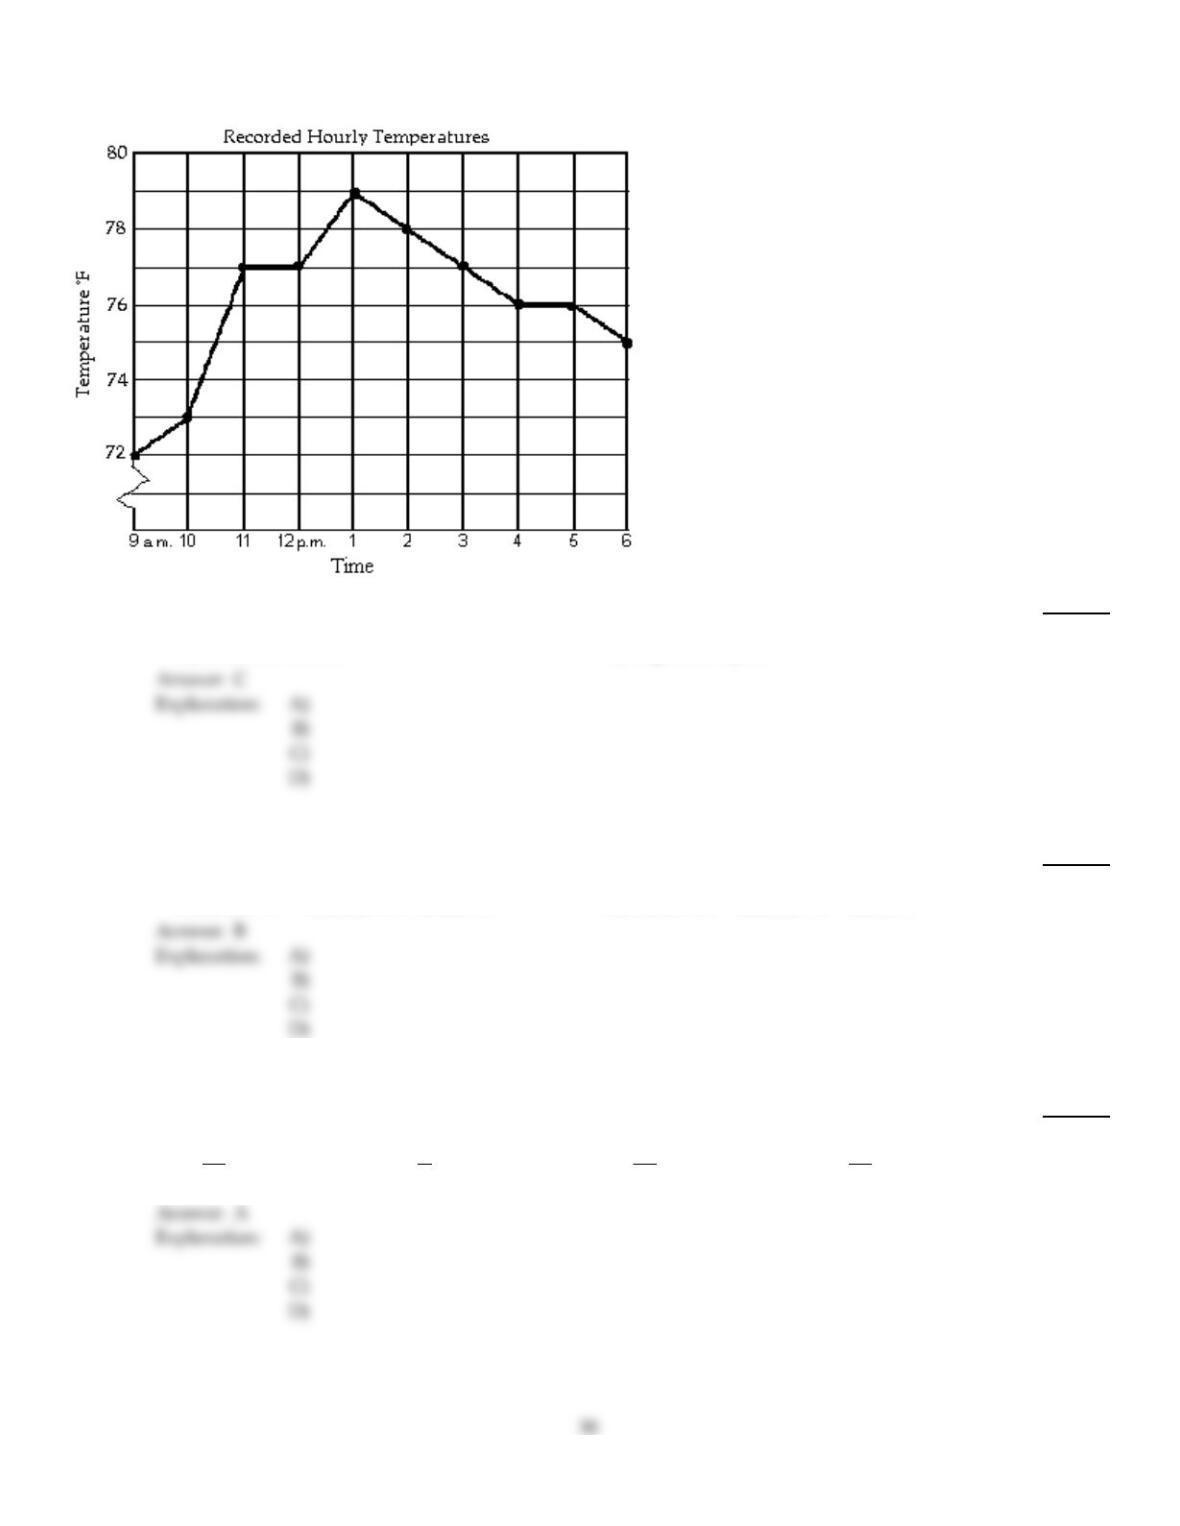
The line graph shows the recorded hourly temperatures in degrees Fahrenheit at an airport.
54)
During which hour did the temperature increase the most?
54)
A)
1 p.m. to 2 p.m.
B)
9 a.m. to 10 a.m.
C)
10 a.m. to 11 a.m.
D)
12 p.m. to 1 p.m.
Find the mean, median, and mode of the list of numbers. If necessary, round to the nearest tenth.
55)
77, 50, 72, 50, 63
55)
A)
mean: 62.4 median: 63 mode: 77
B)
mean: 62.4 median: 63 mode: 50
C)
mean: 78 median: 67.5 mode: 50
D)
mean: 65.5 median: 72 mode: 77
B
Find the probability of the event if a single choice is made from a bag.
56)
A bag contains 6 red marbles, 9 blue marbles, and 8 green marbles. What is the probability of
choosing a blue marble when one marble is drawn?
56)
A)
9
23
B)
3
5
C)
8
23
D)
6
23
A
C
Fill in the blank with one of the words or phrases listed below.
outcomes bar experiment mean tree diagram
pictograph line class interval median probability
histogram circle class frequency mode
57)
The possible results of an experiment are the .
57)
A)
outcomes
B)
class interval
C)
probability
D)
class frequency
The line graph shows the recorded hourly temperatures in degrees Fahrenheit at an airport.
58)
During which hours was the temperature decreasing?
58)
A)
9 a.m. to 11 a.m. and 12 p.m. to 1 p.m.
B)
1 p.m. to 4 p.m. and 5 p.m. to 6 p.m.
C)
9 a.m. to 1 p.m.
D)
1 p.m. to 6 p.m.
B
A

The histogram shows the scores of each participant in a game from a total of 100 participants.
59)
How many participants scored 20–39?
59)
A)
12 participants
B)
16 participants
C)
25 participants
D)
38 participants
Find the mean. If necessary, round to one decimal place.
60)
17, 4, 26, 17
60)
A)
14.5
B)
22.7
C)
16.5
D)
16
D
61)
60, 44, 240, 112
61)
A)
152
B)
113.5
C)
114
D)
114.5
C
A
The circle graph shows the results of the student council presidential election. The complete circular area represents 100%
of the votes.
62)
Student Council President
Lili
22%
Jim
35%Matt
17%
Gina
26%
300 total votes
The circle graph shows what percent of the vote each person received.
What percent of the votes did Matt NOT get?
62)
A)
83%
B)
65%
C)
17%
D)
74%
63)
Student Council President
Ben
25%
Lili
32%Ming
15%
Jim
28%
400 total votes
The circle graph shows what percent of the vote each person received.
Who received the second most number of votes?
63)
A)
Ming
B)
Lili
C)
Jim
D)
Ben
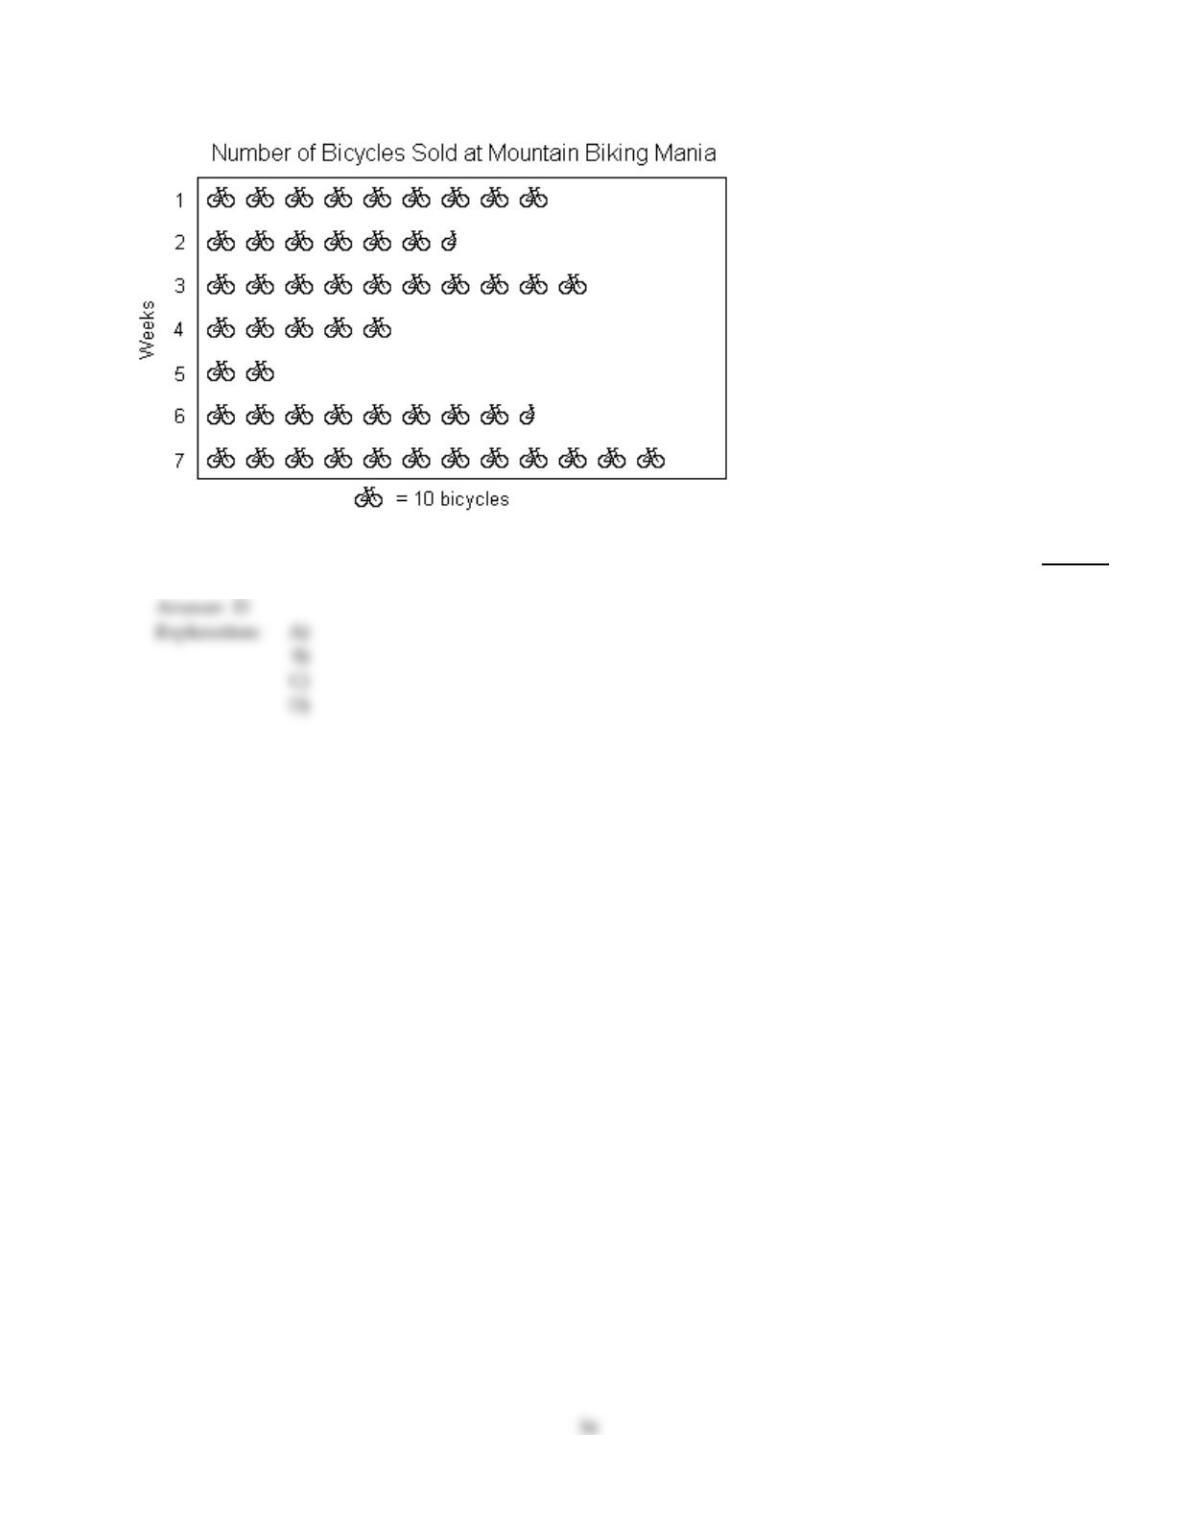
The pictograph shows the number of bicycles sold at Mountain Biking Mania for a 7–week period.
64)
How many bicycles were sold in week 7?
64)
A)
65 bicycles
B)
100 bicycles
C)
90 bicycles
D)
120 bicycles
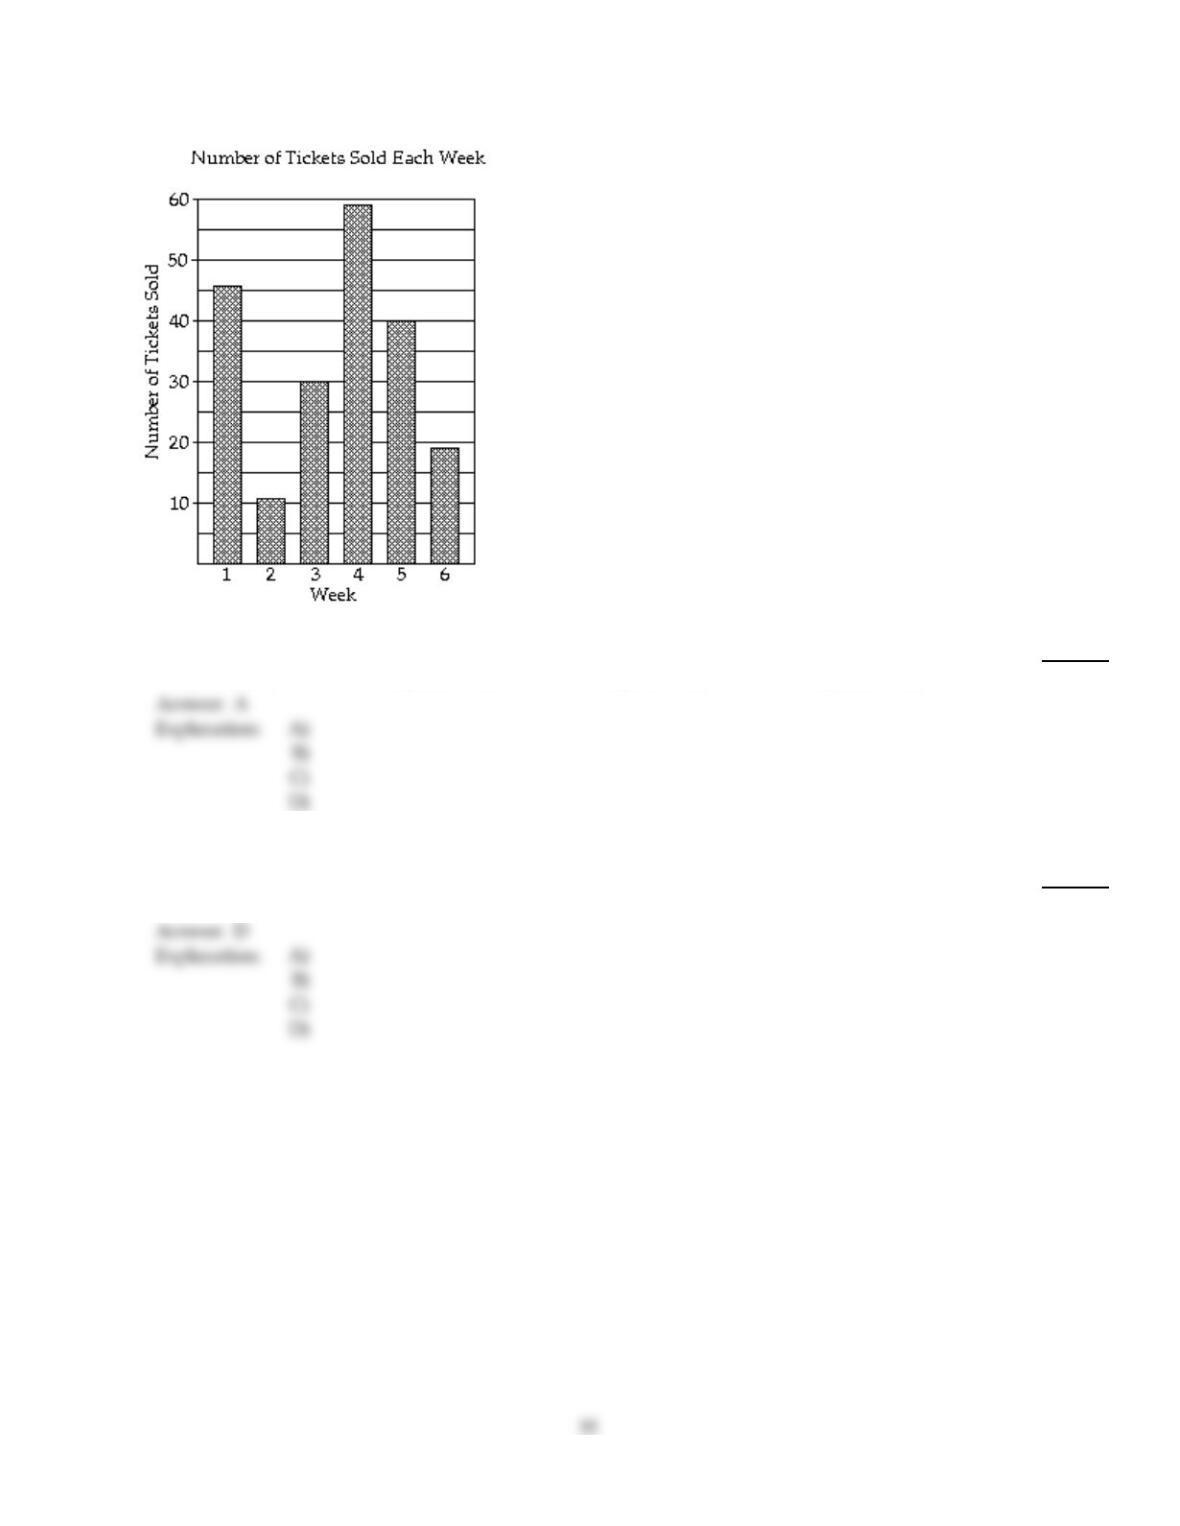
The bar graph shows the number of tickets sold each week by the garden club for their annual flower show.
65)
How many tickets were sold during week 4?
65)
A)
59 tickets
B)
19 tickets
C)
46 tickets
D)
40 tickets
Find the mean. If necessary, round to one decimal place.
66)
15, 10, 8, 14, 6, 1, 8
66)
A)
10.4
B)
8.4
C)
10.3
D)
8.9
D
A

The bar graph shows the number of tickets sold each week by the garden club for their annual flower show.
67)
How many tickets were sold in all?
67)
A)
205 tickets
B)
215 tickets
C)
105 tickets
D)
195 tickets
Find the median. If necessary, round to one decimal place.
68)
18, 19, 32, 59, 69, 73, 76
68)
A)
69
B)
49.9
C)
32
D)
59
The circle graph shows the results of the student council presidential election. The complete circular area represents 100%
of the votes.
69)
Student Council President
Ming
20%
Ben
35%Ann
15%
Matt
30%
200 total votes
The circle graph shows what percent of the vote each person received.
Who got the fewest votes?
69)
A)
Ben
B)
Ann
C)
Ming
D)
Matt
Solve. If necessary, round answers to the nearest hundredth.
70)
The following test scores were recorded for a student: 99, 58, 86, 58, 82. Find the mean, median, and
mode.
70)
A)
mean: 95.8 median: 84 mode: 58
B)
mean: 81.3 median: 86 mode: 99
C)
mean: 76.6 median: 82 mode: 99
D)
mean: 76.6 median: 82 mode: 58
Find the median. If necessary, round to one decimal place.
71)
5, 9, 26, 21, 31, 39
71)
A)
18.5
B)
26
C)
23.5
D)
21
Draw a tree diagram to find the number of possible outcomes.
72)
Toss two coins.
72)
A)
2 outcomes
B)
3 outcomes
C)
1 outcome
D)
4 outcomes
The line graph shows the recorded hourly temperatures in degrees Fahrenheit at an airport.
73)
At what time was the temperature the highest?
73)
A)
5 p.m.
B)
11 a.m.
C)
1 p.m.
D)
2 p.m.
C
D
Fill in the blank with one of the words or phrases listed below.
outcomes bar experiment mean tree diagram
pictograph line class interval median probability
histogram circle class frequency mode
74)
A(n) is a special bar graph in which the width of each bar represents a(n)
and the height of each bar represents the .
74)
A)
pictogram, class interval, class frequency
B)
histogram, class interval, class frequency
C)
pictogram, class frequency, class interval
D)
histogram, class frequency, class interval
Find the mean, median, and mode of the list of numbers. If necessary, round to the nearest tenth.
75)
80, 72, 68, 68, 80, 82
75)
A)
mean: 75 median: 68 mode: 82
B)
mean: 76 median: 76 mode: 68
C)
mean: 76 median: 75 mode: 80
D)
mean: 75 median: 76 mode: 68 and 80
D
B
The pictograph shows the number of bicycles sold at Mountain Biking Mania for a 7–week period.
76)
During which week was the greatest number of bicycles sold? How many bicycles were sold that
week?
76)
A)
week 3; 100 bicycles
B)
week 4; 50 bicycles
C)
week 7; 120 bicycles
D)
week 5; 20 bicycles
Suppose that the numbers 1 through 10 are each written on a scrap of paper and placed in a bag. You then select one
number from the bag.
77)
What is the probability of choosing a 2 or a 10 from the bag?
77)
A)
b
10
B)
1
10
C)
1
5
D)
6
5
Find the mode or modes (if any).
78)
62, 25, 62, 13, 25, 29, 56, 62
78)
A)
62
B)
41.8
C)
42.5
D)
no mode
Draw a tree diagram to find the number of possible outcomes.
79)
Pick a number from 1, 2, 3 or 4, and then toss a coin.
79)
A)
2 outcomes
B)
1 outcome
C)
8 outcomes
D)
6 outcomes
Find the probability of the event if a single choice is made from a bag.
80)
A bag contains 28 balls numbered 1 through 28. What is the probability of choosing a ball
numbered 29?
80)
A)
28
B)
1
C)
0
D)
1
28
Find the grade point average. If necessary, round to the nearest hundredth.
81)
Grade Credit Hours
B 4
D 3
F 3
C 4
D 4
81)
A)
18
B)
1.4
C)
3.6
D)
1.5
Fill in the blank with one of the words or phrases listed below.
outcomes bar experiment mean tree diagram
pictograph line class interval median probability
histogram circle class frequency mode
82)
A(n) is a graph in which pictures or symbols are used to visually present data.
82)
A)
tree diagram
B)
histogram
C)
class interval
D)
pictograph

The line graph shows the recorded hourly temperatures in degrees Fahrenheit at an airport.
83)
At what time was the temperature 77°?
83)
A)
2 p.m.
B)
11 a.m. and 12 p.m. and 3 p.m.
C)
11 a.m. and 12 p.m.
D)
12 p.m. and 3 p.m.
Solve. If necessary, round answers to the nearest hundredth.
84)
The following test scores were recorded for a student: 80, 77, 75, 74, 83, 79. Find the mean, median,
and mode.
84)
A)
mean: 79 median: none mode: 83
B)
mean: 78 median: 78 mode: none
C)
mean: 78 median: 74 mode: 83
D)
mean: 77 median: none mode: none
Find the median. If necessary, round to one decimal place.
85)
1, 1, 29, 18, 24, 48, 33, 32
85)
A)
26.5
B)
29
C)
23.5
D)
24
Find the mode or modes (if any).
86)
1.3, 0.4, 0.6, 1.3, 0.2, 1.5, 0.2, 1.6, 2
86)
A)
1.3
B)
0.2 and 1.3
C)
0.2
D)
1
Draw a tree diagram to find the number of possible outcomes.
87)
Toss a single die, and then toss a coin.
87)
A)
8 outcomes
B)
6 outcomes
C)
12 outcomes
D)
2 outcomes
Fill in the blank with one of the words or phrases listed below.
outcomes bar experiment mean tree diagram
pictograph line class interval median probability
histogram circle class frequency mode
88)
A(n) graph presents data using vertical or horizontal bars.
88)
A)
probability
B)
bar
C)
circle
D)
line
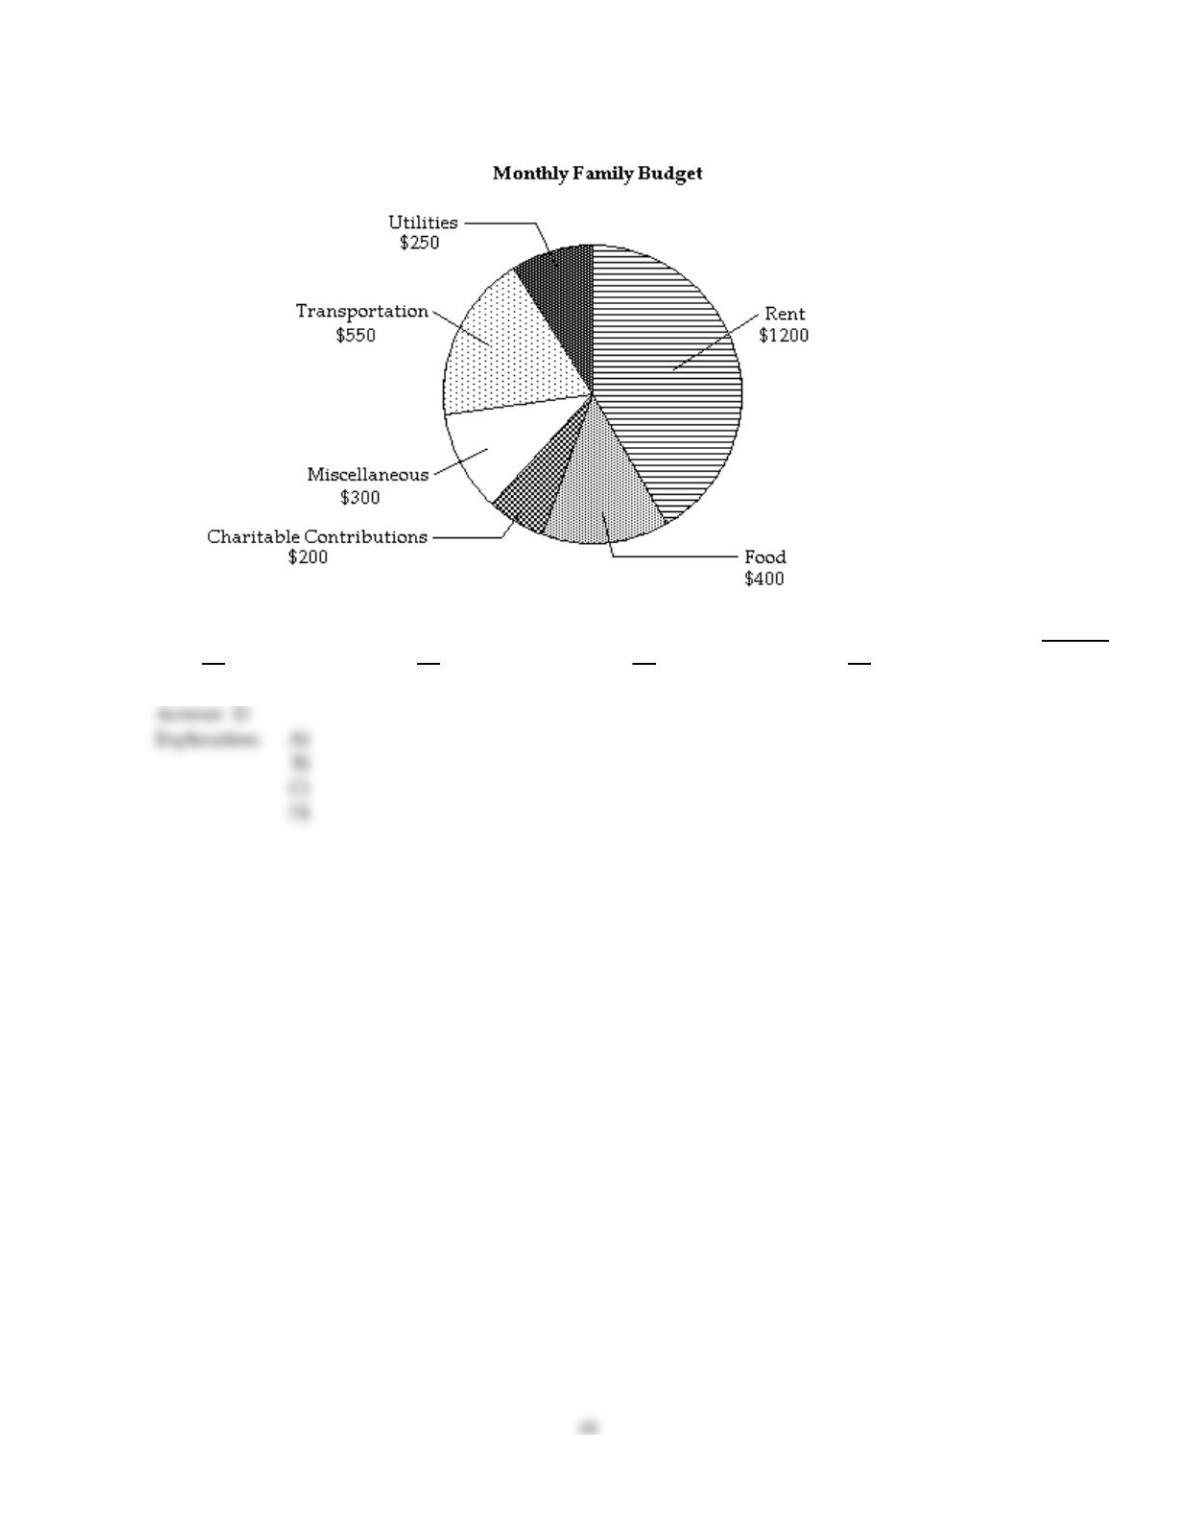
The following circle graph displays Chris and Mary Smith’s monthly $2900 family budget. Use the circle graph to answer
the question.
89)
What is the ratio of money spent on rent to money spent on utilities?
89)
A)
24
11
B)
5
24
C)
11
24
D)
24
5

The following pictograph shows the number of bicyclists who participated in the Labor Day weekend bicycle race for the
years 2003–2009. Use the graph to answer the question.
90)
In what years was there an increase in the number of cyclists who participated in the race?
90)
A)
2005, 2008, 2009
B)
2004, 2006, 2007
C)
2003, 2005, 2009
D)
2004, 2005, 2009
Draw a tree diagram to find the number of possible outcomes.
91)
Toss two six–sided dice.
91)
A)
2 outcomes
B)
1 outcome
C)
36 outcomes
D)
12 outcomes
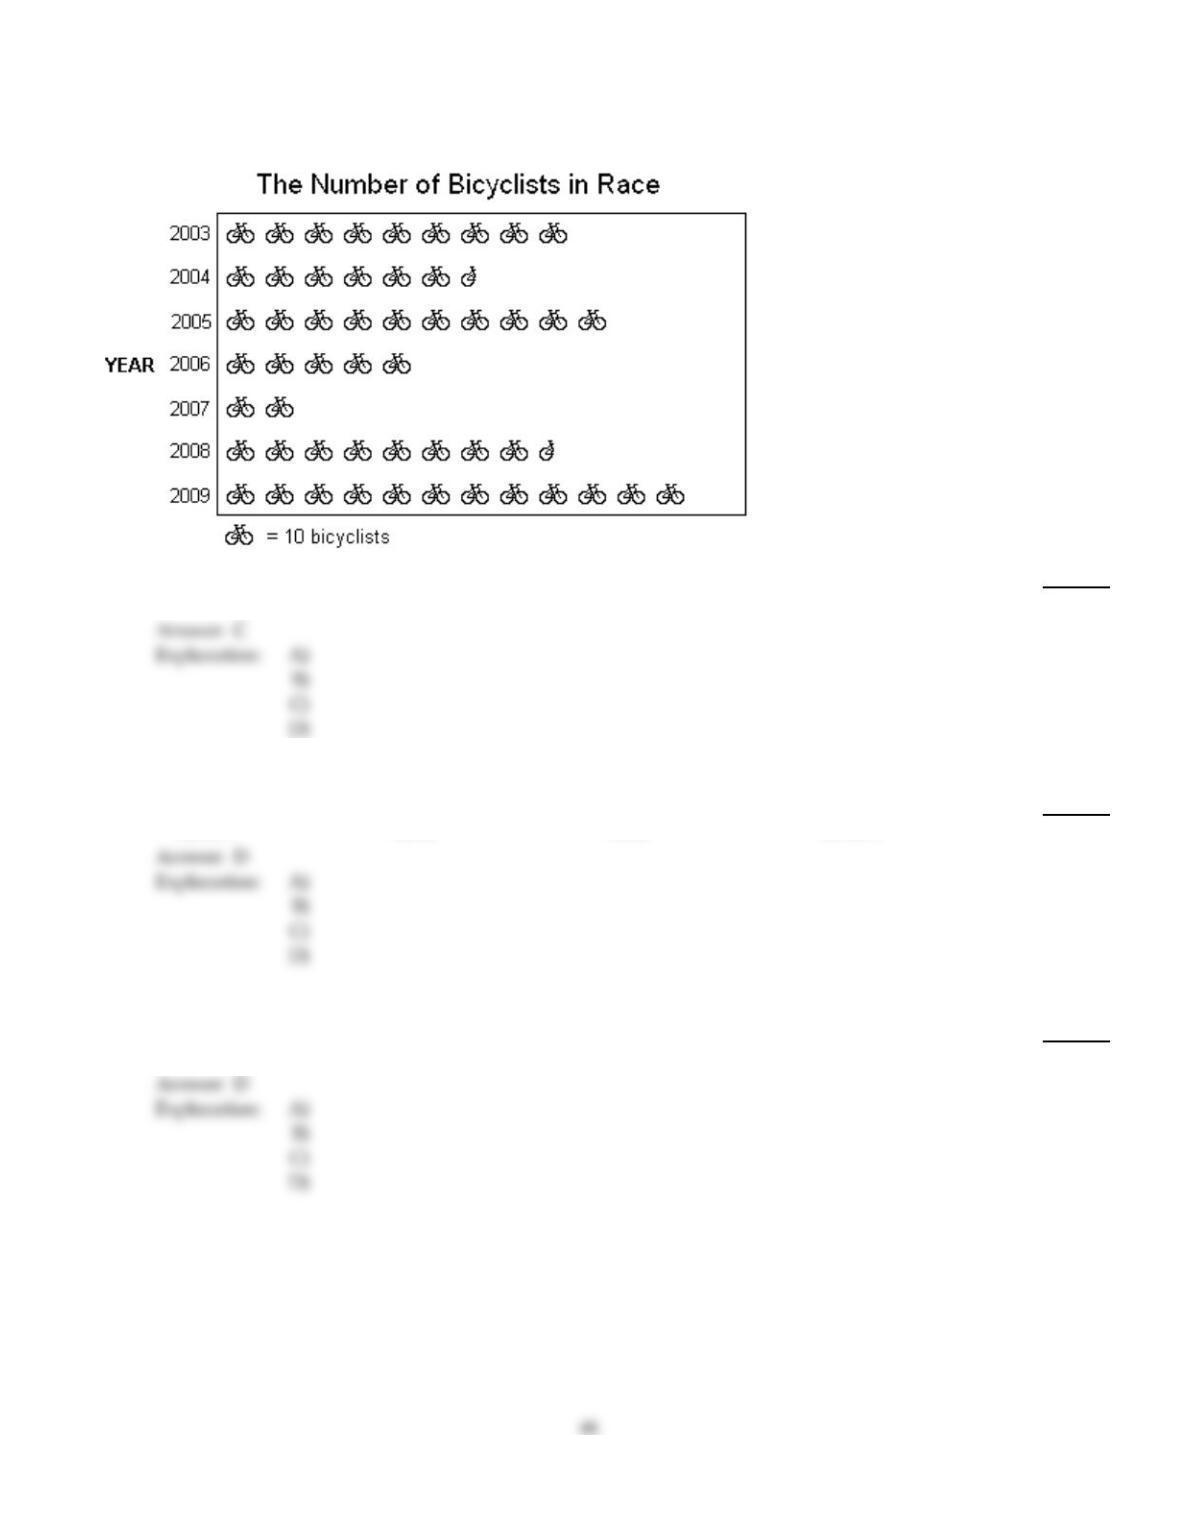
The following pictograph shows the number of bicyclists who participated in the Labor Day weekend bicycle race for the
years 2003–2009. Use the graph to answer the question.
92)
In what year did 100 cyclists participate?
92)
A)
2007
B)
2006
C)
2005
D)
2008
Find the median. If necessary, round to one decimal place.
93)
47, 14, 2, 2, 24, 13, 23, 32, 38, 38
93)
A)
23.3
B)
24
C)
23
D)
23.5
Find the mode or modes (if any).
94)
5, 9, 36, 3, 2, 8, 24, 1, 4, 16
94)
A)
8
B)
9
C)
10.2
D)
no mode
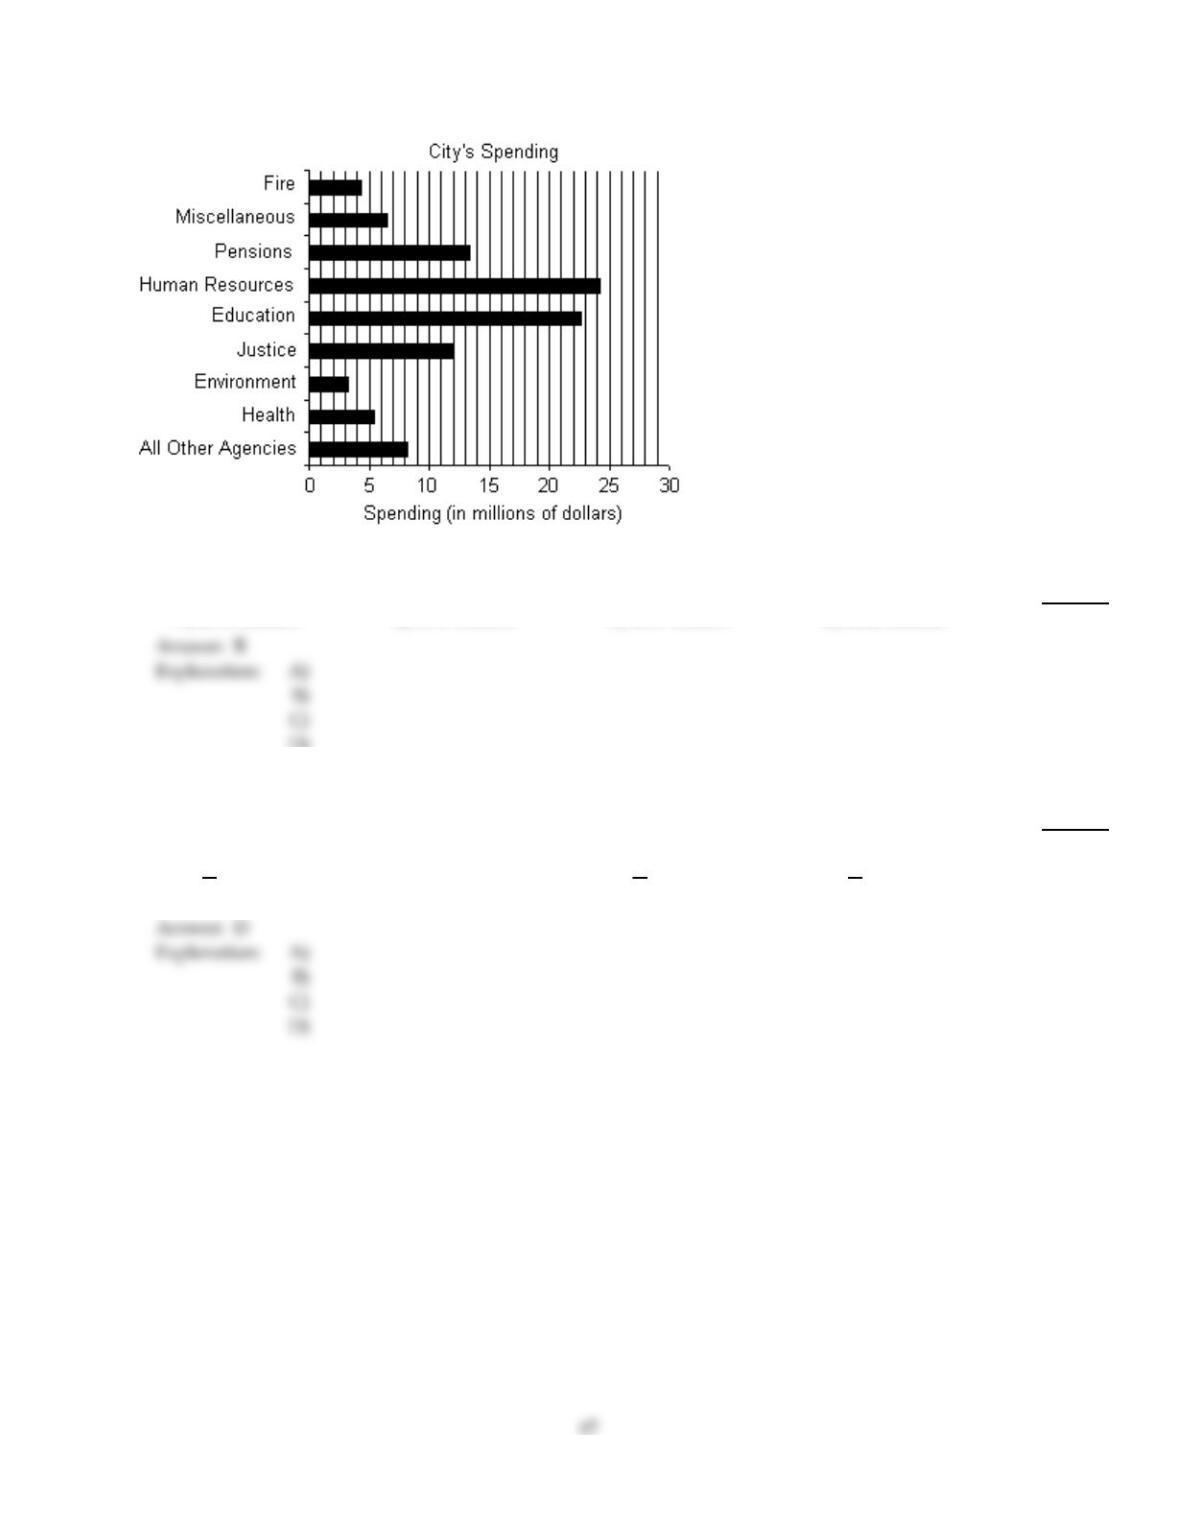
The bar graph shows the expenditures of one city government in a recent year.
95)
How much more is spent on Pensions than on Miscellaneous?
95)
A)
$9.8 million
B)
$6.9 million
C)
$8.5 million
D)
$5.2 million
D)
Find the probability of the event.
96)
If a single die is tossed once, find the probability of the following event.
A 1 or a 6
96)
A)
1
2
B)
7
C)
1
6
D)
1
3
D)
The following pictograph shows the number of bicyclists who participated in the Labor Day weekend bicycle race for the
years 2003–2009. Use the graph to answer the question.
97)
How many cyclists participated in 2004?
97)
A)
50 cyclists
B)
65 cyclists
C)
100 cyclists
D)
20 cyclists
Find the mean. If necessary, round to one decimal place.
98)
48, 17, 78, 36, 121, 100
98)
A)
67.2
B)
66.2
C)
66.7
D)
80
The following pictograph shows the number of bicyclists who participated in the Labor Day weekend bicycle race for the
years 2003–2009. Use the graph to answer the question.
99)
What was the least number of cyclists to participate in any one year?
99)
A)
50 cyclists
B)
100 cyclists
C)
120 cyclists
D)
20 cyclists
A deck of cards contains 52 cards. These cards consist of four suits (hearts, spades, clubs, and diamonds) of each of the
following: 2, 3, 4, 5, 6, 7, 8, 9, 10, jack, queen, king, and ace. If a card is chosen from a deck of cards, find the probability of
each event.
100)
Selecting a 6
100)
A)
1
52
B)
5
26
C)
1
13
D)
6
13
C
Draw a tree diagram to find the number of possible outcomes.
101)
Toss three coins.
101)
A)
6 outcomes
B)
3 outcomes
C)
1 outcome
D)
8 outcomes
D
D
Find the probability of the event if a single choice is made from a bag.
102)
A bag contains 5 red marbles, 7 blue marbles, 3 yellow marbles, and 6 green marbles. What is the
probability of choosing a red marble when one marble is drawn?
102)
A)
1
21
B)
5
16
C)
1
4
D)
5
21
The bar graph shows the number of students who flunk Dr. Jones’ class each year.
103)
During which year(s) did exactly 5 students flunk Dr. Jones’ class?
103)
A)
2001
B)
1995
C)
1993, 2001
D)
1995, 2001

The bar graph shows the number of tickets sold each week by the garden club for their annual flower show.
104)
During which week was the most number of tickets sold?
104)
A)
week 5
B)
week 2
C)
week 1
D)
week 4
Find the probability of the event.
105)
Two dice are tossed. What is the probability the sum of the two numbers on the die will be 3?
105)
A)
1
18
B)
1
2
C)
2
D)
17
18
The following pictograph shows the number of bicyclists who participated in the Labor Day weekend bicycle race for the
years 2003–2009. Use the graph to answer the question.
106)
In what year did the least number of cyclists participate?
106)
A)
2007
B)
1996
C)
2009
D)
1997
Solve. If necessary, round answers to the nearest hundredth.
107)
The grades are given for a student for a particular semester. Find the grade point average. The point
values of grades are given below.
A : 4, B : 3, C : 2, D : 1, F : 0
Grade Credit Hours
C 3
A 1
C 2
F 2
A 3
107)
A)
2.4
B)
2.2
C)
2.36
D)
11

The line graph shows the recorded hourly temperatures in degrees Fahrenheit at an airport.
108)
During which two hour period did the temperature increase the most?
108)
A)
10 a.m. to 12 p.m.
B)
9 a.m. to 11 a.m.
C)
12 p.m. to 2 p.m.
D)
10 a.m. to 11 a.m.
Find the probability of the event if a single choice is made from a bag.
109)
A bag contains 19 balls numbered 1 through 19. What is the probability of selecting a ball that has
an even number when one ball is drawn from the bag?
109)
A)
9
19
B)
19
9
C)
9
D)
2
19
A
Find the mean. If necessary, round to one decimal place.
110)
73, 50, 73, 96, 50
110)
A)
67.9
B)
85.5
C)
68.9
D)
68.4
D
B
Fill in the blank with one of the words or phrases listed below.
outcomes bar experiment mean tree diagram
pictograph line class interval median probability
histogram circle class frequency mode
111)
The of a set of an ordered set of numbers is the middle number.
111)
A)
mean
B)
median
C)
mode
D)
probability
The circle graph shows the results of the student council presidential election. The complete circular area represents 100%
of the votes.
112)
Student Council President
Ann
25%
Jim
32%Matt
16%
Gina
27%
700 total votes
The circle graph shows what percent of the vote each person received.
How many people voted for someone other than Gina?
112)
A)
511
B)
588
C)
189
D)
525
The line graph shows the recorded hourly temperatures in degrees Fahrenheit at an airport.
113)
What temperature was recorded at 1 p.m.?
113)
A)
77°F
B)
79°F
C)
81°F
D)
80°F
The circle graph summarizes the results of a survey of the favorite movie category chosen by a group of adults.
114)
1100 adults answer the survey.
Find the ratio of percent of respondents who favor comedies to those who favor action movies.
Write the ratio as a fraction with integers in the numerator and denominator.
114)
A)
737
61
B)
67
61
C)
61
67
D)
128
61
Find the probability of the event.
115)
If a single die is tossed once, find the probability of the following event.
A 5 or a 2 or a 4
115)
A)
1
2
B)
11
C)
1
6
D)
1
3
Find the probability of the event if a single choice is made from a bag.
116)
A bag contains 7 red marbles, 3 blue marbles, and 1 green marble. What is the probability of
choosing a marble that is not blue when one marble is drawn from the bag?
116)
A)
11
8
B)
8
11
C)
8
D)
3
11
Find the median. If necessary, round to one decimal place.
117)
8, 10, 13, 23, 39, 45, 47
117)
A)
23
B)
13
C)
26.9
D)
39

The bar graph shows the number of tickets sold each week by the garden club for their annual flower show.
118)
During which week were 11 tickets sold?
118)
A)
week 5
B)
week 4
C)
week 2
D)
week 3

The bar graph shows the number of students who flunk Dr. Jones’ class each year.
119)
During which year(s) did Dr. Jones’ have more than 10 students flunk his class?
119)
A)
1998, 2002
B)
1998, 1999
C)
2002
D)
1998, 1999, 2000
Fill in the blank with one of the words or phrases listed below.
outcomes bar experiment mean tree diagram
pictograph line class interval median probability
histogram circle class frequency mode
120)
A(n) is one way to picture and count outcomes.
120)
A)
class interval
B)
pictogram
C)
tree diagram
D)
histogram
A new car dealership has taken an inventory of the vehicles it has in stock. Below is a histogram indicating the number
of vehicles in stock in certain price ranges. Use the histogram to answer the question.
121)
How many vehicles in stock are priced between $21,000 and $27,999?
121)
A)
20 vehicles
B)
30 vehicles
C)
25 vehicles
D)
6 vehicles
The line graph shows the recorded hourly temperatures in degrees Fahrenheit at an airport.
122)
At what time was the temperature its lowest?
122)
A)
9 a.m.
B)
4 p.m.
C)
1 p.m.
D)
6 p.m.
Find the probability of the event.
123)
If a single die is tossed once, find the probability of the following event.
A 9
123)
A)
1
B)
0
C)
9
D)
9
6
The following pictograph shows the number of bicyclists who participated in the Labor Day weekend bicycle race for the
years 2003–2009. Use the graph to answer the question.
124)
Approximate the total number of cyclists who participated in 2007 and 2008.
124)
A)
100 cyclists
B)
110 cyclists
C)
95 cyclists
D)
105 cyclists
Fill in the blank with one of the words or phrases listed below.
outcomes bar experiment mean tree diagram
pictograph line class interval median probability
histogram circle class frequency mode
125)
The of a set of number items is sum of items
number of items.
125)
A)
median
B)
probability
C)
mode
D)
mean
126)
A(n) is an activity being considered, such as tossing a coin or rolling a die.
126)
A)
experiment
B)
pictogram
C)
mode
D)
tree diagram
Find the mean. If necessary, round to one decimal place.
127)
19, 9, 20, 14, 15, 5, 9, 13
127)
A)
14.9
B)
13
C)
32
D)
12
The circle graph shows the results of the student council presidential election. The complete circular area represents 100%
of the votes.
128)
Student Council President
John
25%
Jason
29%Claire
20%
Ben
26%
400 total votes
The circle graph shows what percent of the vote each person received.
What percent of the votes did John NOT get?
128)
A)
71%
B)
74%
C)
25%
D)
75%
129)
Student Council President
Ann
25%
Ted
29%Ming
20%
Jim
26%
500 total votes
The circle graph shows what percent of the vote each person received.
Who got the most votes?
129)
A)
Jim
B)
Ted
C)
Ann
D)
Ming
The bar graph shows the number of tickets sold each week by the garden club for their annual flower show.
130)
How many more tickets were sold during week 4 than week 2?
130)
A)
58 tickets
B)
70 tickets
C)
53 tickets
D)
48 tickets
Find the probability of the event.
131)
If a single die is tossed once, find the probability of the following event.
An odd number.
131)
A)
3
B)
1
3
C)
1
6
D)
1
2
Draw a tree diagram for the experiment to find the number of outcomes.
132)
Tossing a coin three times
132)
A)
2 outcomes
B)
16 outcomes
C)
32 outcomes
D)
8 outcomes
64
Fill in the blank with one of the words or phrases listed below.
outcomes bar experiment mean tree diagram
pictograph line class interval median probability
histogram circle class frequency mode
133)
A(n) graph displays information with a line that connects data points.
133)
A)
circle
B)
probability
C)
line
D)
bar
Answer Key
Testname: C9
Answer Key
Testname: C9
67
Answer Key
Testname: C9
68
Answer Key
Testname: C9
Answer Key
Testname: C9

Answer Key
Testname: C9
Answer Key
Testname: C9