Page 1
1.
A key input for measuring economic growth is:
A)
the size of the government’s budget.
B)
real GDP per capita.
C)
life expectancy.
D)
the Dow Jones stock market index.
2.
Which of the following is the most widely accepted measure of economic growth over
time?
A)
inflation
B)
increases in real per capita GDP
C)
decline in real interest rates
D)
increases in the available labor supply
3.
The best available measure of the standard of living in a country is:
A)
nominal GDP per capita.
B)
real GDP per capita.
C)
the unemployment rate.
D)
the growth rate of productivity.
4.
The key measure used to track economic growth is:
A)
real GDP per capita.
B)
nominal GDP.
C)
real GDP.
D)
nominal GDP per capita.
5.
If a country has a population of 1,000, an area of 100 square miles, and a GDP of $5
million, then its GDP per capita is:
A)
$500.
B)
$5,000.
C)
$50,000.
D)
$5 million.
6.
Real GDP per capita in the United States increased almost _____ times between 1900
and 2010.
A)
2
B)
3
C)
8
D)
10
Page 2
7.
Today, more than _____ of the world’s population lives in countries poorer than the
United States was a century ago.
A)
one-fifth
B)
one-third
C)
one-half
D)
two-fifths
8.
A typical family in the United States in 1900 had a purchasing power equal to _____ of
the real U.S. GDP per capita in 2010.
A)
1%
B)
13%
C)
70%
D)
136%
9.
Output per capita in the United States in 2010 was about _____ as high as in 1900.
A)
twice
B)
3 times
C)
8 times
D)
10 times
10.
In the popular press we see many pictures of affluent people in Indian cities. Yet the
average person in India today is poorer than the average person in the United States was
in:
A)
2000.
B)
1970.
C)
1950.
D)
1900.
11.
The standard of living in a country can be best measured by:
A)
nominal GDP per capita.
B)
real GDP per capita.
C)
the productivity growth rate.
D)
the business cycles.
12.
The _____in an economy whose aggregate real output is growing faster than the total
population.
A)
real GDP per capita is rising
B)
standard of living is declining
C)
national income is falling
D)
nominal GDP per capita is decreasing
Page 3
13.
Economists use real GDP per capita to measure economic growth:
A)
because it ignores the effect of price changes.
B)
because poor nations have a large population and the population of richer nations is
declining.
C)
because it is the inflation-adjusted value of a country’s production of goods and
services corrected for the change in a country’s population.
D)
even though nominal GNP per capita is a far superior measure of economic growth.
Use the following to answer questions 14-15:
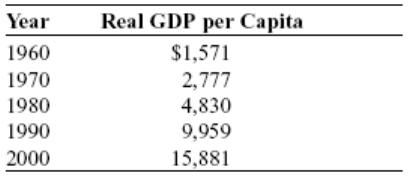
Table: South Korea’s Real GDP per Capita
14.
(Table: South Korea’s Real GDP per Capita) Look at the table South Korea’s Real GDP
per Capita. As a percentage of real GDP per capita in 1960, approximately how much
did South Korea produce in 2000?
A)
10%
B)
15%
C)
151%
D)
1,011%
15.
(Table: South Korea’s Real GDP per Capita) Look at the table South Korea’s Real GDP
per Capita. As a percentage of real GDP per capita in 2000, approximately how much
did South Korea produce in 1960?
A)
10%
B)
15%
C)
151%
D)
1,011%
Page 4
16.
China has much higher rate of growth than the United States, but the average Chinese
household is _____ a typical U.S. household. China’s real GDP per capita is _____ that
of the United States.
A)
as well off as; catching up with
B)
richer than; much higher than
C)
still a bit poorer than; catching up with
D)
still far poorer than; much lower than
17.
U.S. real GDP per capita in 2010 was _____ as much per person as in 1900.
A)
16%
B)
129%
C)
46%
D)
758%
18.
Suppose a panel of economists predicts that a nation’s real GDP per capita will double in
approximately 20 years. According to the rule of 70, what must be the predicted annual
growth rate of real GDP per capita?
A)
140%
B)
3.5%
C)
2.85%
D)
14%
19.
Suppose a panel of economists predicts that a nation’s real GDP per capita will have an
average annual growth rate of 2%. According to the rule of 70, how many years will it
take for this nation’s real GDP per capita to double?
A)
35
B)
70
C)
140
D)
20
20.
The rule of 70 indicates that a 6% annual increase in the level of real GDP would lead to
the output doubling in approximately _____ years.
A)
6
B)
12
C)
24
D)
30
Page 5
21.
The rule of 70 states that a variable’s approximate doubling time equals:
A)
70 times the growth rate.
B)
the growth rate divided by 70.
C)
70 divided by the doubling time.
D)
70 divided by the growth rate.
22.
The formula for the rule of 70, where n is number of years and r is growth rate, is
expressed as:
A)
n × 70 = r.
B)
n / r = 70.
C)
r / n = 70.
D)
n × r = 70.
23.
The rule of 70 is most useful in:
A)
identifying the causes of economic growth.
B)
identifying the sources of economic growth.
C)
estimating the productivity of labor.
D)
estimating the doubling time of real GDP for a given growth rate.
24.
If real GDP grows at an annual rate of 1%, it will double in approximately _____ years.
A)
11
B)
23
C)
35
D)
70
25.
If real GDP grows at an average rate of 3% per year, it will double in approximately
_____ years.
A)
less than 10
B)
20
C)
23
D)
36
26.
If real GDP doubles in 35 years, its average annual growth rate is approximately:
A)
1%.
B)
2%.
C)
3%.
D)
4%.
Page 6
27.
If real GDP doubles in 12 years, its average annual growth rate is approximately:
A)
6%.
B)
5%.
C)
4%.
D)
3%.
Use the following to answer questions 28-31:
Scenario: Growth Rates in Two Countries
India is growing at a rate of 9% per year, and its real GDP per capita is about $3,500, while the
United States is growing at a rate of 3% per year, and its real GDP per capita is about $47,000.
28.
(Scenario: Growth Rates in Two Countries) Look at the scenario Growth Rates in Two
Countries. How long will it take India to double its real GDP per capita?
A)
7.8 years
B)
10.2 years
C)
14.6 years
D)
90 years
29.
(Scenario: Growth Rates in Two Countries) Look at the scenario Growth Rates in Two
Countries. How long will it take the United States to double its real GDP per capita?
A)
10.5 years
B)
23.3 years
C)
30 years
D)
50 years
30.
(Scenario: Growth Rates in Two Countries) Look at the scenario Growth Rates in Two
Countries. About how much will India’s real GDP per capita be in 20 years?
A)
$19,600
B)
$56,000
C)
$14,000
D)
$28,000
31.
(Scenario: Growth Rates in Two Countries) Look at the scenario Growth Rates in Two
Countries. About how much will U.S. real GDP per capita be in 14 years?
A)
$71,000
B)
$28,000
C)
$112,000
D)
$224,000
Page 7
Use the following to answer questions 32-35:
Scenario: Growth Rates
Suppose that real GDP per capita of the United States is $32,000 and its growth rate is 2% per
year. Real GDP per capita of China is $4,000, and its annual growth rate is 7%.
32.
(Scenario: Growth Rates) Look at the scenario Growth Rates. How long will it take real
GDP per capita of the United States to double?
A)
35 years
B)
50 years
C)
2.25 years
D)
14 years
33.
(Scenario: Growth Rates) Look at the scenario Growth Rates. How long will it take
China’s real GDP per capita to double?
A)
14 years
B)
10 years
C)
35 years
D)
50 years
34.
(Scenario: Growth Rates) Look at the scenario Growth Rates. How many years will it
take for China’s real GDP per capita to be larger than real GDP per capita in the United
States?
A)
70 to 75 years
B)
40 to 45 years
C)
15 to 20 years
D)
5 to 10 years
35.
(Scenario: Growth Rates) Look at the scenario Growth Rates. According to the rule of
70, how large will China’s real GDP per capita be in 20 years?
A)
$5,600
B)
$8,000
C)
$16,000
D)
$28,000
Page 8
36.
The rule of 70 states that:
A)
the average score on standardized tests is normally distributed with a mean of 70
and a standard deviation of 10.
B)
everyone should retire by age 70.
C)
the number of years for a variable to double equals 70 divided by its annual growth
rate.
D)
Social Security benefits should increase when people reach 70.
37.
If output is growing at 5% annually, how many years will it take for output to
quadruple?
A)
14 years
B)
10 years
C)
20 years
D)
28 years
38.
Real GDP per capita, growing at a constant rate over a 35-year period, has doubled at
the end of that period. What must the annual growth rate of real GDP per capita be for
this economy?
A)
1%
B)
2%
C)
4%
D)
15%
39.
If real GDP per capita grows at 5% per year consistently over time, how many years
will it take for it to double?
A)
5
B)
10
C)
14
D)
70
40.
There are two countries on a peninsula. The first has a per capita annual growth rate of
2%, and its neighbor to the south has an annual growth rate of 5%. How much sooner
will the country in the south double its GDP per capita than its neighbor in the north?
A)
5 years
B)
10 years
C)
15 years
D)
21 years
Page 9
41.
According to the rule of 70, if a country doubles its real GDP per capita every 20 years,
that country must be growing at an annual rate of:
A)
2%.
B)
3.5%.
C)
35%.
D)
70%.
42.
According to the rule of 70, if a country’s real GDP per capita grows at an annual rate of
2% instead of 3%, it will take _____ additional years for that country to double its level
of real GDP per capita.
A)
35
B)
11.67
C)
23.3
D)
30
43.
To find the approximate number of years it takes the economy to double:
A)
divide its growth rate by 70.
B)
divide 70 by its growth rate.
C)
divide its growth rate by 100.
D)
multiply its growth rate by 20.
44.
According to the rule of 70, if real GDP per capita is growing at 2% a year, in 100 years
it will have increased by:
A)
about 4 times.
B)
about 7 times.
C)
almost 30 times.
D)
almost 60 times.
45.
The Rule of 70 applies:
A)
only to GDP.
B)
only to GDP per capita.
C)
to any growth rate.
D)
only to developed countries.
46.
Which country had the fastest growth rate of real GDP per capita between 1980 and
2010?
A)
the United States
B)
Ireland
C)
China
D)
France
Page 10
47.
Which country had the lowest growth rate of real GDP per capita between 1980 and
2010?
A)
Ireland
B)
France
C)
Argentina
D)
Zimbabwe
48.
From 2010 to 2011 nation A’s real GDP increased from $100 billion to $106 billion and
its population grew from 50 million to 51 million. As a result real GDP per capita
_____, because it rose _____ than the population.
A)
increased; more slowly
B)
increased; faster
C)
decreased; more slowly
D)
decreased; faster
49.
From 2010 to 2011 nation A’s real GDP increased from $100 billion to $106 billion and
its population grew from 50 million to 51 million. Its annual growth rate in real GDP
per capita was approximately:
A)
1%.
B)
–3%.
C)
4%.
D)
6%.
Use the following to answer questions 50-54:
50.
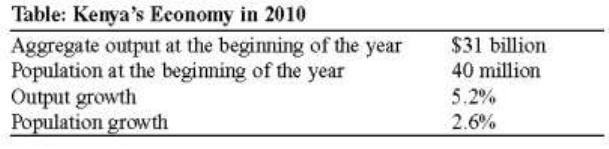
(Table: Kenya’s Economy in 2010) Look at the table Kenya’s Economy in 2010.
Aggregate output per capita at the beginning of 2010 was:
A)
$5,000.
B)
$10,000.
C)
$775.
D)
$7,750.
Page 11
51.
(Table: Kenya’s Economy in 2010) Look at the table Kenya’s Economy in 2010.
Aggregate output at the end of 2010, assuming no changes in the price level, was about:
A)
$326 billion.
B)
$32.632 billion.
C)
$3,635 billion.
D)
$6,500 billion.
52.
(Table: Kenya’s Economy in 2010) Look at the table Kenya’s Economy in 2010. The
population at the end of 2010 was about:
A)
400 million.
B)
41 million.
C)
14 million.
D)
401 million.
53.
(Table: Kenya’s Economy in 2010) Look at the table Kenya’s Economy in 2010.
Aggregate output per capita at the end of 2010, assuming no changes in the price level,
was:
A)
$7,000.
B)
$7,005.
C)
$795.
D)
$7,490.
54.
(Table: Kenya’s Economy in 2010) Look at the table Kenya’s Economy in 2010. During
2010, assuming no changes in the price level, aggregate output per capita in Kenya grew
at a rate of:
A)
0.6%.
B)
2.6%.
C)
5.2%.
D)
7.8%.
55.
Economists say that long-run economic growth is almost entirely due to:
A)
rising productivity.
B)
population growth.
C)
a democratically elected government.
D)
a balanced budget.
Page 12
56.
Long-run economic growth depends almost entirely on:
A)
labor productivity growth.
B)
population growth.
C)
agricultural production growth.
D)
the number of hours worked.
57.
Productivity is declining when:
A)
the number of hours worked exceeds the number of workers.
B)
population growth exceeds real GDP growth.
C)
the ratio of adult civilians employed outside the home rises.
D)
real GDP growth exceeds the population growth.
58.
Productivity is equal to:
A)
real GDP divided by the number of workers.
B)
real GDP divided by the population.
C)
the number of workers per machine.
D)
the total output produced.
59.
Over the course of the twentieth century, real GDP per capita in the United States rose
mostly as a result of:
A)
rising population.
B)
rising employment.
C)
rising productivity.
D)
reduced vacation time.
60.
Which of the following changes would contribute to a nation’s rapid long-run economic
growth?
A)
faster technological progress
B)
faster population growth
C)
less physical capital per worker
D)
lower levels of average human capital
61.
Labor productivity growth can be attributed to:
A)
improvement in technology.
B)
a decline in university attendance.
C)
an increase in population growth.
D)
a decline in the physical capital per worker.
Page 13
62.
The term human capital describes improvement:
A)
made possible by better machines and equipment.
B)
in the technology available to the work force.
C)
in a worker’s skills made possible by education, training, and knowledge.
D)
in the robotics technology that can substitute for a human worker.
63.
The most important driver for economic growth appears to be:
A)
increases in physical capital.
B)
increases in human capital.
C)
technological progress.
D)
foreign investment.
64.
Human capital is:
A)
the improvement in labor made possible by education and knowledge that is
embodied in the workforce.
B)
the machinery and tools that each worker owns.
C)
robots that can perform tasks that only humans could do in the past.
D)
not as important as physical capital.
65.
Which of the following will NOT increase the productivity of labor?
A)
technological improvements
B)
an increase in the capital stock
C)
improvements in education
D)
an increase in the size of the labor force
66.
Which of the following will NOT increase labor’s productivity?
A)
education
B)
technology
C)
new capital
D)
growth in the population
67.
Human capital refers to:
A)
output per worker.
B)
the education and knowledge embodied in the workforce.
C)
society’s investment in capital goods.
D)
people working with capital goods.
Page 14
68.
The skills, training, and education possessed by workers that contribute to economic
growth are known as:
A)
saving.
B)
human capital.
C)
natural resources.
D)
output of labor.
69.
The improvement in labor made possible by education and knowledge that is embodied
in the work force is known as _____ capital.
A)
physical
B)
human
C)
financial
D)
real
70.
For developed countries, which of the following is considered the most important driver
in productivity growth?
A)
the level of educational attainment
B)
the amount of physical capital
C)
technological progress
D)
the abundance of natural resources
71.
All of the following are factors that drive productivity growth EXCEPT:
A)
growth convergence.
B)
physical capital.
C)
technological progress.
D)
human capital.
72.
Rising high school graduation rates are an example of an increase in:
A)
technological progress.
B)
human capital.
C)
population stock.
D)
fertility rates.
73.
Technological progress allows workers to produce more:
A)
because it increases the amount of physical capital available.
B)
because it increases the amount of human capital available.
C)
even when the amount of physical capital and human capital do not change.
D)
only if the amount of physical capital grows at the same rate.
Page 15
74.
All of the following are reasons average workers in the United States today produce
more than their counterparts a century ago EXCEPT that the modern worker:
A)
is better educated.
B)
has more physical capital to work with.
C)
has better technology to work with.
D)
works longer hours.
75.
An example of physical capital is:
A)
a truck a company purchases for deliveries.
B)
a worker who physically learns to work on a truck his company buys.
C)
a truck a worker buys for personal use.
D)
a truck a company purchases for work, a worker who physically learns to work on
a truck his company buys, or a truck a worker buys for personal use.
76.
If technology advances:
A)
more output can be obtained from the same inputs.
B)
more inputs are needed to produce the same output.
C)
less output can be obtained from the same inputs.
D)
less output can be produced even with more inputs.
77.
Workers today are more productive than workers in the past because:
A)
they now are physically stronger on average.
B)
they now have more physical capital embodying better technology.
C)
more of them use the same number of machines as in the past.
D)
they are paid more.
78.
Physical capital includes:
A)
a worker’s education or knowledge.
B)
machine tools.
C)
money.
D)
shares of stock.
79.
An example of human capital is a person’s:
A)
money.
B)
job skills.
C)
capital goods or machines.
D)
stocks and bonds.
Page 16
80.
If technology advances:
A)
GDP per capita declines.
B)
physical capital is less productive.
C)
workers can produce more with fixed amounts of physical and human capital.
D)
human capital is less useful.
81.
To acquire human capital a person would:
A)
save to buy a printing press.
B)
purchase a printing press rather than a very large television.
C)
learn to use a printing press.
D)
sell the books that the printing press produces.
82.
Workers are more productive than in the past because they:
A)
have more natural resources to use.
B)
work a four-day week.
C)
are better educated and so have more human capital.
D)
are physically larger than their parents.
83.
Which sector is responsible for most of the growth in the United States during the
1990s?
A)
service
B)
manufacturing
C)
mining
D)
retail
84.
According to the text, productivity is driven by all of the following EXCEPT:
A)
physical capital.
B)
human capital.
C)
technological progress.
D)
natural resources.
85.
Which of the following does NOT qualify as physical capital?
A)
shovel
B)
factory
C)
backhoe
D)
mineral deposits
Page 17
86.
The aggregate production function does NOT depend on:
A)
the quantity of physical capital per worker.
B)
human capital per worker.
C)
the state of technology.
D)
the amount of natural resources.
87.
Diminishing returns to physical capital implies that when the human capital per worker
and the state of technology remain fixed, each successive increase in physical capital
leads to _____ productivity.
A)
a smaller increase in
B)
a larger increase in
C)
a decrease in
D)
negative
88.
During the latter half of the twentieth century, the Soviet Union made more physical
capital available to its workers, but this increase resulted in successively smaller
increases in productivity. This is an example of:
A)
diminishing returns to human capital.
B)
a decline in technology.
C)
a declining standard of living.
D)
diminishing returns to physical capital.
89.
Investment in human capital shifts the aggregate production function:
A)
downward.
B)
leftward.
C)
upward.
D)
rightward.
90.
The aggregate production function exhibits _____ returns to physical capital.
A)
diminishing
B)
constant
C)
increasing
D)
negative
Page 18
91.
An increase in the amount of physical capital per worker _____, while technological
progress _____.
A)
makes the aggregate production function steeper; changes the slope of the
aggregate production function
B)
makes the aggregate production function steeper; makes the aggregate production
function flatter
C)
moves the economy along the aggregate production function; shifts up the
aggregate production function
D)
shifts up the aggregate production function; moves the economy along the
aggregate production function
92.
Diminishing returns to physical capital means that when the amount of human capital
per worker and the state of technology are held fixed, each increase in the amount of
physical capital per worker leads to:
A)
a smaller increase in the marginal product of labor.
B)
a decrease in the total amount of output.
C)
negative marginal product.
D)
a constant amount of total output.
93.
Which of the following accurately describes what is happening along a typical aggregate
production function?
A)
At some point, increasing the amount of physical capital per worker will reduce
productivity.
B)
Increases in physical capital per worker will always bring about an increase in
productivity that is worth the cost of the additional physical capital.
C)
Because of diminishing returns, increasing the amount of physical capital per
worker will eventually bring smaller and smaller increases in productivity.
D)
Adding workers results in real GDP per worker rising at an increasing rate
throughout the function.
Use the following to answer question 94:
Table: Hypothetical Relationship
Page 19
94.
(Table: Hypothetical Relationship) Look at the table Hypothetical Relationship. This
economy is undergoing:
A)
increasing returns to physical capital per worker.
B)
decreasing total productivity.
C)
constant total productivity.
D)
diminishing returns to physical capital per worker.
95.
Because of diminishing returns to capital, doubling the amount of physical capital
available for one worker to use will _____ output by _____ a factor of two.
A)
decrease; less than
B)
increase; less than
C)
increase; exactly
D)
increase; more than
96.
Diminishing returns to physical capital means that as more and more physical capital is
combined with a fixed amount of human capital and a fixed technology, eventually:
A)
aggregate output or real GDP declines.
B)
aggregate output or real GDP grows.
C)
additions to aggregate output or real GDP decline.
D)
additions to aggregate output or real GDP increase.
97.
Growth accounting estimates the:
A)
increase in the population rate over time.
B)
increase in the inflation rate over time.
C)
contribution of each major factor in the aggregate production function to economic
growth.
D)
contribution of the technology factor in the aggregate production function to
economic growth.
Page 20
Use the following to answer questions 98-99:
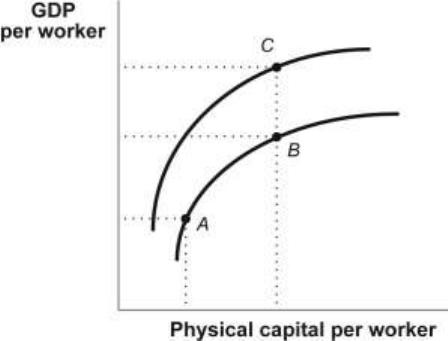
Figure: Productivity
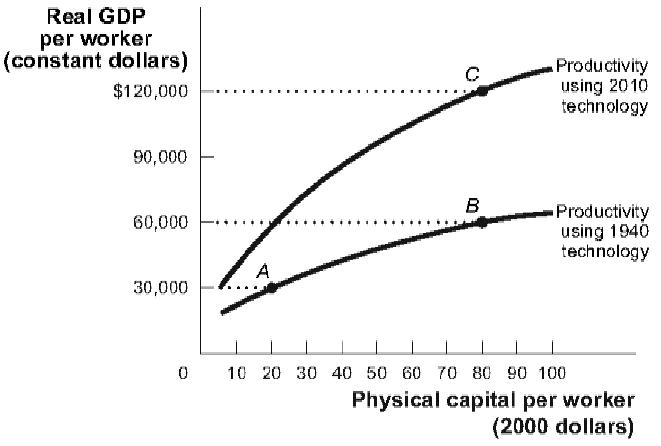
98.
(Figure: Productivity) Look at the figure Productivity. An improvement in technology
with everything else remaining unchanged is shown on the diagram as a movement
from:
A)
B to A.
B)
A to B.
C)
B to C.
D)
A to C.
99.
(Figure: Productivity) Look at the figure Productivity. An increase in physical capital
per worker with everything else remaining unchanged is shown on the diagram as a
movement from:
A)
B to C.
B)
A to C.
C)
A to B.
D)
B to A.
Use the following to answer questions 100-101:
Scenario: The Aggregate Production Function
Holding the human capital per worker and technology unchanged, the estimated aggregate
production function in Jamaica is Y / L = 50 × K / L, where Y = real output, L = number of
workers, and K = quantity of physical capital.

Page 21
100.
(Scenario: The Aggregate Production Function) Look at the scenario The Aggregate
Production Function. If K / L = $81, then real GDP per worker is:
A)
$4,050.
B)
$4,000.
C)
$4,096.
D)
$40,500.
101.
(Scenario: The Aggregate Production Function) Look at the scenario The Aggregate
Production Function. If real GDP per worker equals $3,200, physical capital per worker
equals:
A)
$81.
B)
$64.
C)
$49.
D)
$100.
Use the following to answer questions 102-104:
Figure: Technological Progress and Productivity Growth
Page 22
102.
(Figure: Technological Progress and Productivity Growth) Look at the figure
Technological Progress and Productivity Growth. If there is a significant increase in
human capital per worker (all other factors remaining unchanged), it is best indicated by
a move from:
A)
A to B.
B)
B to A.
C)
C to B.
D)
B to C.
103.
(Figure: Technological Progress and Productivity Growth) Look at the figure
Technological Progress and Productivity Growth. If there is an increase in physical
capital per worker (all other factors remaining unchanged), it is best indicated by a
move from:
A)
A to B.
B)
B to A.
C)
C to B.
D)
B to C.
104.
(Figure: Technological Progress and Productivity Growth) Look at the figure
Technological Progress and Productivity Growth. If there is significant technological
progress (all other factors remaining unchanged), it is best indicated by a move from:
A)
A to B.
B)
B to A.
C)
C to B.
D)
B to C.
105.
Growth accounting enables us to:
A)
calculate how long it takes the economy to grow.
B)
calculate the effects of technological progress on economic growth.
C)
compare growth rates across countries.
D)
better calculate real GDP per capita.
106.
An increase in capital stock would:
A)
shift the production function upward.
B)
shift the production function inward.
C)
shift the production function downward.
D)
cause a movement to the right along a stationary production function.
Page 23
107.
Which of the following would shift the production function upward?
A)
an increase in the price of oil
B)
an improvement in technology
C)
a decrease in the supply of labor
D)
a decline in the birth rate
108.
The aggregate production function measures productivity as:
A)
real GDP per worker.
B)
nominal GDP per worker.
C)
median income per worker.
D)
average disposable income.
109.
The aggregate production function exhibits _____ returns to _____ capital.
A)
increasing; physical
B)
decreasing; physical
C)
constant; physical
D)
increasing; financial
Use the following to answer questions 110-115:
Scenario: Productivity
The economy has grown by 4% per year over the past 30 years. During the same period the labor
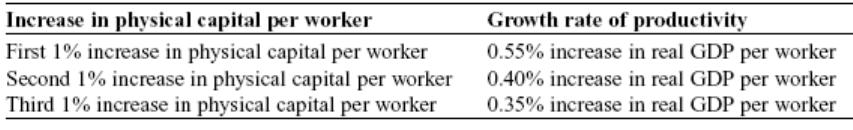
force has grown by 1% per year and the quantity of physical capital has grown by 5% per year.
Each 1% increase in physical capital per worker is estimated to increase productivity by 0.4%.
Assume that human capital has not changed during the past 30 years.
110.
(Scenario: Productivity) Look at the scenario Productivity. What is the growth rate of
productivity?
A)
5%
B)
4%
C)
3%
D)
1.6%
111.
(Scenario: Productivity) Look at the scenario Productivity. How fast has physical capital
per worker grown?
A)
5%
B)
4%
C)
3%
D)
2%
Page 24
112.
(Scenario: Productivity) Look at the scenario Productivity. How much has growing
physical capital per worker contributed to productivity growth?
A)
6%
B)
5.4%
C)
2%
D)
1.6%
113.
(Scenario: Productivity) Look at the scenario Productivity. How much has growing
physical capital per worker contributed as a percentage of total productivity growth?
A)
80%
B)
53%
C)
30%
D)
9%
114.
(Scenario: Productivity) Look at the scenario Productivity. How much has technological
progress contributed to productivity growth?
A)
1.4%
B)
1.6%
C)
2%
D)
3%
115.
(Scenario: Productivity) Look at the scenario Productivity. How much has technological
progress contributed as a percentage of productivity growth?
A)
20%
B)
47%
C)
53%
D)
91%
116.
Which of the following countries is NOT characterized by abundant farmland and
mineral deposits?
A)
United States
B)
Canada
C)
Argentina
D)
Japan
Page 25
117.
In 1798, the English economist Thomas Malthus predicted that:
A)
countries with a large supply of natural resources would always enjoy economic
growth.
B)
the recently independent United States would rejoin the British empire out of
economic necessity.
C)
the French Revolution would improve the economies of most European countries.
D)
rising population growth would cause productivity per capita to fall.
118.
According to Thomas Malthus’s work, which of the following is TRUE?
A)
As population grew, so would output per worker.
B)
The amount of capital per worker would fall.
C)
Technology could be counted on to increase output per worker.
D)
The amount of land per worker would eventually decline.
119.
In 1798, the Essay on the Principle of Population was published by:
A)
Adam Smith.
B)
Karl Marx.
C)
Thomas Malthus.
D)
David Ricardo.
120.
The fundamental argument in the Essay on the Principle of Population was that
improvements in technology or increases in physical capital would lead to only
temporary improvements in productivity because they would always be offset by:
A)
rising human capital demands.
B)
falling land values.
C)
the pressure of rising population and more workers on the supply of land.
D)
falling birthrates.
121.
Natural resources are:
A)
more important determinants of productivity today than ever before.
B)
the reason behind the fast development of countries like Japan.
C)
the reason behind the slow development of countries like Nigeria.
D)
less reliable indicators of productivity today than they were a century ago.
122.
The main source of Kuwait’s wealth is _____, while the main source of Germany’s
wealth is_____ .
A)
oil; manufacturing
B)
manufacturing; oil
C)
tourism; manufacturing
D)
information technology; tourism
Page 26
123.
Before the twentieth century, the most important determinant of productivity was:
A)
technology.
B)
natural resources.
C)
physical capital.
D)
human capital.
124.
In the long run, an increase in saving will generally:
A)
reduce the rate of economic growth.
B)
leave the rate of economic growth unchanged.
C)
increase the rate of economic growth.
D)
increase consumption simultaneously.
125.
Economic growth is likely to entail:
A)
a reduction in investment.
B)
a decrease in the capital stock.
C)
higher saving.
D)
lower saving.
126.
All else equal, a nation that has a high rate of _____ will have a high rate of _____ and
therefore a high growth rate of _____ capital.
A)
investment; savings; human
B)
savings; investment; natural
C)
savings; investment; physical
D)
savings; consumption; physical
127.
The sources of funds for investment spending are:
A)
savings by households, government, and foreigners.
B)
taxes and transfer payments.
C)
always equal to U.S. spending on imports.
D)
directed to their most productive uses by the U.S. government.
128.
Technological progress is advanced through:
A)
research and development.
B)
government regulation.
C)
consumption.
D)
infrastructure.
Page 27
129.
A country’s growth rate strongly depends on how it has invested in its physical capital.
Generally, countries that have used _____ as a source of their capital investment have
exhibited the highest growth rate.
A)
foreign direct investment
B)
domestic saving
C)
foreign portfolio investment
D)
contracted globalization
130.
In 1820, Mexico had a higher real GDP per capita than Japan. Yet now Japan is one of
the richest countries in the world and Mexico is poor. Japan’s high rate of economic
growth can be explained by all of the following EXCEPT a high:
A)
investment in physical capital.
B)
investment in human capital.
C)
investment in technological progress.
D)
level of government interference.
131.
Economies with high growth rates tend to be those that increase their:
A)
government regulation.
B)
human capital.
C)
consumption.
D)
resources.
132.
Economists believe that the best way to stimulate investment in physical capital is to
encourage:
A)
higher rates of investment in human capital.
B)
more spending on infrastructure.
C)
the conservation of natural resources.
D)
higher rates of national saving.
133.
In 1820, Mexico had a higher real GDP per capita than Japan, but today Japan’s real
GDP per capita is higher than Mexico’s because Japan’s real GDP per capita has grown
at _____, and Mexico’s real GDP per capita has grown at _____.
A)
1.9%; 1.3%
B)
1.9%; 1.9%
C)
1.3%; 1.9%
D)
1.3%; 1.3%
Page 28
134.
In the 1960s, Japan was the fastest-growing major economy and it also:
A)
spent a smaller share of its GDP on investment goods than did other major
economies.
B)
spent a larger share of its GDP on investment goods than did other major
economies.
C)
spent more of its GDP on national defense than any other country except for China.
D)
was the first Asian country to join the European Union.
135.
Today China is the fastest-growing major economy and it also:
A)
spends a lower share of its GDP on investment goods than did other major
economies.
B)
spends a higher share of its GDP on investment goods than did other major
economies.
C)
spends more of its GDP on national defense than any other country except for
North Korea.
D)
was the first Asian country to join the European Union.
136.
Which of the following are sources of funds for investment spending?
I. domestic savings
II. foreign savings
III. consumption
A)
I only
B)
II only
C)
I and II
D)
I, II, and III
137.
Who established the first research and development laboratory?
A)
Galileo
B)
Thomas Edison
C)
Thomas Malthus
D)
Franklin Roosevelt
138.
Roads, telephone lines, power facilities, and schools are examples of a nation’s:
A)
technostructure.
B)
infrastructure.
C)
physiostructure.
D)
sociostructure.
Page 29
139.
Ireland’s recent economic growth and improving living standard are due primarily to:
A)
its refusal to join the European Union and abandon its own currency for the euro.
B)
the capture and imprisonment of Sinn Fein leader Gerry Adams.
C)
the large number of immigrants from Eastern Europe.
D)
an excellent physical and human infrastructure, including a good education system,
airports, telecommunications, and shipping facilities.
140.
From the standpoint of economic growth, banks are important to:
A)
fight inflation.
B)
keep interest rates low.
C)
channel savings into investment.
D)
channel investment into savings.
141.
Which of the following CANNOT properly be called a part of infrastructure?
A)
power lines
B)
roads and bridges
C)
human capital
D)
seaports
142.
All of the following are government policies to promote economic growth EXCEPT:
A)
building infrastructure and providing public goods.
B)
implementing a monetary policy that increases inflation.
C)
subsidizing education.
D)
providing political stability and protecting property rights.
143.
Infrastructure includes:
A)
the water supply system.
B)
government bonds.
C)
corporate stock.
D)
the water supply system, government bonds, and corporate stock.
144.
Which of the following is NOT part of infrastructure?
A)
roads
B)
iron ore deposits
C)
power plants
D)
cell phone towers
Page 30
145.
Ireland’s recent economic growth and improving living standard are due primarily to its
investment in all of the following types of physical and human infrastructure EXCEPT:
A)
a good education system.
B)
airports.
C)
telecommunications.
D)
a more open election process.
146.
Which of the following institutions is important for channeling savings into investment?
A)
schools
B)
religious institutions
C)
banks
D)
the federal government
147.
Which of the following CAN properly be called a part of infrastructure?
A)
robots on an assembly line
B)
professors
C)
the Golden Gate bridge
D)
a Broadway show
148.
Which of the following is a government policy to promote economic growth?
A)
building infrastructure and providing public goods
B)
implementing a monetary policy that increases inflation
C)
implementing a fiscal policy that increases inflation
D)
increasing the interest rate charged on student loans
149.
Infrastructure includes:
A)
New York City’s public transportation system.
B)
corporate bonds.
C)
private equity firms.
D)
the water supply system, government bonds, and corporate stock.
150.
Among the public goods important for economic growth is (are):
A)
publicly held companies like Ford.
B)
political stability.
C)
public regulation of businesses.
D)
low taxes.
Page 31
151.
Among the factors that are important for economic growth are:
A)
property rights.
B)
growth accounting.
C)
natural resources.
D)
convergence.
152.
Government spending is like investment in each of the following cases EXCEPT when:
A)
it goes to help pay for education.
B)
it helps provide infrastructure for the economy.
C)
it is used for public health measures.
D)
it is used for a personal income tax rebate.
153.
Long-run economic growth is:
A)
higher in countries with a weak rule of law and excessive government intervention.
B)
lower in countries with a strong government and independent judiciary.
C)
lower in countries whose courts enforce property rights and whose government
protects its citizens.
D)
higher in countries with a strong rule of law and political stability.
154.
The role of the government can explain growth differences among countries. All of the
following are government actions that contribute to differences in growth EXCEPT:
A)
an active role in building infrastructure.
B)
significant cost sharing for higher education.
C)
excessive intervention in business practices and licensing.
D)
emphasis on research and development projects.
155.
It took India more than 40 years to exhibit high economic growth after it gained
independence from British rule in 1947. This faster rate of growth resulted from:
A)
a more stable government.
B)
better infrastructure.
C)
higher investment in human capital.
D)
a reduction in the burden of corruption.
156.
Which of the following may lead to lower productivity because of a lack of incentives?
A)
a stable political system
B)
protection of property rights
C)
government subsidies
D)
public education
Page 32
157.
Economies with high growth rates tend to be those that have:
A)
large amounts of natural resources.
B)
a stable government that protects property rights.
C)
high levels of government regulation.
D)
a large defense budget.
158.
One factor frequently cited for slow growth in India until the 1990s is:
A)
reliance on the drug trade.
B)
too little government intervention in the economy.
C)
dependence of foreign capital flows.
D)
corruption among government officials.
159.
When the government invests in building roads, ports, and a reliable power grid, it is
investing in a nation’s:
A)
private property.
B)
human capital.
C)
technological progress.
D)
infrastructure.
160.
When the government invests resources in a nation’s educational system, it is investing
in:
A)
private property.
B)
human capital.
C)
political stability.
D)
infrastructure.
161.
Which of the following contributes to economic development?
A)
low saving and investment rates
B)
a command socialist economic system
C)
investment in infrastructure
D)
complete absence of government involvement
162.
The main reason South Korea has grown so rapidly is that because it was so poor:
A)
it could take advantage of international financial aid for poor countries.
B)
people left to go to more prosperous countries.
C)
it could skip forward, or leapfrog, to use new-generation technology as it
developed.
D)
it could import highly trained engineers from other countries.
Page 33
163.
Since the 1960s, nations like South Korea have been a part of the so-called East Asian
economic miracle because:
A)
high rates of human capital growth have offset slow savings rates.
B)
of high rates of national savings that offset the slower rate of technological
progress.
C)
of high savings rates, greater quantities of physical capital per worker, and slower
growth of human capital.
D)
of the combination of rapid technological progress, high savings rates, and rapid
improvement in human capital.
164.
The convergence hypothesis helps explain why:
A)
highly educated people converge in high-income countries.
B)
high-income individuals marry other high-income individuals.
C)
high-income countries continue their high growth rates.
D)
the income of high-income and lower-income countries get closer.
165.
The idea that relatively poor nations should have higher rates of growth of real GDP per
capita than relatively rich nations is known as the:
A)
East Asian miracle.
B)
Industrial Revolution.
C)
sustainable development hypothesis.
D)
convergence hypothesis.
166.
The convergence hypothesis states that international differences in real GDP per capita
tend to _____ over time.
A)
diverge
B)
fluctuate
C)
remain constant
D)
narrow
167.
The East Asian countries have exhibited tremendous economic growth during the past
40 years because of all of the following EXCEPT:
A)
a significant increase in physical capital per worker made possible by very high
rate of saving.
B)
a significant increase in human capital made possible by very good basic
education.
C)
a substantial achievement in technological progress.
D)
intervening governments with lots of regulations.
Page 34
168.
The convergence hypothesis says that:
A)
differences in real GDP per capita among countries tend to narrow over time.
B)
differences in real GDP per capita among countries tend to increase over time.
C)
differences in real GDP per capita do not have much effect on living standards in
the long run.
D)
aggregate production functions in different countries will all be the same in the
long run.
169.
The convergence hypothesis says that international differences in GDP per capita tend
to _____ over time.
A)
narrow
B)
expand
C)
remain steady
D)
narrow and then expand
170.
According to the convergence hypothesis, differences in GDP per capita among
countries tends to narrow over time because countries that start with a _____ real GDP
per capita tend to have _____ growth rates.
A)
lower; higher
B)
lower; lower
C)
higher; higher
D)
higher; negative
171.
Which of the following factors have contributed to the lack of economic growth in Latin
America?
I. lack of natural resources
II. high rates of savings that led to insufficient consumption of goods and services
III. political instability
A)
I only
B)
II only
C)
III only
D)
I, II, and III
Page 35
172.
Which of the following factors have contributed to the lack of economic growth in Latin
America?
I. low rates of savings and investment
II. low value on education
III. political instability
A)
I only
B)
II only
C)
III only
D)
I, II, and III
173.
Throughout the twentieth century, nations in Latin America had disappointing growth
rates primarily due to:
A)
low rates of national savings, political instability, and little emphasis on education.
B)
low rates of investment in physical capital that offset a strong emphasis on
education.
C)
abundant natural resources, rapid technological progress, and political instability.
D)
low rates of national savings, a scarcity of natural resources, and political
instability.
174.
In the 1980s which factor contributed to slow growth in Latin America countries?
A)
reliance on the drug trade
B)
excessive government intervention in the economy
C)
an overly high birth rate
D)
excessive reliance on the United States for foreign trade
175.
Which of the following is one reason for Latin America’s lack of economic growth since
1920?
A)
overspending on education
B)
inability to compete with imported products
C)
low savings and investment spending because government policies led to inflation,
bank failures, and other disruptions
D)
very poor natural resources
176.
All of the following are reasons for the economic stagnation of Latin America during
the last century EXCEPT:
A)
irresponsible government policies that fueled high levels of inflation.
B)
low rates of savings.
C)
lack of public support for education.
D)
excessively large flows of foreign investment.
Page 36
177.
Latin American growth since the 1920s has been relatively slow because of all of the
following EXCEPT:
A)
a lack of savings to finance investment.
B)
a lack of a solid education system.
C)
a lack of political stability.
D)
U.S. intervention.
178.
The key factor explaining the poor growth performance in Africa is probably:
A)
lack of domestic political stability.
B)
lack of natural resources.
C)
overpopulation.
D)
the prevalence of military conflicts among neighboring countries.
179.
Sub-Saharan Africa is so poor mainly because:
A)
settlers from Europe own all of the land.
B)
the diamond merchants took all of the money away to other countries.
C)
of political instability and civil wars.
D)
all of the bright people move to other countries.
180.
Economic growth in sub-Saharan Africa has been dismal. Which of the following is
NOT a reason for Africa’s problem?
A)
stable governments
B)
government corruption
C)
a lack of property rights
D)
a lack of infrastructure
181.
Between 1980 and 1994, real per capita GDP in sub-Saharan Africa:
A)
fell by 13%.
B)
fell by 50%.
C)
increased by 10%.
D)
increased by 7% per year.
Page 37
182.
Which of the following factors have contributed to the lack of economic growth in
Africa?
I. political instability
II. lack of spending on education and infrastructure
III. malnutrition and disease
A)
I only
B)
II only
C)
III only
D)
I, II, and III
183.
The convergence hypothesis is:
A)
wrong, because Latin American and African countries have not been able to grow.
B)
not wrong, but education, infrastructure, and the rule of law are not equal among
nations.
C)
not wrong, but because poorer nations are involved in so many destabilizing
incidents like wars, disease, and famines, they will never be able to catch up with
the rest of the world.
D)
wrong, because poorer nations’ income seems to get worse over time and the richer
nations’ income get better.
184.
Conditional convergence suggests that:
A)
poorer countries are still catching up to richer countries.
B)
poorer countries’ GDP may not catch up to those of richer countries without
changes in education and infrastructure.
C)
poorer countries’ growth rates depend on their ties to a richer country.
D)
poorer countries’ growth rates depend on their birth rates.
185.
The convergence hypothesis fits the data only when the factors that affect growth are
held equal across countries. These factors include all of the following EXCEPT:
A)
education.
B)
infrastructure.
C)
favorable policies and institutions.
D)
GDP per capita.
186.
Which of the following factors is NOT necessary for convergence between two
countries?
A)
equal access to education
B)
equal access to infrastructure
C)
a common language between the two countries
D)
similar levels of political stability
Page 38
187.
Convergence is most likely between:
A)
Mexico and Ghana.
B)
France and Germany.
C)
Brazil and the United Kingdom.
D)
Mexico and Ghana or Brazil and the United Kingdom.
188.
Long-run growth is sustainable if:
A)
it can continue in the face of limited natural resources and the impact of growth on
the environment.
B)
people continue to buy enough goods and services.
C)
energy prices are low.
D)
environmental concerns are ignored during global recessions.
189.
Long-run economic growth will be sustainable:
A)
because pollution and urban sprawl are not real problems.
B)
because there are plenty of natural resources left to be consumed in the future.
C)
if it can continue in spite of the limited supply of natural resources and the impact
of growth on environment.
D)
because the natural resource scarcity and other environmental issues are not really
as serious as they seem.
190.
Thomas Malthus:
A)
was President Reagan’s primary economic adviser.
B)
successfully predicted the nationalization of the insurance company AIG.
C)
predicted that limited land supplies would prevent large increases in real incomes
per capita.
D)
wrote The Limits to Growth in 1972.
191.
In the book The Limits to Growth, The Club of Rome argued that:
A)
free trade could make world growth sustainable.
B)
the World Bank needed to establish a global currency.
C)
the convergence hypothesis was invalid.
D)
limited supplies of natural resources made long-run growth unsustainable.
Page 39
192.
Economists are optimistic that growth can continue in the face of resource scarcity
because:
A)
the oil industry vastly understates the level of oil reserves.
B)
prices of scarce resources fall and provide incentives to use more of those
resources.
C)
prices of scarce resources rise and provide incentives to find alternative energy
sources.
D)
resource scarcity no longer limits economic growth.
193.
In general, the growth in real GDP per capita:
A)
was smaller than the growth of per capita oil consumption before 1973.
B)
fluctuated above and below the growth of per capita oil consumption before 1973.
C)
was greater than the growth of per capita oil consumption after 1973.
D)
was smaller than the growth of per capita oil consumption after oil prices began to
increase in 2004.
194.
During the 1990s:
A)
high oil prices encouraged consumers to buy small, fuel-efficient cars.
B)
low oil prices encouraged consumers to buy large cars and SUVs that were
generally not fuel-efficient.
C)
high oil prices encouraged the development of alternative energy sources.
D)
low oil prices led to decreases in real GDP.
195.
Written in 1972, the book that argued that long-run economic growth was not
sustainable because of limited supplies of natural resources was called:
A)
An Essay on the Principle of Population.
B)
The Limits to Growth.
C)
The Wealth of Nations.
D)
Aftershock: The Next Economy and America’s Future.
196.
Between 1973 and the early 1990s consumers responded to:
A)
low oil prices by buying large cars, trucks, and SUVs that were not fuel-efficient.
B)
low oil prices by using other types of energy.
C)
high oil prices by buying small, fuel-efficient cars.
D)
high oil prices by agreeing to cap-and-trade policies to limit the use of oil.
Page 40
197.
Greenhouse gas emissions are an example of:
A)
a negative externality.
B)
a public good.
C)
a positive externality.
D)
a private good.
198.
Economists mostly agree that the problem of climate change necessitates government
action in the form of market-based incentives such as:
A)
tax rebates to those causing negative externalities.
B)
a reduction in the amount of gasoline that each person is allowed to purchase.
C)
a carbon tax or a cap and trade system.
D)
a reduction in the price of green cars and appliances.
199.
The biggest global environment issue is:
A)
the impact of fossil-fuel consumption on the world’s climate.
B)
the availability of coal.
C)
how to determine who has the property rights to wind power.
D)
how to extract oil from Canadian tar sands.
200.
As a limit to economic growth, environmental problems are more difficult to solve than
resource problems because:
A)
environmental problems don’t automatically provide incentives for changed
behavior.
B)
resource problems don’t automatically provide incentives for changed behavior.
C)
the opportunity cost of solving environmental problems in terms of GDP sacrificed
is larger.
D)
most scientists haven’t determined the relationship between greenhouse gas
emissions and climate change.
201.
A negative externality:
A)
is not as costly as a positive externality.
B)
is a cost that individuals or firms impose on others without having to offer
compensation.
C)
is immune to economic incentives.
D)
is an unavoidable consequence of budget deficits.
Page 41
202.
A cap and trade system:
A)
reduces climate change by requiring individuals and firms to buy licenses to emit
greenhouse gases.
B)
encourages fair trade by limiting the amount of many vegetables that can be
imported from Mexico.
C)
was used in nineteenth-century England to limit coal consumption.
D)
exempts Chinese imports from Food and Drug Administration regulations.
203.
Economists generally agree that ____ are the best way for governments to reduce
greenhouse gases to address climate change.
A)
military actions
B)
market-based incentives
C)
direct pollution controls
D)
subsidies for offshore oil exploration
Use the following to answer questions 204-206:
Scenario: Technological Progress and Productivity Growth in Techland
In Techland, from 1980 to 2010, holding technology and human capital fixed, increasing
physical capital per worker from $25,000 to $100,000 would have led to a doubling of real GDP
per worker, from $40,000 to $80,000. However, not only did physical capital per worker increase
from $25,000 to $100,000, but technological progress shifted the productivity curve upward so
that real GDP per worker actually increased from $40,000 to $320,000.
204.
(Scenario: Technological Progress and Productivity Growth in Techland) Look at the
scenario Technological Progress and Productivity Growth in Techland. What was the
growth rate of real GDP per capita in Techland?
A)
2.0%
B)
4.5%
C)
7%
D)
17.5%
205.
(Scenario: Technological Progress and Productivity Growth in Techland) Look at the
scenario Technological Progress and Productivity Growth in Techland. What share of
the growth rate of real GDP per capita was attributable to increasing physical capital per
worker?
A)
2.0%
B)
4.5%
C)
8.75%
D)
17.5%
Page 42
206.
(Scenario: Technological Progress and Productivity Growth in Techland) Look at the
scenario Technological Progress and Productivity Growth in Techland. What share of
the growth rate of real GDP per capita was attributable to higher total factor
productivity?
A)
2.0%
B)
5%
C)
8.75%
D)
6.5%
Use the following to answer questions 207-212:
Figure: Technological Progress and Productivity Growth
207.
(Figure: Technological Progress and Productivity Growth) Look at the figure
Technological Progress and Productivity Growth. Which of the following changes in
real GDP is most likely to have resulted from an increase in domestic savings?
A)
A to B
B)
B to A
C)
C to B
D)
C to A
Page 43
208.
(Figure: Technological Progress and Productivity Growth) Look at the figure
Technological Progress and Productivity Growth. Which of the following changes in
real GDP is most likely to have resulted from an increase in foreign investment
spending?
A)
A to B
B)
B to C
C)
B to A
D)
both A to B and B to C
209.
(Figure: Technological Progress and Productivity Growth) Look at the figure
Technological Progress and Productivity Growth. Which of the following changes in
real GDP is most likely to have resulted from an increase in the quality (as well as
quantity) of government spending on education?
A)
A to B
B)
B to A
C)
B to C
D)
C to B
210.
(Figure: Technological Progress and Productivity Growth) Look at the figure
Technological Progress and Productivity Growth. Which of the following changes in
real GDP is most likely to have resulted from an increase in the quality (as well as
quantity) of public health measures?
A)
A to B
B)
B to C
C)
B to A
D)
C to B
211.
(Figure: Technological Progress and Productivity Growth) Look at the figure
Technological Progress and Productivity Growth. Which of the following changes in
real GDP is most likely to have resulted from a gradual decline in property rights
because of excessive government intervention?
A)
A to B
B)
B to C
C)
C to B
D)
C to A
Page 44
212.
(Figure: Technological Progress and Productivity Growth) Look at the figure
Technological Progress and Productivity Growth. Which of the following changes in
real GDP is most likely to have resulted from the deterioration of the nation’s
infrastructure over time?
A)
A to B
B)
B to C
C)
C to B
D)
B to A
213.
South Korea has real GDP per capita of $25,000, while England has real GDP per capita
of $50,000. If real GDP per capita in South Korea grows at 7% and England’s real GDP
per capita grows at 3.5%, how long will it take for real GDP per capita in the two
nations to converge?
A)
10 years
B)
20 years
C)
25 years
D)
35 years
214.
Sweden has real GDP per capita of $50,000, while Chile has real GDP per capita of
$25,000. If real GDP per capita in Sweden grows at 2% and Chile’s real GDP per capita
grows at 4%, how long will it take for real GDP per capita in the two nations to
converge?
A)
10 years
B)
20 years
C)
25 years
D)
35 years
215.
Suppose that South Korea is growing at 7% per year and is producing real GDP per
capita of about $28,000, while Norway is growing at 3.5% per year and is producing
real GDP per capita of $56,000. If all else stays equal, the real GDP per capita for these
two countries will converge in:
A)
40 years.
B)
20 years.
C)
10 years.
D)
4 years.
216.
More than 50% of the world’s population lives in countries whose population is poorer
than the United States population was a century ago.
A)
True
B)
False
Page 45
217.
As a result of the long-term growth between 1900 and 2010, the output per person in the
United States was about twice as large in 2010 as it was in 1900.
A)
True
B)
False
218.
According to the rule of 70, a 10% annual increase in real GDP would lead to a
doubling of real GDP in seven years.
A)
True
B)
False
219.
If an economy has a real GDP per capita growth rate of 2%, it will take 14 years for
GDP per capita to double.
A)
True
B)
False
220.
If an economy doubles its growth rate in per capita GDP over 14 years, then the growth
rate in per capita GDP averaged 5% per year.
A)
True
B)
False
221.
A rise in real GDP that is the same as the rate of population growth leaves the average
standard of living unchanged.
A)
True
B)
False
222.
Long-run economic growth depends almost entirely on rising productivity.
A)
True
B)
False
223.
Increases in human capital will promote economic growth.
A)
True
B)
False
224.
The three main reasons that the average U.S. worker today produces far more than his or
her counterpart a century ago are more physical capital, more human capital, and a great
deal of technological progress.
A)
True
B)
False
Page 46
225.
If technology improves, then it takes more inputs to produce the same output as the last
period.
A)
True
B)
False
226.
Physical capital consists of man-made resources like machines and buildings.
A)
True
B)
False
227.
The aggregate production function typically increases at an increasing rate with
additions to capital.
A)
True
B)
False
228.
Diminishing returns to physical capital means that as more and more physical capital is
added to fixed amounts of human capital with a fixed technology, eventually real GDP
per worker declines.
A)
True
B)
False
229.
According to estimates of the aggregate production function, each 1% increase in
physical capital, holding human capital and technology constant, raises labor
productivity by 0.33%.
A)
True
B)
False
230.
Growth accounting estimates the contribution of each major factor in the aggregate
production function to economic growth.
A)
True
B)
False
231.
The aggregate production function exhibits diminishing returns to labor but not to
physical capital.
A)
True
B)
False
Page 47
232.
The aggregate production function shows how productivity depends on natural
resources and financial capital.
A)
True
B)
False
233.
Growth accounting is a fast-growing industry that assists taxpayers in filing their taxes
online.
A)
True
B)
False
234.
Growth accounting estimates the contribution to economic growth of each factor in the
aggregate production function.
A)
True
B)
False
235.
Total factor productivity is the amount of output that can be achieved with a given
amount of factor inputs.
A)
True
B)
False
236.
In 1798 the British economist Thomas Malthus predicted that Nazi Germany would
invade Poland.
A)
True
B)
False
237.
In 1798 the English economist Thomas Malthus predicted that a growing population and
a fixed supply of land would eventually cause productivity to fall.
A)
True
B)
False
238.
Malthus’ predictions have proved to be true, and they explain why U.S. productivity
growth slowed between the 1970s and the mid-1990s.
A)
True
B)
False
Page 48
239.
Malthus’ predictions have proved to be false because the negative effects on
productivity of population growth have been outweighed by advances in technology and
increases in both human and physical capital.
A)
True
B)
False
240.
Most of the rapidly growing Asian nations, though poor, have increased their
productivity by providing a very good basic education for their citizens.
A)
True
B)
False
241.
Research and development is what we call spending to develop and implement new
technologies.
A)
True
B)
False
242.
In 1820, Mexico had a somewhat higher real GDP per capita than Japan, but today
Japan’s is higher than Mexico’s.
A)
True
B)
False
243.
In 2010, the U.S. spent 38% of its GDP on investment, while China spent only 16% of
its GDP on investment.
A)
True
B)
False
244.
Sources of funds for investment spending include both foreign and domestic savings.
A)
True
B)
False
245.
The average level of education, measured by the number of years the average adult has
spent in school, is higher in Argentina than it is in China.
A)
True
B)
False
Page 49
246.
Research and development is defined as spending to develop and implement new
technologies.
A)
True
B)
False
247.
An example of a public good that encourages economic growth is public health services,
such as vaccinations.
A)
True
B)
False
248.
To encourage an increase in economic growth rates, governments should increase
regulation of the economy.
A)
True
B)
False
249.
The convergence hypothesis says that international differences in real GDP per capita
tend to increase over time.
A)
True
B)
False
250.
According to the convergence hypothesis, differences in GDP per capita among
countries tend to narrow over time because countries that start with a lower real GDP
per capita tend to have negative growth rates.
A)
True
B)
False
251.
According to the convergence hypothesis, differences in GDP per capita among
countries tend to narrow over time because countries that start with a lower real GDP
per capita tend to have higher growth rates.
A)
True
B)
False
252.
High rates of savings and investment and a lack of consumption spending have
contributed to the recent stagnant economic growth in Latin America.
A)
True
B)
False
Page 50
253.
One factor contributing to a slow rate of economic growth in Latin America is that
broad basic education has been underemphasized in most countries.
A)
True
B)
False
254.
In the 1980s many economists believed that one problem in Latin America was a lack of
government intervention in markets and recommended that the government seize
ownership of many struggling companies.
A)
True
B)
False
255.
Having achieved sustained rapid growth, Chile is an exception to the disappointing slow
economic growth among most other Latin American nations.
A)
True
B)
False
256.
According to Jeff Sachs of Columbia University, Africa is politically unstable because
Africa is poor and not the other way around.
A)
True
B)
False
257.
Between 1980 and 1994, growth rates of real GDP per capita in sub-Saharan Africa
ranged from 20% to 30%.
A)
True
B)
False
258.
Between 1980 and 1994, growth rates of real GDP per capita in sub-Saharan Africa fell
by more than 10%.
A)
True
B)
False
259.
According to the convergence hypothesis, the richest countries have the fastest growth
rate of real GDP per capita.
A)
True
B)
False
Page 51
260.
According to the convergence hypothesis, the poorest countries have the fastest growth
rate of real GDP per capita.
A)
True
B)
False
261.
Because the gap in real GDP per capita between Western Europe, North America, and
parts of Asia is widening, the convergence hypothesis is wrong.
A)
True
B)
False
262.
According to conditional convergence, the real GDP per capita of poor nations will
never catch up to that of wealthy nations because of the condition of the military in poor
nations.
A)
True
B)
False
263.
Conditional convergence suggests that if adjustments were made for differences in
education, infrastructure, and other factors that contribute to growth, poorer countries
would have higher growth rates.
A)
True
B)
False
264.
Sustainable long-run economic growth is long-run growth that can continue in the face
of decreases in the growth rate of the world’s population.
A)
True
B)
False
265.
Sustainable long-run economic growth can continue in the face of the limited supplies
of natural resources and the impact of growth on the environment.
A)
True
B)
False
266.
Between 1990 and 2005 the price of oil was high relative to prices in the 1970s and
1980s, and consumers responded by buying small, fuel-efficient cars.
A)
True
B)
False
Page 52
267.
Between 1990 and 2005 the price of oil was low relative to prices in the 1970s and
1980s, and consumers responded by buying large, fuel-inefficient vehicles.
A)
True
B)
False
268.
After the price of oil increased in the 1970s, the growth rate of the United States
declined substantially.
A)
True
B)
False
269.
A negative externality is a good or a service that the government or a private business
provides to a foreign country.
A)
True
B)
False
270.
A negative externality is a cost that individuals or firms impose on others without
having to offer compensation.
A)
True
B)
False
271.
Greenhouse gas emissions are an example of a negative externality.
A)
True
B)
False
272.
Carbon taxes and cap and trade systems are market-based incentives that are likely to be
effective in limiting greenhouse gas emissions.
A)
True
B)
False
273.
The purpose of a cap and trade system is to encourage trade between countries by
limiting the amount of tariffs that can be imposed on traded goods.
A)
True
B)
False
274.
A cap and trade system limits, or caps, the total amount of a negative externality, and
producers must buy licenses to generate that externality.
A)
True
B)
False
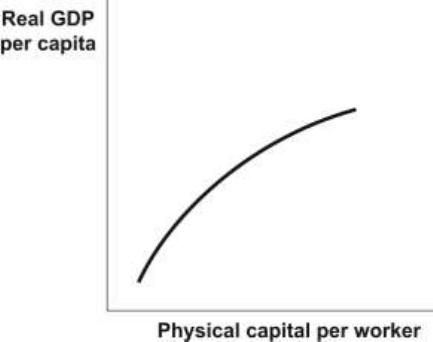
Page 53
275.
When tracking economic growth, why do economists prefer real GDP per capita over:
a. real GDP?
b. nominal GDP per capita?
276.
A nation’s real GDP per capita increased from $250 billion to $275 billion in one year.
Calculate the nation’s growth rate.
277.
A nation’s real GDP increased from $250 billion to $265 billion in one year. In that
same year, the nation’s population increased from 125 million to 130 million. Calculate
the nation’s real GDP per capita growth rate.
278.
A nation’s real GDP increased from $225 billion to $230 billion in one year. In that
same year, the nation’s population increased from 125 million to 126 million.
a. Calculate the nation’s real GDP per capita growth rate.
b. If this nation maintained this growth rate, how many years would it take for real GDP
per capita to double?
Use the following to answer question 279:
Figure: The Aggregate Production Function
279.
(Figure: The Aggregate Production Function) Look at the figure The Aggregate
Production Function. Does it exhibit diminishing returns to physical capital? Explain.
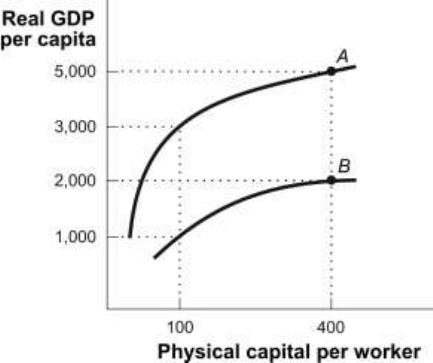
Page 54
280.
Suppose that country A has a domestic savings rate of 3%, while country B has a
savings rate of 8%. Which country is likely to have the higher rate of economic growth?
Why?
281.
Two politicians are debating the best ways to spur long-term growth in the nation’s real
GDP per capita. Candidate X says we should lower income taxes so that households
have more money to spend on goods and services. Candidate Y says we should lower
taxes on interest income so that households have more incentive to save. Which
candidate has the right idea?
282.
Many impoverished nations struggle with diseases like malaria. How would reduction or
elimination of malaria contribute to long-run economic growth?
283.
Fifty years ago East Asia, Latin America, and Africa were all relatively poor areas. Why
did East Asia have fairly rapid growth in real GDP per capita while economic growth in
Latin America and Africa was generally low?
284.
Suppose that fossil fuels become scarcer and scarcer in the next 50 years. With a
growing global demand for energy and the looming threat of rising global temperatures,
it would seem to be a recipe for a dramatic decrease in the growth rate of economic
activity. Why do many economists believe that economies can continue to grow even in
the face of resource scarcity?
Use the following to answer questions 285-286:
Figure: Nations A and B
Page 55
285.
(Figure: Nations A and B) Look at the figure Nations A and B. Suppose that in 1960
each nation had $100 of physical capital for each worker and in 2010 each nation had
$400 of physical capital per worker. Compute the growth of real GDP per capita for
both nations.
286.
(Figure: Nations A and B) Look at the figure Nations A and B. Suppose that in 1960
each nation had $100 of physical capital for each worker and in 2010 each nation had
$400 of physical capital per worker. Clearly in both 1960 and in 2010 nation A was
producing more real output per capita with the same amount of physical capital per
worker. What could explain the difference in these aggregate production functions?
287.
The value of real GDP divided by population for a given country:
A)
is the real GDP per capita.
B)
is always increasing in value for any country.
C)
remains constant for developing countries.
D)
is per capita GDP.
288.
If the population and GDP increase by the same percentage, then real GDP per capita:
A)
stays the same.
B)
increases.
C)
decreases.
D)
may change, but one cannot be sure of the direction.
289.
In 2010, the median U.S. household income was approximately:
A)
$50,000.
B)
$8,000.
C)
$16,000.
D)
$25,000.
290.
In the past 30 years, both China and India have had substantial economic growth:
A)
and as a result, they are almost as rich as the United States today.
B)
but India is still poorer than the United States was in 1900, and China only now
matches the level of income in the U.S. in 1900.
C)
which was fueled by both countries’ increases in consumption.
D)
which came about because of their relatively low levels of saving.
Page 56
291.
The rule of 70 tells us that:
A)
it takes most countries 70 years to increase real GDP growth.
B)
the number of years it takes for a variable to double is equal to 70 divided by the
annual growth rate of the variable.
C)
the number of years for real GDP per capita to double is the current growth rate
plus 70.
D)
only 70 countries can have real GDP growth at any given time.
292.
If real GDP in country A is $500 billion one year and is $540 billion the following year,
this means the growth rate for this country between the two years is:
A)
4%.
B)
8%.
C)
0.8%.
D)
10%.
293.
According to the rule of 70, if a country has an average growth rate of 7%, its real GDP
per capita will double in:
A)
7 years.
B)
10 years.
C)
14 years.
D)
2 years.
294.
Long-run economic growth has been mostly dependent on:
A)
rising productivity.
B)
a low unemployment rate.
C)
an increase in the population, which eventually leads to an increase in the labor
population.
D)
countries following the rule of 70.
295.
Education’s effect on productivity:
A)
is believed to be less important than the amount of physical capital a worker has
available.
B)
is even more important than increases in physical capital.
C)
has fallen in the past century in the United States.
D)
depends on the wealth of the country.
Page 57
296.
Factors that influence productivity and therefore growth are:
A)
physical and human capital per worker and technological advances.
B)
government independence.
C)
more government intervention in the marketplace.
D)
increased consumption and less investment spending.
297.
Historically, development of a new technology often:
A)
results in immediate increases in productivity.
B)
leads to increases in productivity only once firms learn how to use it.
C)
requires a complementary increase in physical and human capital.
D)
has had no impact on changes in productivity.
298.
Technological change:
A)
raises total factor productivity.
B)
is not as important as infrastructure maintenance.
C)
shifts the aggregate production function downward.
D)
relies on consumption increases at the expense of saving.
299.
Diminishing returns to physical capital suggests that:
A)
when the amount of human capital per worker and the state of technology are
fixed, successive increases in the amount of physical capital per worker lead to
smaller increases in productivity.
B)
physical capital increases lead to drops in productivity when the amount of human
capital per worker and the state of technology are fixed.
C)
increases in technological progress lead to decreases in productivity.
D)
physical capital must be increased less than human capital and technological
progress for growth to occur.
300.
Diminishing returns to physical capital suggests that:
A)
at some point, increasing the amount of physical capital per worker is not worth the
cost of the additional amount of capital.
B)
after some point, increasing the amounts of physical capital per worker will lead to
decreases in productivity.
C)
increasing the amount of physical capital per worker is always worth the cost of the
capital.
D)
there are increasing returns to technology and human capital.
Page 58
301.
Total factor productivity:
A)
is the amount of output produced from a given amount of factor inputs.
B)
is not an essential element in long-run growth.
C)
is less important than technological progress.
D)
cannot be used to explain how contributions of factors of production affect a
country’s growth.
302.
Based on historical economic growth, economists have noted that the estimated
aggregate production function:
A)
exhibits constant returns to physical capital.
B)
shows that when holding the amount of human capital and the state of technology
fixed, successive increases in the amount of physical capital per worker lead to
smaller increases in productivity.
C)
depends primarily on physical capital and technology advances.
D)
shows the negative relationship between physical capital and productivity.
303.
When a country utilizes more physical capital per worker over time, there will be:
A)
lower and eventually zero growth rate of productivity.
B)
higher growth rates of productivity.
C)
no change in the growth rate of productivity.
D)
lower but always positive growth rates of productivity.
304.
Natural resources:
A)
are still the most important factor in determining the productivity of human or
physical capital for all countries.
B)
are the only factor that consistently shows a positive effect on productivity for
wealthy countries.
C)
are a less significant source of productivity growth in most countries today than in
earlier times.
D)
can be used to explain the differences in productivity growth among countries.
305.
Investment spending:
A)
must be paid for by consumption in domestic households.
B)
comes from the savings of either domestic or foreign households.
C)
is paid for by capital outflows.
D)
must be paid for by government spending.
Page 59
306.
Large technological gains often result:
A)
in immediate rapid growth of an economy.
B)
only if the innovation is broad and monumental.
C)
from modest as well as large innovations.
D)
from deliberate attempts at specific types of innovation.
307.
Japan’s economy:
A)
had higher real GDP per capita than that of most European countries in 2010.
B)
relies on high consumption to spur its economic growth.
C)
grew but not as fast as Mexico’s economy over the long run.
D)
had the same real GDP per capita as Mexico in 1820.
308.
In 2010, China saved:
A)
less than the United States saved.
B)
more and spent more on investment as a percentage of its GDP than the United
States.
C)
less and spent less on investment as a percentage of its GDP than the United States.
D)
more but still had an economic growth rate less than that of the United States.
309.
One of the most important types of infrastructure that a government can provide is:
A)
a good tax system.
B)
basic health measures such as clean water and disease control.
C)
the kind that private companies would provide if they were allowed to.
D)
more intervention in the market mechanism.
310.
To hinder growth, a government might:
A)
provide basic health measures.
B)
support research and development.
C)
not protect property rights.
D)
encourage saving.
311.
Factors contributing to differences in countries’ growth rates include all of the following
EXCEPT:
A)
adherence to the rule of 70.
B)
differences in savings and investment rates.
C)
the amount of physical capital available.
D)
a lack of spending on infrastructure.
Page 60
312.
The convergence hypothesis:
A)
apparently applies only to wealthy countries.
B)
seems to hold only when other things such as education and infrastructure are held
equal.
C)
suggests that relatively poor countries will continue to be poor regardless of their
level of saving.
D)
states that countries’ growth depends upon the amount of government intervention
in the marketplace.
313.
Many economists view resource scarcity as a:
A)
major obstacle to long-run economic growth.
B)
problem resolved fairly well by the market mechanism.
C)
primary reason for poor countries’ lack of economic growth.
D)
problem for wealthy countries but not for poorer countries.
314.
Many economists agree that environmental damage from economic growth:
A)
is minimal and not serious enough to address through economic channels.
B)
occurs but can be contained with market-based incentives and concerted
government action.
C)
results in a lack of growth in some countries.
D)
occurs only in poorer countries.
Use the following to answer questions 315-316:
Scenario: Capital
An economy initially has 200 units of physical capital per worker. Each year it increases the
amount of physical capital by 10%. According to the aggregate production function for this
economy, each 1% increase in physical capital per worker, holding human capital and
technology constant, increases output per worker by 0.25%.
315.
(Scenario: Capital) Look at the scenario Capital. In three years’ time, what is the level of
physical capital per worker in this economy?
A)
220 units
B)
242 units
C)
266.2 units
D)
200 units
Page 61
316.
(Scenario: Capital) Look at the scenario Capital. If there is no inflation and output per
worker is initially $1,000, what does the estimated output per worker equal after one
year?
A)
$1,250
B)
$2,500
C)
$1,225
D)
$1,025

Page 62
Answer Key

Page 63

Page 64

Page 65

Page 66

Page 67
Page 68

Page 69