Name:
Class:
Date:
chapter 9
Indicate whether the statement is true or false.
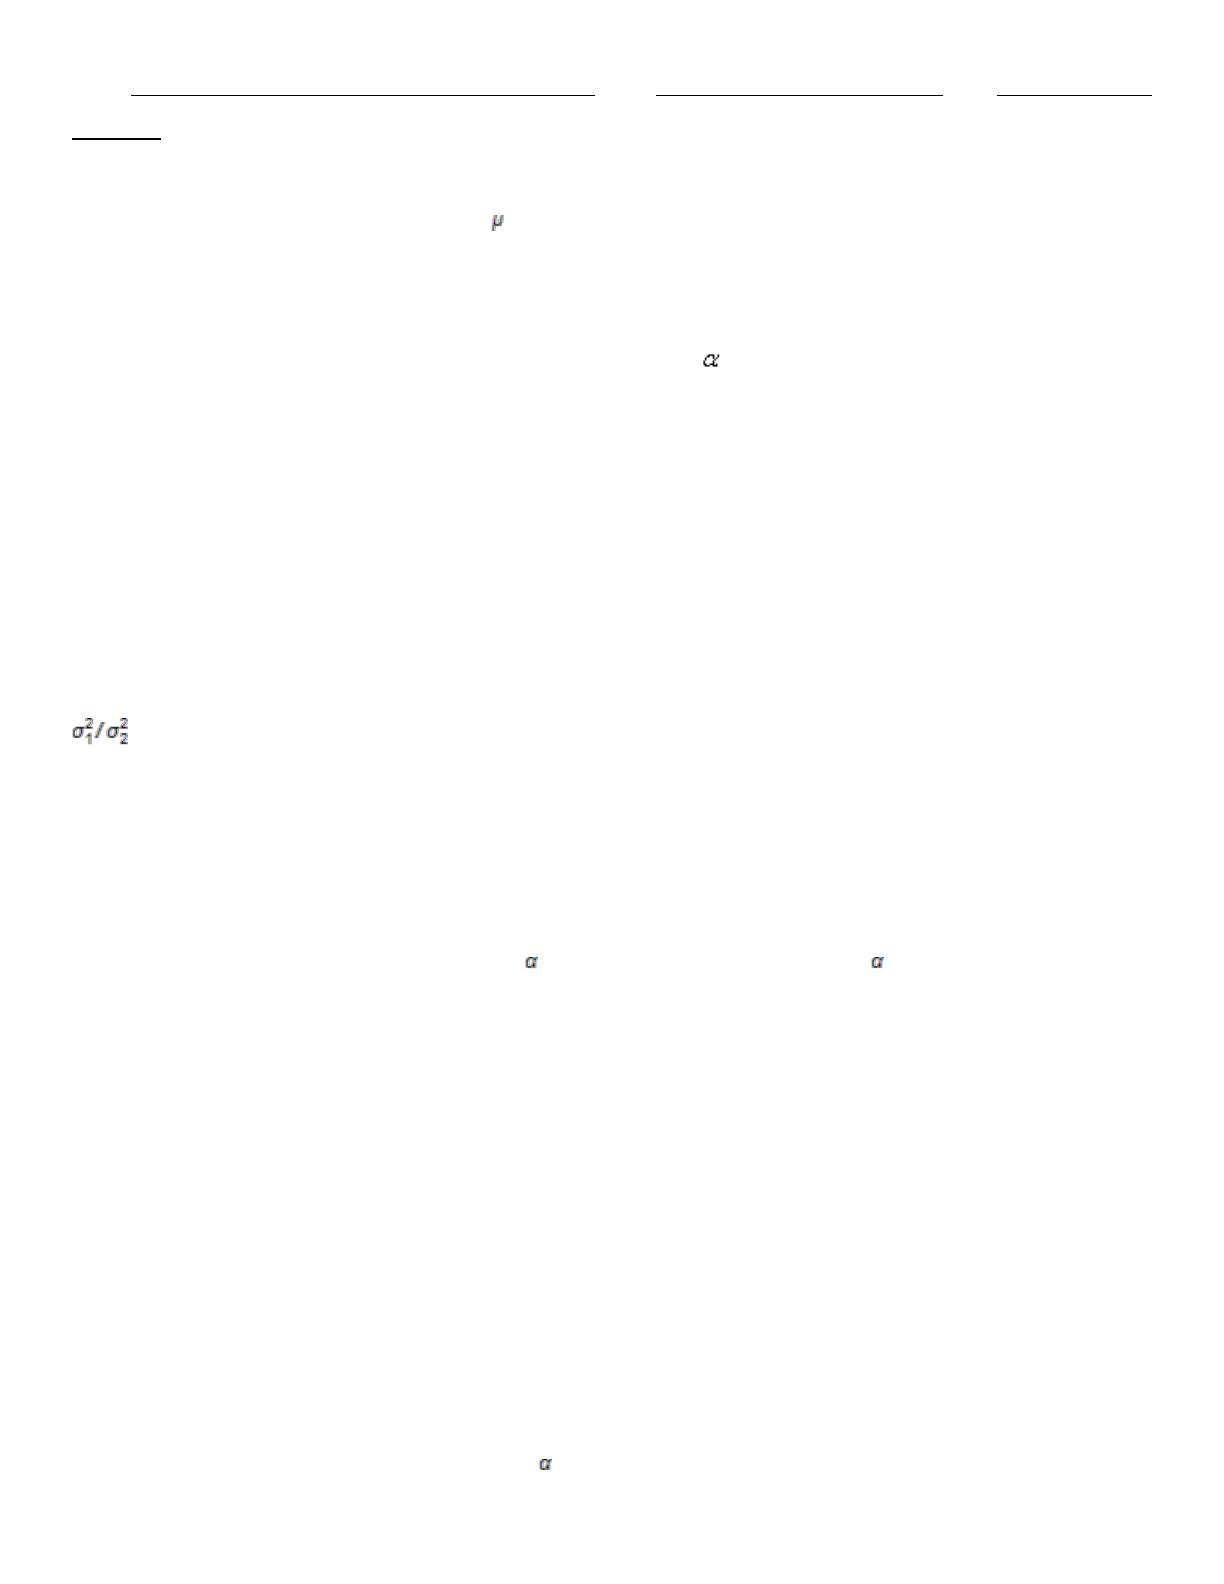
1. If a null hypothesis about a population mean is rejected at the 0.025 level of significance, then it must also be
rejected at the 0.01 level.
a.
True
b.
False
2. The probability of making a Type I error and the level of significance are the same.
a.
True
b.
False
3. Side–by–side box–plots are typically a good way to begin the analysis when comparing two populations.
a.
True
b.
False
4. The rejection region is the set of sample data that leads to the rejection of the alternative hypothesis.
a.
True
b.
False
5. When testing the equality of two population variances, the test statistic is the ratio of the population variances; namely
.
a.
True
b.
False
6. The Lilliefors test is used to test for normality.
a.
True
b.
False
7. Sample evidence is statistically significant at the level only if the p–value is larger than .
a.
True
b.
False
8. A low p–value provides evidence for accepting the null hypothesis and rejecting the alternative.
a.
True
b.
False
9. The chi–square test for normality makes a comparison between the observed histogram and a histogram based on
normality.
a.
True
b.
False
10. An example of a paired sample is the number of defective computer chips of a particular type from two different
manufacturers.
a.
True
b.
False
11. The analyst gets to choose the significance level . It is typically chosen to be 0.50, but it is occasionally chosen to be
Name:
Class:
Date:
chapter 9
0.05.
a.
True
b.
False
12. A chi-square goodness-of-fit test can be used to test for normality.
a.
True
b.
False
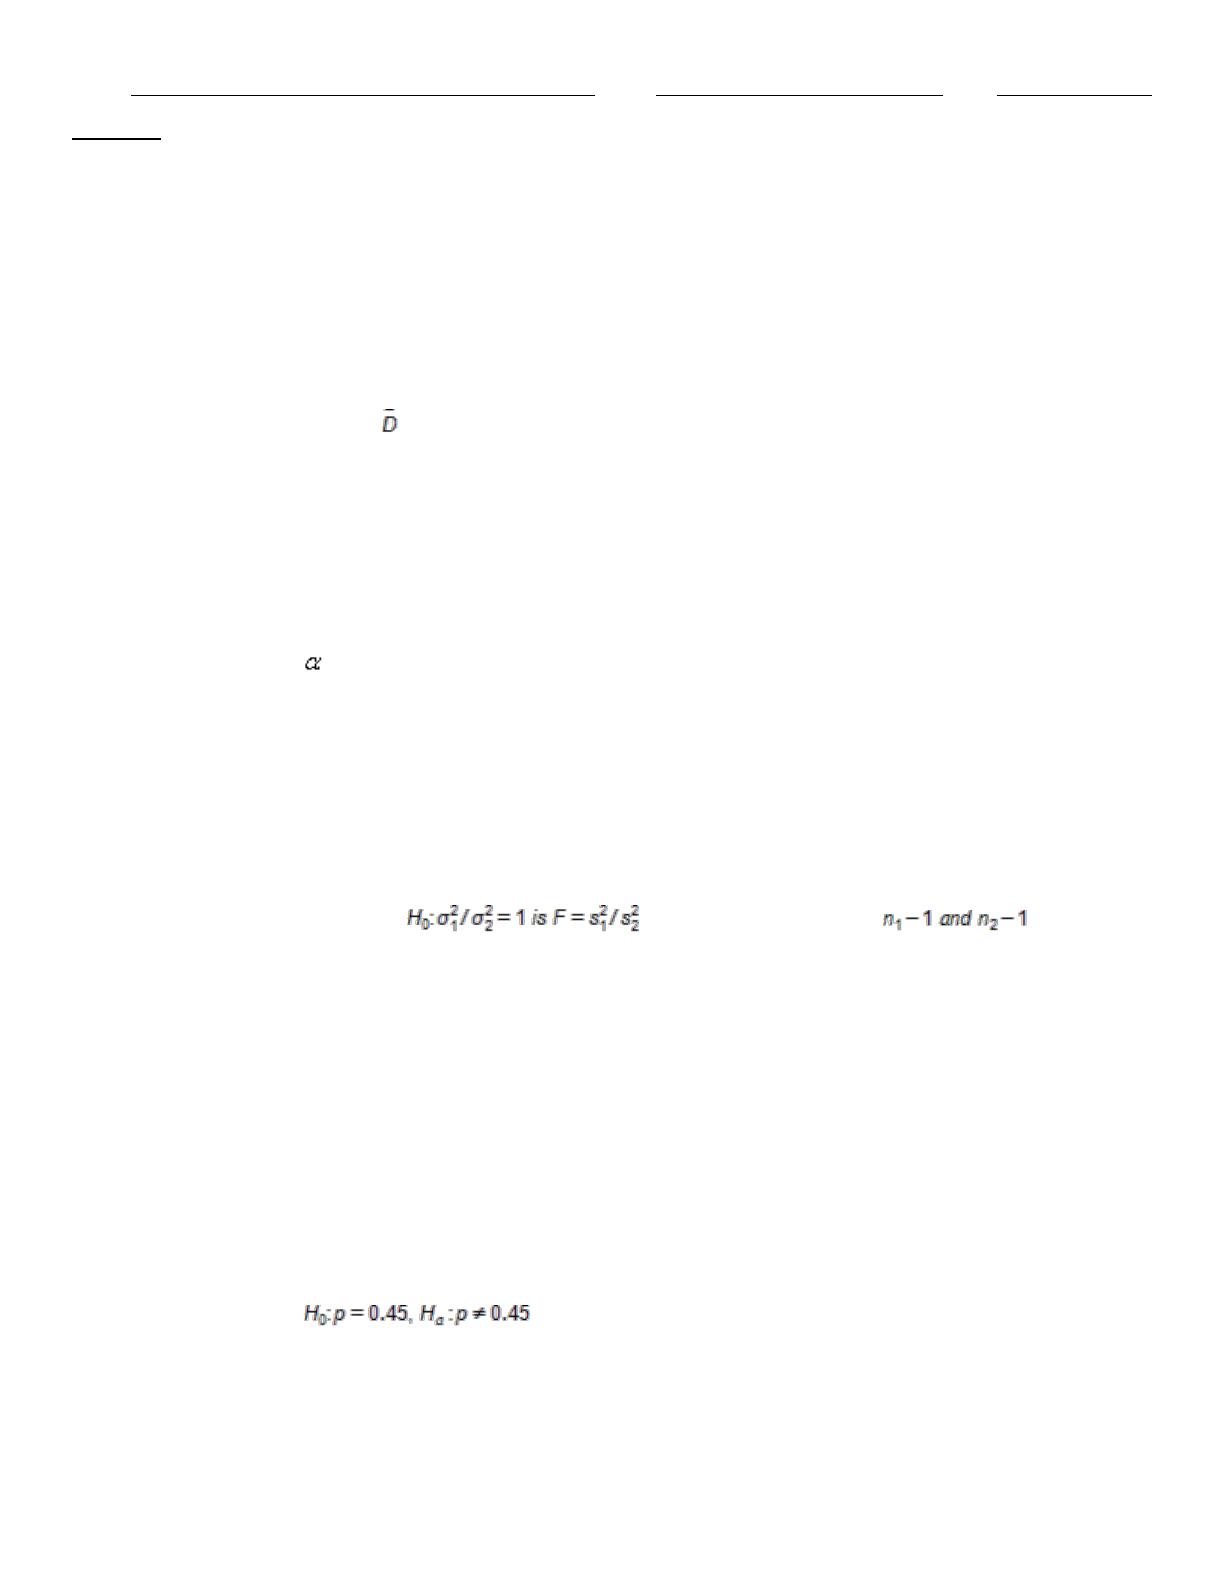
13. In conducting hypothesis testing for difference between two means when samples are dependent (paired samples),
the variable under consideration is ; the sample mean difference between the pairs.
a.
True
b.
False
14. A one-tailed alternative is one that is supported by evidence in either direction.
a.
True
b.
False
15. The significance level also determines the rejection region.
a.
True
b.
False
16. The p-value of a test is the probability of observing a test statistic at least as extreme as the one computed given that
the null hypothesis is true.
a.
True
b.
False
17. The test statistic employed to test , which is F distributed with degrees of
freedom.
a.
True
b.
False
18. A test with a 0.05 significance level has a larger rejection region than a test with a 0.01 significance level.
a.
True
b.
False
19. Tests in which samples are not independent are referred to as matched pairs or paired samples.
a.
True
b.
False
20. A professor of statistics refutes the claim that the proportion of Republican voters in Michigan is at most 45%. To test
the claim, the hypotheses: , should be used.
a.
True
b.
False
21. The test statistic for a hypothesis test of a population proportion is the z-value.
a.
True

Name:
Class:
Date:
chapter 9
b.
False
22. A test with a 0.10 significance level has a larger rejection region than a test with a 0.05 significance level.
a.
True
b.
False
23. An alternative or research hypothesis is usually the hypothesis a researcher wants to prove.
a.
True
b.
False
24. Type I errors are usually considered more “costly” although this can lead to conservative decision making.
a.
True
b.
False
25. A Type II error is committed when we incorrectly accept an alternative hypothesis that is false.
a.
True
b.
False
26. An alternative hypothesis can have the signs >, <, or ≠.
a.
True
b.
False
27. A Type I error probability is represented by ; it is the probability of incorrectly rejecting a null hypothesis that is true.
a.
True
b.
False
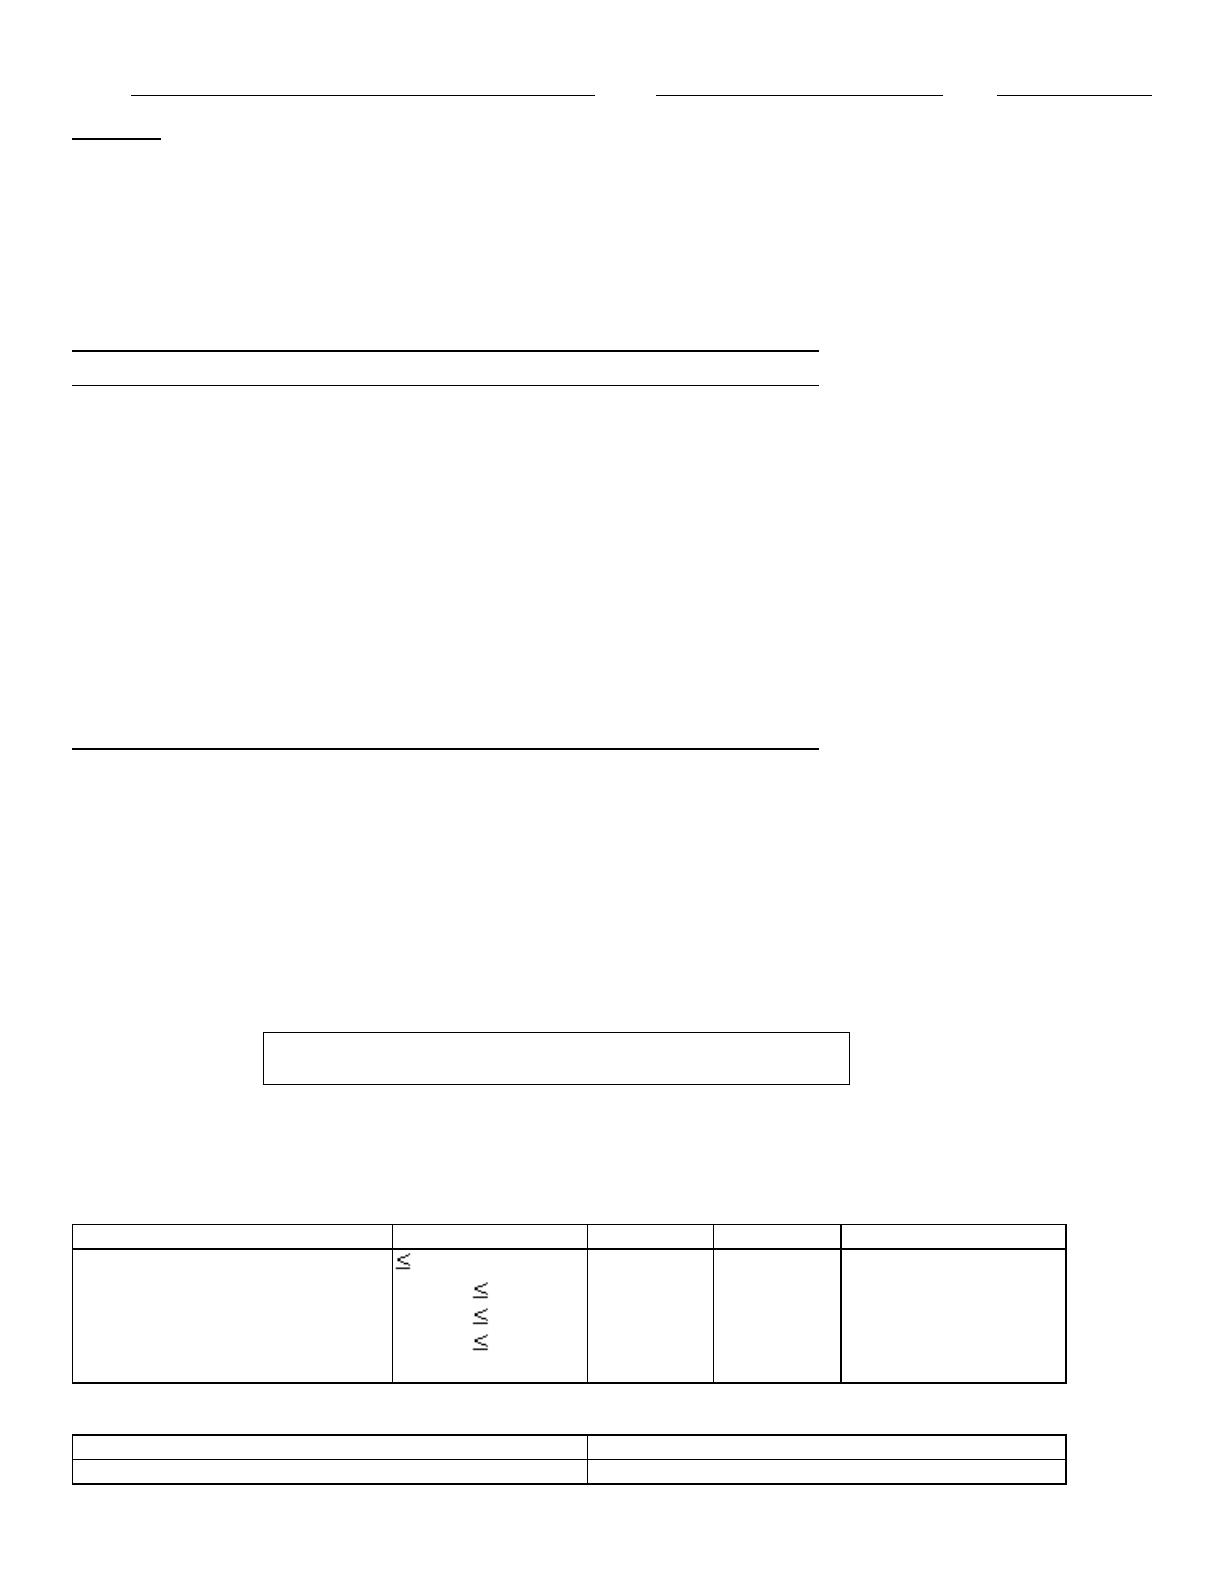
28. A test for independence is applied to a contingency table with 4 rows and 4 columns. The degrees of freedom for this
chi-square test must equal 9.
a.
True
b.
False
29. A Q-Q plot can be used to test for normality.
a.
True
b.
False
30. The power of a test is the probability of rejecting the null hypothesis when the alternative hypothesis is true.
a.
True
b.
False
31. Lilliefors test for normality compare two cumulative distribution functions (cdf’s): the cdf from a normal distribution and
the cdf corresponding to the given data (called the empirical cdf).
a.
True
b.
False
32. A null hypothesis is a statement about the value of a population parameter. It is usually the current thinking, or “status
quo”.
a.
True

Name:
Class:
Date:
chapter 9
b.
False
33. The p-value of a test is the smallest level of significance at which the null hypothesis can be rejected.
a.
True
b.
False
34. In testing the difference between two population means using two independent samples, we use the pooled variance
in estimating the standard error of the sampling distribution of the sample mean difference if the populations are
normal with equal variances.
a.
True
b.
False
Indicate the answer choice that best completes the statement or answers the question.
35. A null hypothesis can only be rejected at the 10% significance level if and only if:
a.
a 90% confidence interval includes the hypothesized value of the parameter
b.
a 90% confidence interval does not include the hypothesized value of the parameter
c.
the null hypothesis is biased
d.
the null hypotheses includes sampling error
36. The null hypothesis usually represents the:
a.
theory the researcher would like to prove.
b.
preconceived ideas of the researcher
c.
perceptions of the sample population
d.
status quo
37. The form of the alternative hypothesis can be:
a.
one-tailed
b.
two-tailed
c.
neither one nor two-tailed
d.
one or two-tailed
38. Which of the following statements are true regarding the chi–square goodness–of-fit test for normality?
a.
The test does depend on which and how many categories we use for the histogram.
b.
The test is not very effective unless the sample size is large, say, at least 80 or 100.
c.
The test tends to be too sensitive if the sample size is really large.
d.
None of these options
e.
All of these options
39. The idea of the chi–square test for independence is to:
a.
compare the quantile-quantile (Q–Q) plot with what would be expected under independence
b.
compare the actual counts in a contingency table with what would be expected under independence
c.
compare the cumulative distribution with what would be expected under independence
d.
None of these options
40. Which of the following signs is possible in an alternative hypothesis?
a.
>
b.
<
c.
≠

Name:
Class:
Date:
chapter 9
d.
All of these options
41. Which of the following values is not typically used for ?
a.
0.01
b.
0.05
c.
0.10
d.
0.50
42. Larger p-values indicate more evidence in support of the:
a.
null hypothesis
b.
alternative hypothesis
c.
quality of the researcher
d.
None of these options
43. An informal test for normality that utilizes a scatterplot and looks for clustering around a 45° line is known as a(n):
a.
Lilliefors test
b.
empirical cumulative distribution function
c.
p-test
d.
quantile-quantile plot
44. One-tailed alternatives are phrased in terms of:
a.
≠
b.
< or >
c.
=
d.
45. Of type I and type II error, which is traditionally regarded as more serious?
a.
Type I
b.
Type II
c.
Type I and Type II are equally serious
d.
Neither Type I or Type II is serious and both can be avoided
46. The test statistic in a hypothesis test for a population proportion is
a.
t-value calculated from the sample
b.
z-value calculated from the sample
c.
F-value calculated from the sample
d.
the sample proportion
47. The value set for is known as:
a.
the rejection level
b.
the acceptance level
c.
the significance level
d.
the error in the hypothesis test
48. The alternative hypothesis is also known as the:
a.
elective hypothesis
b.
optional hypothesis
c.
research hypothesis
d.
null hypothesis
49. Which of the following values is typically used for ?
a.
0.50
b.
0.40
c.
0.30
d.
0.10
50. The p–value of a sample is the probability of seeing a sample with
a.
at most as much evidence in favor of the null hypothesis as the sample actually observed.
b.
at most as much evidence in favor of the alternative hypothesis as the sample actually observed.
c.
at least as much evidence in favor of the null hypothesis as the sample actually observed.
d.
at least as much evidence in favor of the alternative hypothesis as the sample actually observed.

Name:
Class:
Date:
chapter 9
51. The hypothesis that an analyst is trying to prove is called the:
a.
elective hypothesis
b.
alternative hypothesis
c.
optional hypothesis
d.
null hypothesis
52. Which of the following statements are true of the null and alternative hypotheses?
a.
Exactly one hypothesis must be true
b.
Both hypotheses must be true
c.
It is possible for both hypotheses to be true
d.
It is possible for neither hypothesis to be true
53. The null and alternative hypotheses divide all possibilities into:
a.
two sets that overlap
b.
two non-overlapping sets
c.
two sets that may or may not overlap
d.
as many sets as necessary to cover all possibilities
54. The chi-square goodness–of-fit test can be used to test for:
a.
significance of sample statistics
b.
difference between population means
c.
normality
d.
difference between population variances
55. A type II error occurs when:
a.
the null hypothesis is incorrectly accepted when it is false
b.
the null hypothesis is incorrectly rejected when it is true
c.
the sample mean differs from the population mean
d.
the test is biased
56. If a teacher is trying to prove that new method of teaching economics is more effective than traditional one, he/she will
conduct a:
a.
one-tailed test
b.
two-tailed test
c.
point estimate of the population parameter
d.
confidence interval
57. The power of a test is the probability that we
a.
reject the null hypothesis when the alternative hypothesis is false
b.
reject the null hypothesis when the alternative hypothesis is true
c.
accept the null hypothesis when the alternative hypothesis is false
d.
accept the null hypothesis when the alternative hypothesis is true
58. A null hypothesis can only be rejected at the 5% significance level if and only if:
a.
a 95% confidence interval includes the hypothesized value of the parameter
b.
a 95% confidence interval does not include the hypothesized value of the parameter
c.
the null hypothesis is biased
d.
the null hypotheses includes sampling error
59. A type I error occurs when the:

Name:
Class:
Date:
chapter 9
a.
null hypothesis is incorrectly accepted when it is false
b.
null hypothesis is incorrectly rejected when it is true
c.
sample mean differs from the population mean
d.
test is biased
60. A two-tailed test is one where:
a.
results in only one direction can lead to rejection of the null hypothesis
b.
negative sample means lead to rejection of the null hypothesis
c.
results in either of two directions can lead to rejection of the null hypothesis
d.
no results lead to the rejection of the null hypothesis
61. In statistical analysis, the burden of proof lies traditionally with the:
a.
alternative hypothesis
b.
null hypothesis
c.
analyst
d.
facts presented to the statistical analyst
62. Which pair of the following tests is used to test for normality?
a.
A t-test and an ANOVA test
b.
An Empirical cumulative distribution function test and an F-test
c.
A Chi-Square test and a Lilliefors test
d.
A Quantile-Quantile plot and a p-value test
63. A p-value is considered “convincing” if it is:
a.
less than 0.01
b.
between 0.01 and 0.05
c.
between 0.05 and 0.10
d.
greater than 0.10
64. Smaller p-values indicate more evidence in support of the:
a.
null hypothesis
b.
alternative hypothesis
c.
quality of the researcher
d.
None of these options
65. A statistics professor has just given a final examination in his linear models course. He is particularly interested in
determining whether the distribution of 50 exam scores is normally distributed. The data are shown in the table below.
Perform the Lilliefors test. Report and interpret the results of the test.
77
71
83
78
84
71
81
82
79
71
73
89
74
75
93
74
88
83
90
82
79
62
73
88
76
76
76
80
84
84
91
70
76
74
68
80
87
92
84
79
80
91
74
69
88
84
83
87
82
72
Do graduates of undergraduate business programs with different majors tend to earn disparate starting salaries? Below
Name:
Class:
Date:
chapter 9
you will find output from an analysis for randomly selected graduates with majors in accounting (Acct) and marketing
(Mktg).
t-Test: Two-Sample Assuming Unequal Variances
Acct.
Mktg
Mean
51380
47915.6
Variance
170545600
219754013.4
Observations
6
6
Hypothesized Mean Difference
0
df
10
t Stat
0.430
P(T<=t) one-tail
0.338
t Critical one-tail
1.812
P(T<=t) two-tail
0.677
t Critical two-tail
2.228
66. Assuming that the variances of the underlying populations are unequal, can you reject at a 5% significance level that
the mean starting salaries for accounting and marketing majors are the same? Explain why or why not?
67. A sport preference poll yielded the following data for men and women. Use the 5% significance level and test to
determine if sport preference and gender are independent.
Sport Preference
Gender
Basketball
Football
Soccer
Men
20
25
30
75
Women
18
12
15
45
38
37
45
120
An automobile manufacturer needs to buy aluminum sheets with an average thickness of 0.05 inch. The manufacturer
collects a random sample of 40 sheets from a potential supplier. The thickness of each sheet in this sample is measured
(in inches) and recorded. The information below pertains to the Chi-square goodness-of–fit test.
Upper limit
Category
Frequency
Normal
Distance measure
0.03
0.03
1
1.920
0.441
0.04
0.03 but 0.04
10
8.074
0.459
0.05
0.04 but 0.05
13
14.947
0.254
0.06
0.05 but 0.06
12
11.218
0.055
>0.06
4
3.842
0.007
Test of normal fit
Chi-square statistic
1.214
p-value
0.545
Name:
Class:
Date:
chapter 9
68. (A) Are these measurements normally distributed? Summarize your results.
(B) Are there any weaknesses or concerns about your conclusions in (A)? Explain
Q-Mart is interested in comparing customers who used its own charge card with those who use other types of credit
cards. Q-Mart would like to know if customers who use the Q-Mart card spend more money per visit, on average, than
customers who use some other type of credit card. They have collected information on a random sample of 38 charge
customers and the data is presented below. On average, the person using a Q-Mart card spends $192.81 per visit and
customers using another type of card spend $104.47 per visit.
Summary statistics for two samples
Q-Mart
Other Charges
Sample sizes
13
25
Sample means
192.81
104.47
Sample standard deviations
115.243
71.139
Test of difference = 0
Sample mean difference
88.34
Pooled standard deviation
88.323
Std error of difference
30.201
t-test statistic
2.925
p-value
0.006
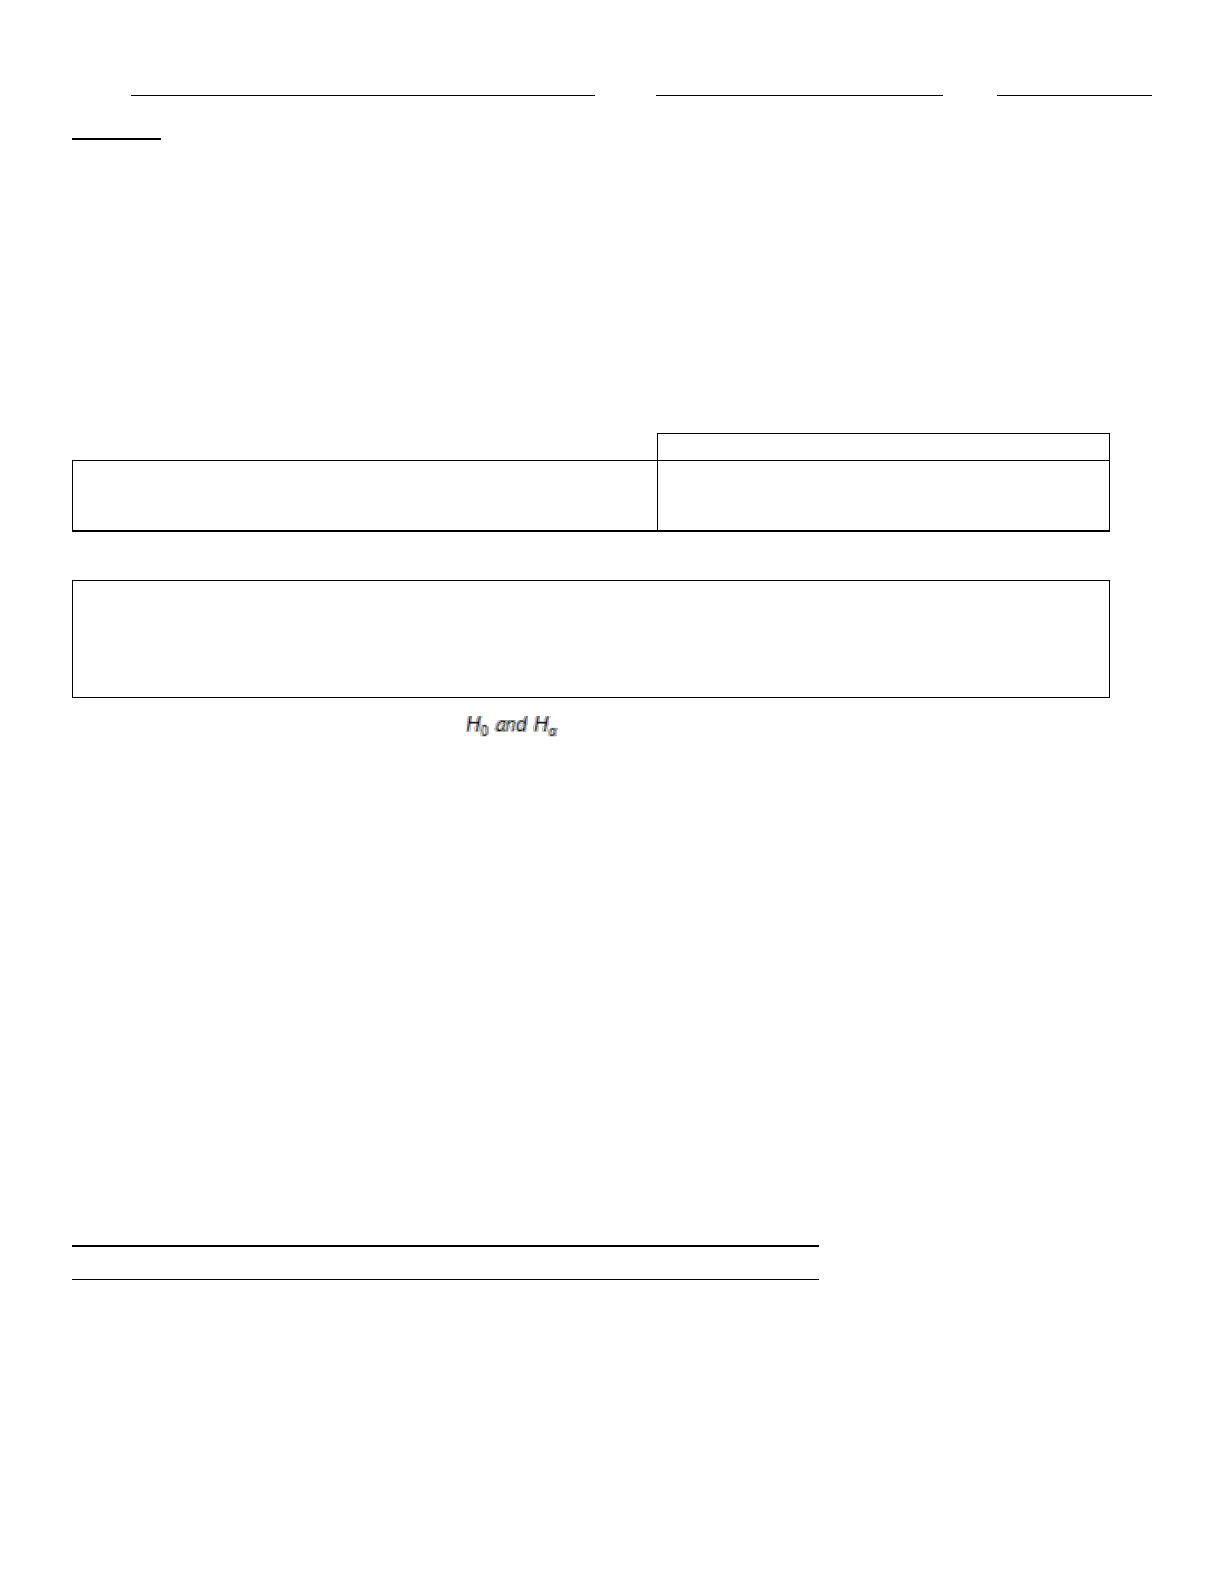
69. (A) Given the information above, what is for this comparison? Also, does this represent a one-tailed or a
two-tailed test? Explain your answer.
(B) What are the degrees of freedom for the t-statistic in this calculation? Explain how you would calculate the
degrees of freedom in this case.
(C) What is the assumption in this case that allows you to use the pooled standard deviation for this test?
(D) Using a 5% level of significance, is there sufficient evidence for Q-Mart to conclude that customers who use the Q-Mart card
charge, on average, more than those who use another charge card? Explain your answer.
(E) Using a 1% level of significance, is there sufficient evidence for Q-Mart to conclude that customers who use the Q-Mart card
charge, on average, more than those who use another charge card? Explain your answer.
Do graduates of undergraduate business programs with different majors tend to earn disparate starting salaries? Below
you will find output from an analysis for randomly selected graduates with majors in accounting (Acct) and marketing
(Mktg).
t-Test: Two-Sample Assuming Unequal Variances
Acct.
Mktg
Mean
51380
47915.6
Variance
170545600
219754013.4
Observations
6
6
Hypothesized Mean Difference
0
df
10
Name:
Class:
Date:
chapter 9
t Stat
0.430
P(T<=t) one-tail
0.338
t Critical one-tail
1.812
P(T<=t) two-tail
0.677
t Critical two-tail
2.228
70. If instead the test is conducted at the 0.10 significance level, would the decision regarding the salaries in question 84
change? Explain why or why not? Answer this question without re-running the hypothesis test.
71. An investor wants to compare the risks associated with two different stocks. One way to measure the risk of a given
stock is to measure the variation in the stock’s daily price changes. The investor obtains a random sample of 20 daily
price changes for stock 1 and 20 daily price changes for stock 2. These data are shown in the table below. Show how this
investor can compare the risks associated with the two stocks by testing the null hypothesis that the variances of the
stocks are equal. Use = 0.10 and interpret the results of the statistical test.
Day
Price Change
for stock 1
Price Change
for stock 2
1
1.86
0.87
2
1.80
1.33
3
1.03
–0.27
4
0.16
–0.20
5
–0.73
0.25
6
0.90
0.00
7
0.09
0.09
8
0.19
–0.71
9
–0.42
–0.33
10
0.56
0.12
11
1.24
0.43
12
–1.16
–0.23
13
0.37
0.70
14
–0.52
–0.24
15
–0.09
–0.59
16
1.07
0.24
17
–0.88
0.66
18
0.44
–0.54
19
–0.21
0.55
20
0.84
0.08
72. An insurance firm interviewed a random sample of 600 college students to find out the type of life insurance preferred,
if any. The results are shown in the table below. Is there evidence that life insurance preference of male students is
different than that of female students. Test at the 5% significance level.
Insurance Preference
Gender
Term
Whole Life
No Insurance
Male
80
30
240
350
Female
50
40
160
250
130
70
400
600
In a survey of 1,500 customers who did holiday shopping on line during the 2000 holiday season, 270 indicated that they
were not satisfied with their experience. Of the customers that were not satisfied, 143 indicated that they did not receive
Name:
Class:
Date:
chapter 9
the products in time for the holidays, while 1,197 of the customers that were satisfied with their experience indicated that
they did receive the products in time for the holidays. The following complete summary of results was reported:
Satisfied with their
experience
Yes
(in time)
No
(not in time)
Total
Yes
1,197
33
1,230
No
127
143
270
Total
1,324
176
1,500
73. (A) Is there a significant difference in satisfaction between those who received their products in time for the holidays,
and those who did not receive their products in time for the holidays? Test at the 0.01 level of significance.
(B) Find the p-value associated with the test in part (A) and interpret its meaning.
(C) Based on the results of (A) and (B), if you were the marketing director of a company selling products online, what would you do
to improve the satisfaction of the customers?
A real estate agency wants to compare the appraised values of single-family homes in two cities in Michigan. A sample of
60 listings in Lansing and 99 listings in Grand Rapids yields the following results (in thousands of dollars):
Lansing
Big Rapids
191.33
172.34
s
32.60
16.92
n
60
99
74. (A) Is there evidence of a significant difference in the average appraised values for single-family homes in the two
Michigan cities? Use 0.05 level of significance.
(B) Have any of the assumptions made in (A) been violated? Explain.
(C) Construct a 95% confidence interval estimate of the difference between the population means of Lansing
and Grand Rapids.
(D) Explain how to use the confidence interval in (C) to answer (A).
The owner of a popular Internet-based auction site believes that more than half of the people who sell items on her site
are women. To test this hypothesis, the owner sampled 1000 customers who sold items on her site and she found that
53% of the customers sampled were women. Some calculations are shown in the table below
Sample proportion
0.53
Standard error of sample proportion
0.01578
Z test statistic
1.9008
p-value
0.0287
75. (A) If you were to conduct a hypothesis test to determine if greater than 50% of customers who use this Internet-based
site are women, would you conduct a one-tail or a two-tail hypothesis test? Explain your answer, and state the appropriate
null and alternative hypotheses.
(B) How many customers out of the 1000 sampled must have been women in this case?
(C) Using a 5% significance level, can the owner of this site conclude that women make up more than 50% of
her customers? Explain your answer.
(D) If you were to use a 1% significance level, would the conclusion from (C) change? Explain your answer.
The manager of a consulting firm in Lansing, Michigan, is trying to assess the effectiveness of computer skills training
given to all new entry-level professionals. In an effort to make such an assessment, he administers a computer skills test
immediately before and after the training program to each of 20 randomly chosen employees. The pre-training and post-

Name:
Class:
Date:
chapter 9
training scores of these 20 individuals are shown in the table below.
Employee
Score before
Score after
1
62
77
2
63
77
3
74
83
4
64
88
5
84
80
6
81
80
7
54
83
8
61
88
9
81
80
10
86
88
11
75
93
12
71
78
13
86
82
14
74
84
15
65
86
16
90
89
17
72
81
18
71
90
19
85
86
20
66
92
76. (A) Is this two-sample data or paired data. Explain your answer.
(B) Specify an appropriate hypothesis test.
(C) Using a 10% level of significance, do the given sample data support that the firm’s training programs is
effective in increasing the new employee’s computer skills?
(D) Using a 1% level of significance, do the given sample data support that the firm’s training programs is
effective in increasing the new employee’s working knowledge of computing?
The charitable foundation for a large metropolitan hospital is conducting a study to characterize its donor base. In the
past, most donations have come from relatively wealthy individuals; the average annual donor income in the most recent
survey was right at $100,000. The foundation believes the average has now increased. A random sample of 200 current
donors showed a mean annual income of $103,157 and a standard deviation of $27,498.
77. (A) Specify a hypothesis test to test the foundation’s claim
(B) Compared to the most recent survey, is this sample evidence statistically significant at the 10% level?
(C) Compared to the most recent survey, is this sample evidence statistically significant at the 5% level?
(D) Report and interpret the p-value for this test
(E) Interpret the overall test for the foundation.
The CEO of a software company is committed to expanding the proportion of highly qualified women in the organization’s
staff of salespersons. He believes that the proportion of women in similar sales positions across the country in 2004 is
less than 45%. Hoping to find support for his belief, he directs his assistant to collect a random sample of salespersons
employed by his company, which is thought to be representative of sales staffs of competing organizations in the industry.
The collected random sample of size 50 showed that only 18 were women.
78. (A) State the appropriate null and alternative hypotheses in this situation.
(B) Test this CEO’s belief at the =.05 significance level and report the p-value. Do you find statistical support for

Name:
Class:
Date:
chapter 9
his hypothesis that the proportion of women in similar sales positions across the country is less than 40%?
(C) Suppose the sample size above is 100, instead of 50, and the sample proportion is again 0.36. Would this change your results in
(B)? Explain your answer.
A study is performed in San Antonio to determine whether the average weekly grocery bill per five-person family in the
town is significantly different from the national average. A random sample of 50 five-person families in San Antonio
showed a mean of $133.474 and a standard deviation of $11.193.
79. (A) Assume that the national average weekly grocery bill for a five-person family is $131. Is the sample evidence
statistically significant? If so, at what significance levels can you reject the null hypothesis?
(B) For which values of the sample mean (i.e., average weekly grocery bill) would you decide to reject the null
hypothesis at the significance level? For which values of the sample mean would you decide to reject
the null hypothesis at the 10% level of significance?
Do graduates of undergraduate business programs with different majors tend to earn disparate starting salaries? Below
you will find output from an analysis for randomly selected graduates with majors in accounting (Acct) and marketing
(Mktg).
t-Test: Two-Sample Assuming Unequal Variances
Acct.
Mktg
Mean
51380
47915.6
Variance
170545600
219754013.4
Observations
6
6
Hypothesized Mean Difference
0
df
10
t Stat
0.430
P(T<=t) one-tail
0.338
t Critical one-tail
1.812
P(T<=t) two-tail
0.677
t Critical two-tail
2.228
80. If instead the variances in the underlying populations in question 84 are equal, would the decision regarding the
salaries change? Explain why or why not? Answer this question without re-running the hypothesis test.
Two teams of workers assemble automobile engines at a manufacturing plant in Michigan. A random sample of 145
assemblies from team 1 shows 15 unacceptable assemblies. A similar random sample of 125 assemblies from team 2
shows 8 unacceptable assemblies.
81. (A) Construct a 90% confidence interval for the difference between the proportions of unacceptable assemblies
generated by the two teams.

Name:
Class:
Date:
chapter 9
(B) Based on the confidence interval constructed in (A), is there sufficient evidence to conclude, at the 10%
significance level, that the two teams differ with respect to their proportions of unacceptable assemblies?
(C) Is there sufficient evidence to conclude, at the 10% significance level, that the two teams differ with respect
to their proportions of unacceptable assemblies? Conduct the appropriate hypothesis test.
(D) Calculate the p-value and explain how to use it for testing the null hypothesis of equal proportion.
The retailing manager of Meijer supermarket chain in Michigan wants to determine whether product location has any
effect on the sale of children toys. Two different aisle locations are considered: front and rear. A random sample of 18
stores is selected, with 6 stores randomly assigned to each aisle location. The size of the display area and price of the
product are constant for all the stores. At the end of one-month trial period, the sales volumes (in thousands of dollars) of
the product in each store were as shown below:
Front Aisle
Rear Aisle
10.0
6.0
8.6
7.4
6.8
5.4
7.6
4.2
6.4
3.6
5.4
4.2
82. At the 0.05 level of significance, is there evidence of a significant difference in average sales among the various aisle
locations?
A marketing research consultant hired by Coca-Cola is interested in determining if the proportion of customers who prefer
Coke to other brands is over 50%. A random sample of 200 consumers was selected from the market under investigation,
55% favored Coca-Cola over other brands. Additional information is presented below.
Sample proportion
0.55
Standard error of sample proportion
0.03518
Z test statistic
1.4213
p-value
0.07761
83. (A) If you were to conduct a hypothesis test to determine if greater than 50% of customers prefer Coca-Cola to other
brands, would you conduct a one-tail or a two-tail hypothesis test? Explain your answer.
(B) How many customers out of the 200 sampled must have favored Coke in this case?
(C) Using a 5% significance level, can the marketing consultant conclude that the proportion of customers who
prefer Coca-Cola exceeds 50%? Explain your answer.
(D) If you were to use a 1% significance level, would the conclusion from (C) change? Explain your answer.
84. A recent study of educational levels of 1000 voters and their political party affiliations in a Midwestern state showed
the results given in the table below. Use = .10 and test to determine if party affiliation is independent of the educational
level of the voters.
Party Affiliation
Educational Level
Democrat
Republican
Independent
Didn’t Complete High School
95
80
115
290
Name:
Class:
Date:
chapter 9
Has High School Diploma
135
85
105
325
Has College Degree
160
105
120
385
390
270
340
1000
85. The number of cars sold by three salespersons over a 6-month period are shown in the table below. Use the 5% level
of significance to test for independence of salespersons and type of car sold.
Insurance Preference
Chevrolet
Ford
Toyota
Ali
15
9
5
29
Bill
20
8
15
43
Chad
13
4
11
28
48
21
31
100
Suppose a firm that produces light bulbs wants to know whether it can say that its light bulbs typically last more than 1500
hours. Hoping to find support for their claim, the firm collects a random sample and records the lifetime (in hours) of each
bulb. The information related to the hypothesis test is presented below.
Test of 1500 versus one-tailed alternative
Hypothesized mean
1500.0
Sample mean
1509.5
Std error of mean
4.854
Degrees of freedom
24
t-test statistic
1.953
p-value
0.031
86. (A) Can the sample size be determined from the information above? Yes or no? If yes, what is the sample size in this
case?
(B) The firm believes that the mean life is actually greater than 1500 hours, should you conduct a one-tailed or
a two-tailed hypothesis test? Explain your answer, and state the appropriate null and alternative hypotheses.
(C) What is the sample mean of this data? If you use a 5% significance level, would you conclude that the
mean life of the light bulbs is typically more than 1500 hours? Explain your answer.
(D) If you were to use a 1% significance level in this case, would you conclude that the mean life of the light
bulbs is typically more than 1500 hours? Explain your answer.
Do undergraduate business students who major in information systems (IS) earn, on average, higher annual starting
salaries than their peers who major in marketing (Mktg)? To address this question with a statistical hypothesis test, a
comparison should be done to determine whether the variances of annual starting salaries of the two types of majors are
equal. Below you will find output from a test of 20 randomly selected IS majors and 20 randomly selected Mktg majors.
Summary statistics for two samples
IS Salary
Mktg Salary
Sample sizes
20
20
Sample means
30401.35
27715.85
Sample standard deviations
1937.52
2983.39
Test of difference 0 Results if Results if
Sample mean difference
2685.5
Pooled standard deviation
2515.41
NA
Std error of difference
795.44
795.44
Degrees of freedom
38
33
t-test statistic
3.376
3.376

Name:
Class:
Date:
chapter 9
p-value
0.0009
0.0009
Test of equality of variances
Ratio of sample variances
2.371
p-value
0.034
87. (A) Use the information above to perform the test of equal variance. Explain how the ratio of sample variances is
calculated. What type of distribution is used to test for equal variances? Also, would you conclude that the variances are
equal or not? Explain.
(B) Based on your conclusion in (A), which test statistic should be used in performing a test for the existence of
a difference between population means?
(C) Using a 5% level of significance, is there sufficient evidence to conclude that IS majors earn, on average, a
higher annual starting salaries than their peers who major in Mktg?
(D) Using a 1% level of significance, is there sufficient evidence to conclude that IS majors earn, on average, a
higher annual starting salaries than their peers who major in Mktg? Explain your answer.

Name:
Class:
Date:
chapter 9
Answer Key

Name:
Class:
Date:
chapter 9
Name:
Class:
Date:
chapter 9
Name:
Class:
Date:
chapter 9
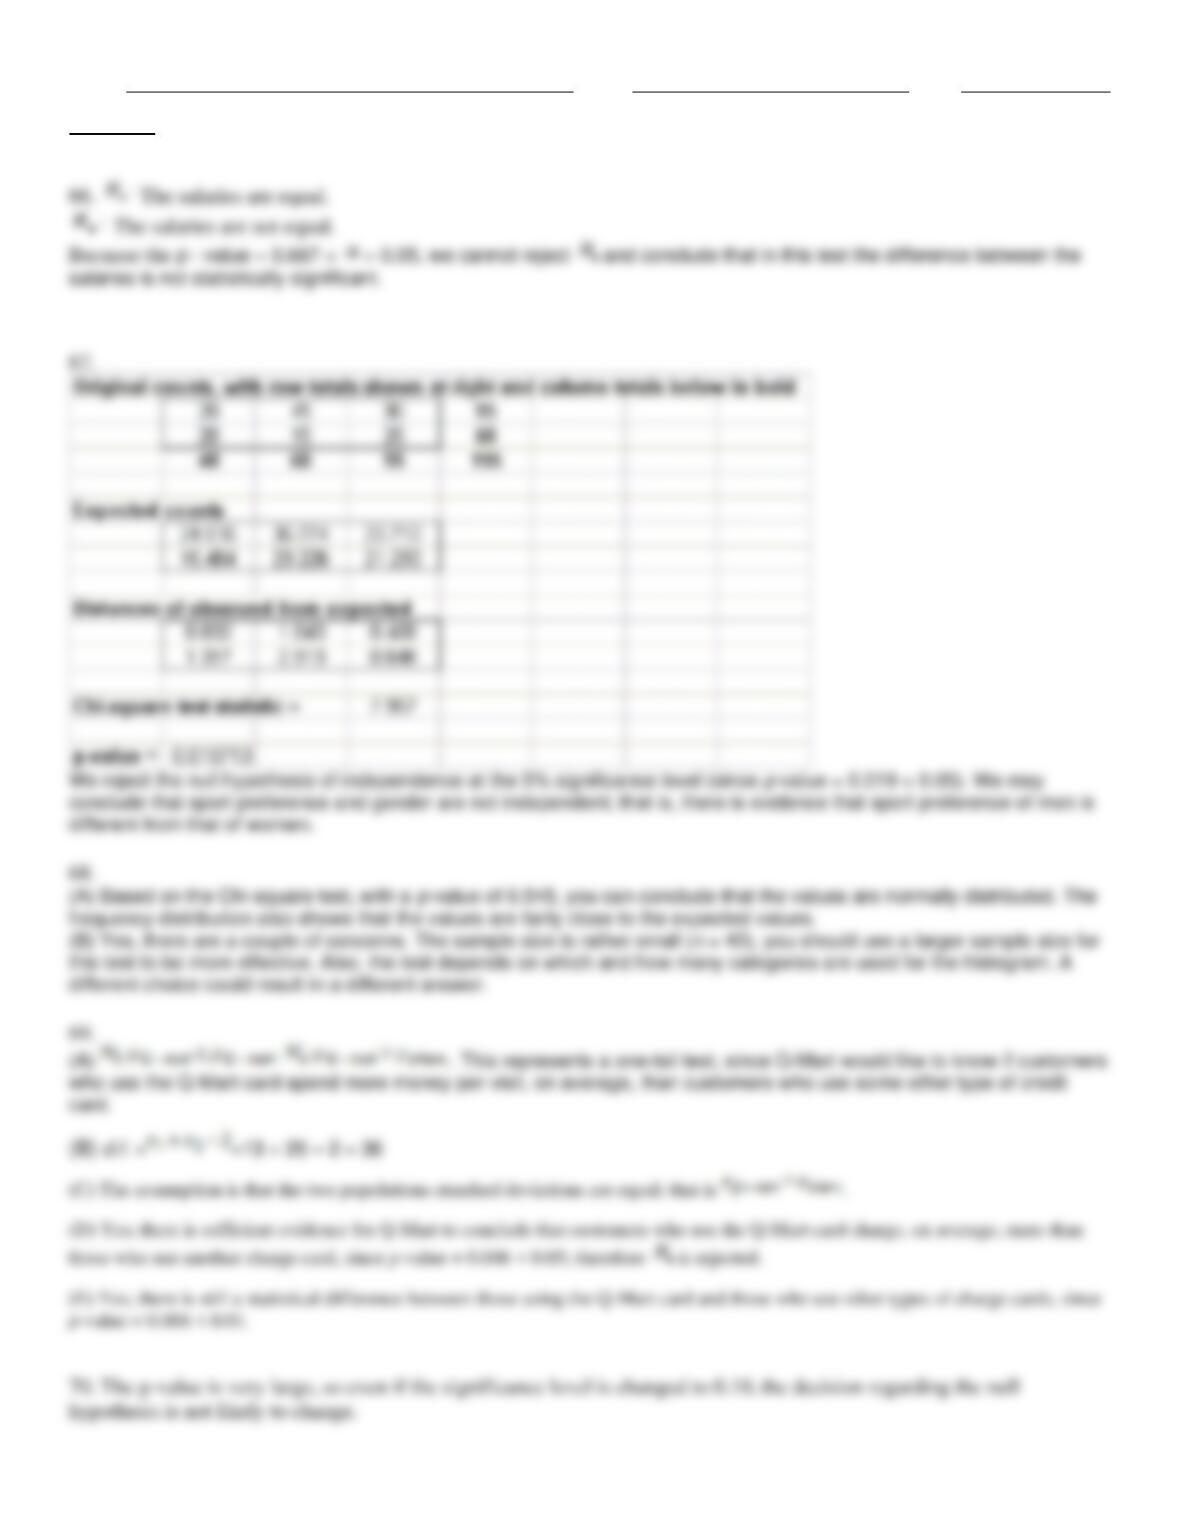
different from that of women.
different choice could result in a different answer.
Name:
Class:
Date:
chapter 9
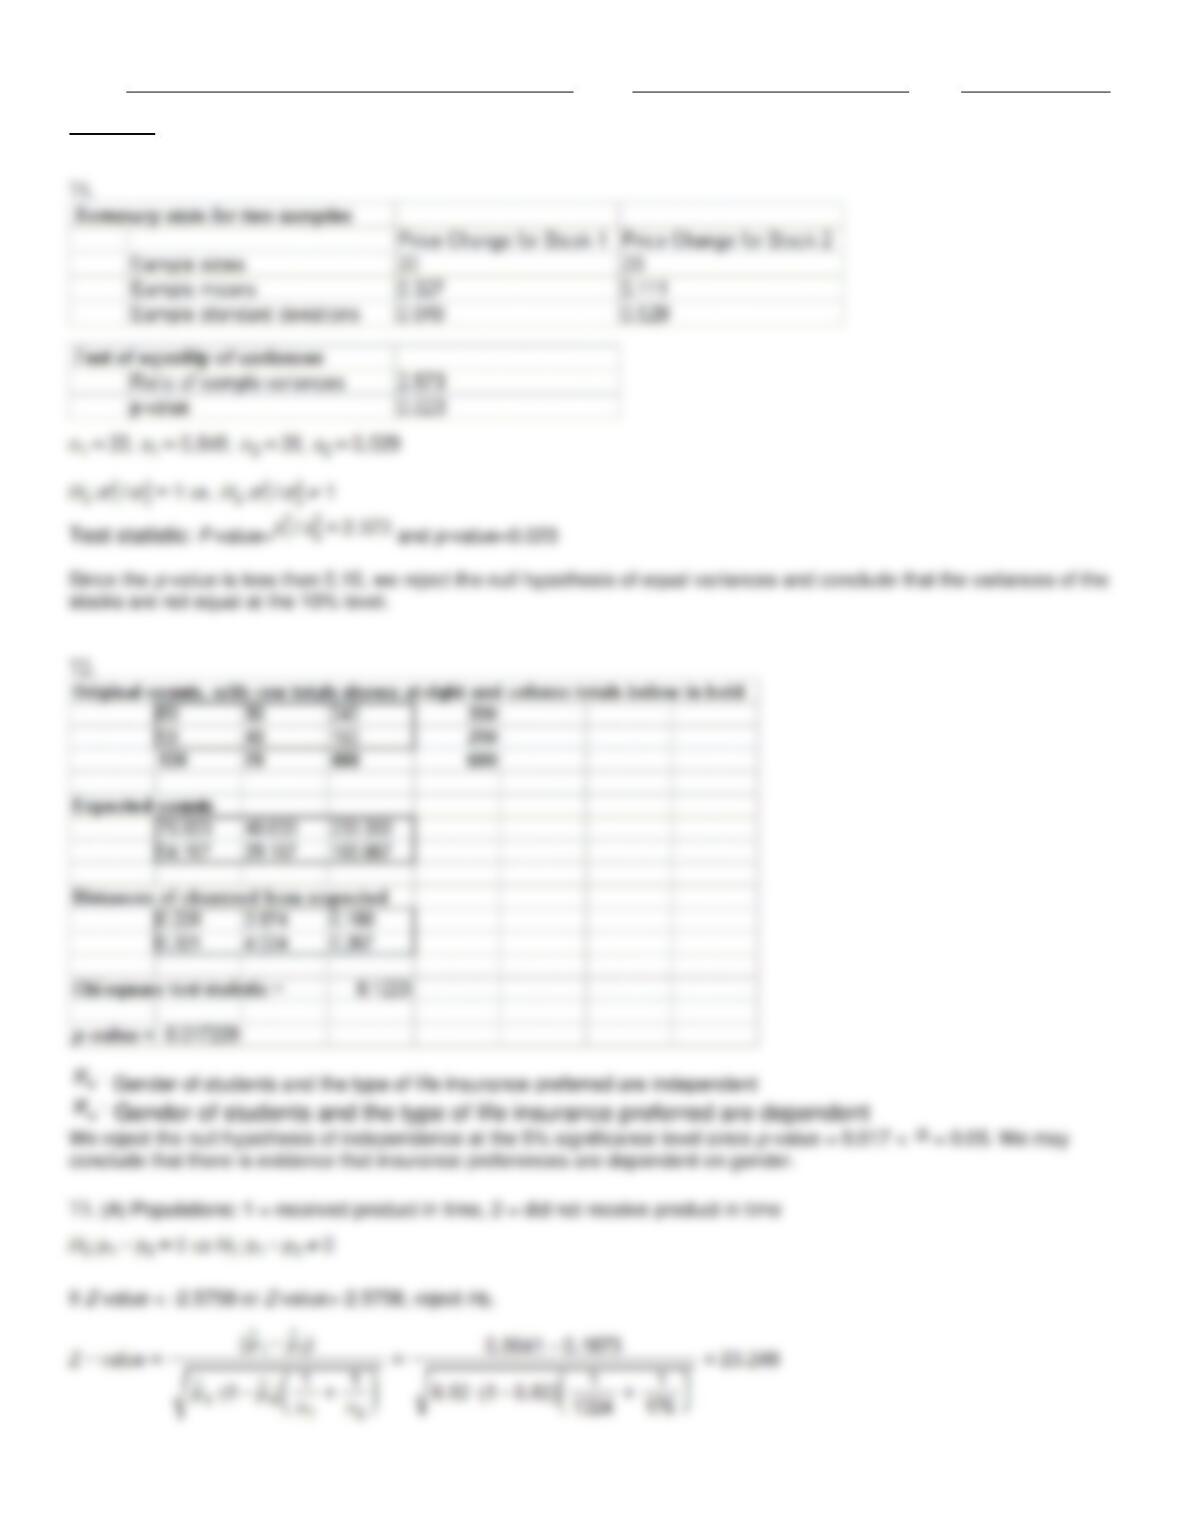
conclude that there is evidence that insurance preferences are dependent on gender.
Name:
Class:
Date:
chapter 9
Name:
Class:
Date:
chapter 9
Name:
Class:
Date:
chapter 9
2.680
126.758
135.242
1.677
128.346
133.654
Name:
Class:
Date:
chapter 9
Name:
Class:
Date:
chapter 9
Name:
Class:
Date:
chapter 9
> 0.05). We may conclude that salespersons and type of car sold are independent.