9-12
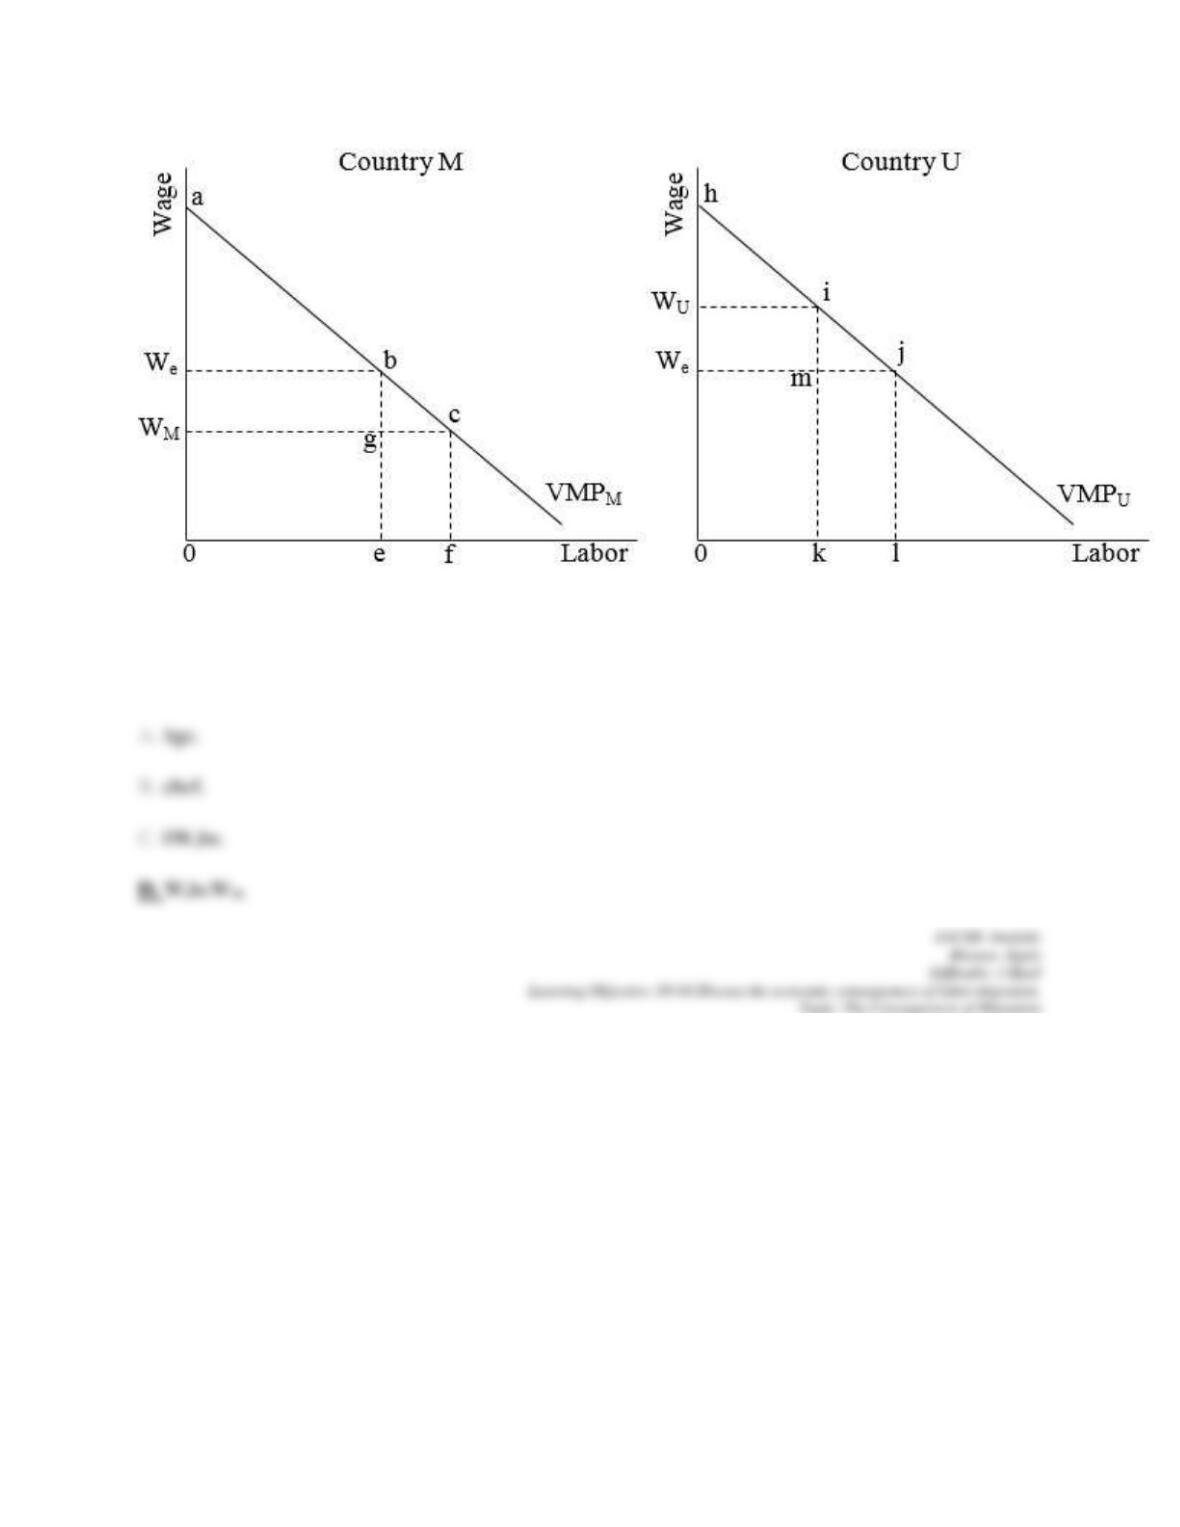
For Country M capital owners, migration causes a collective loss equal to area
33. Refer to the following diagram. Initially, wage rates are WM in Country M and WU in Country U.
Subsequent migration results in an equalization of wage rates.
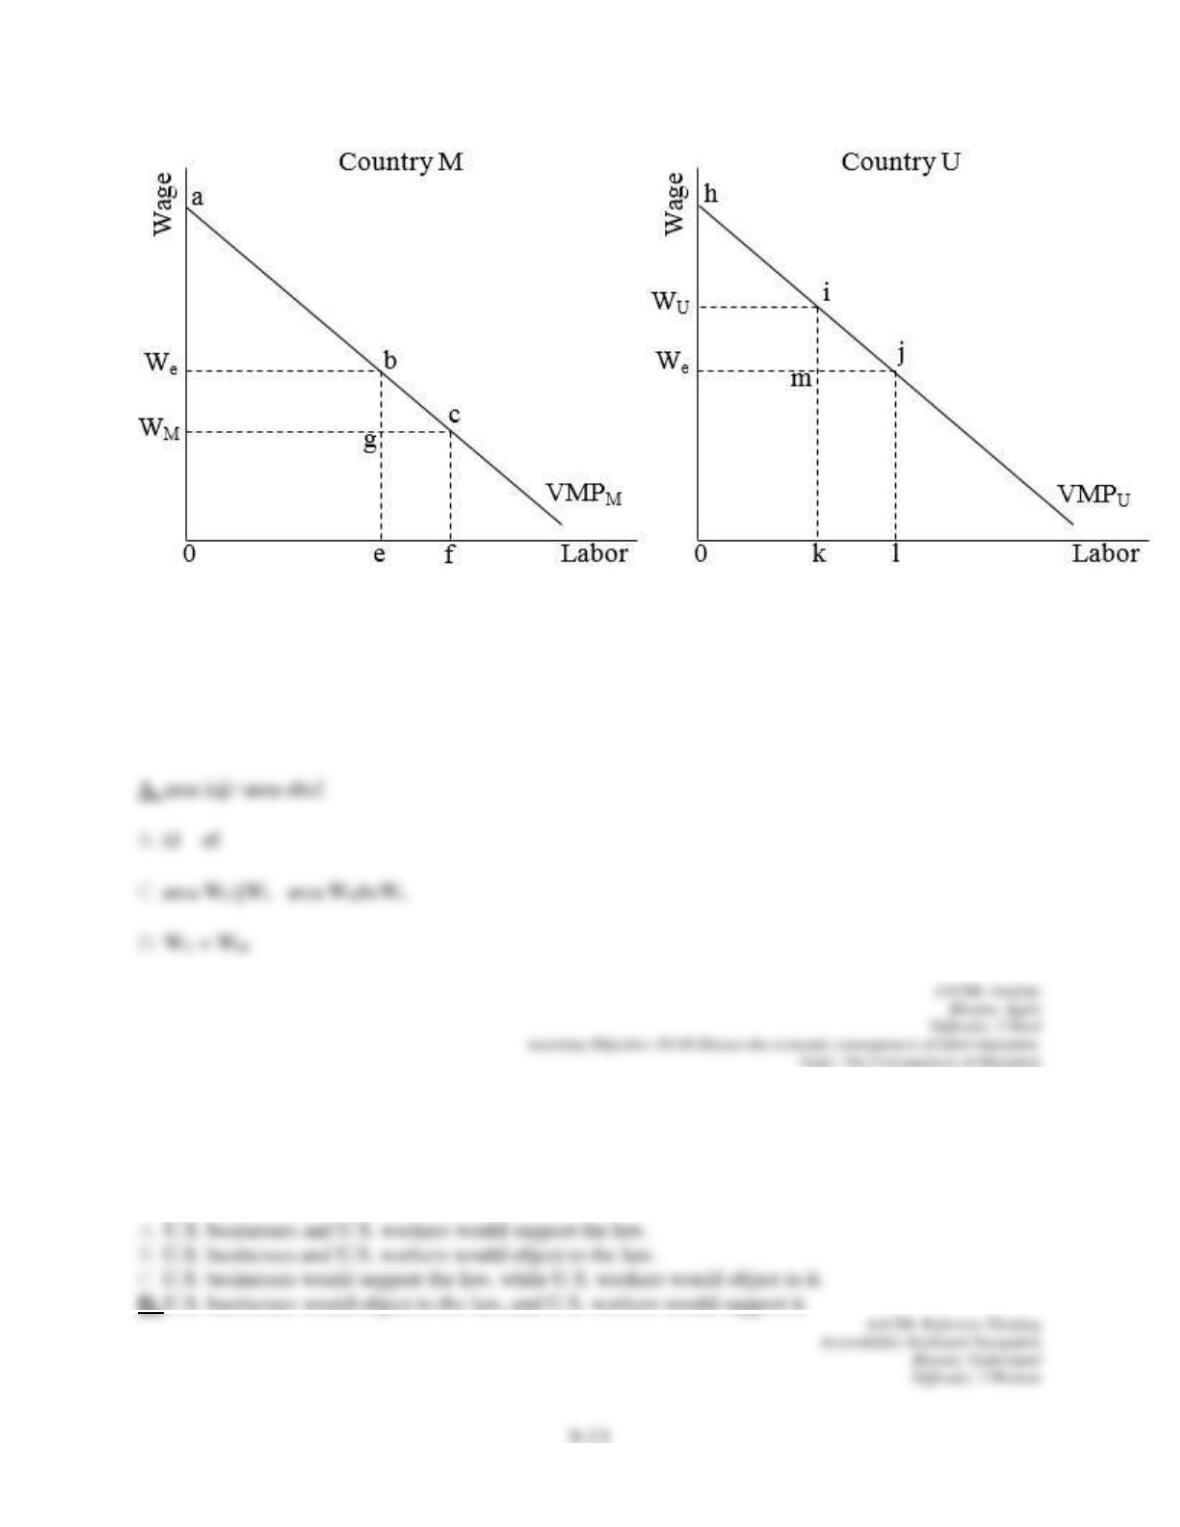
The combined gain in efficiency of the two countries is equal to
34. Suppose a proposed law will ban migration into the United States. Considering who gains and who
loses from migration, economic theory suggests that, in general,
35. Suppose a proposed law will expand migration into the United States. Economic theory suggests that
there will be a net gain accruing to U.S. workers who are
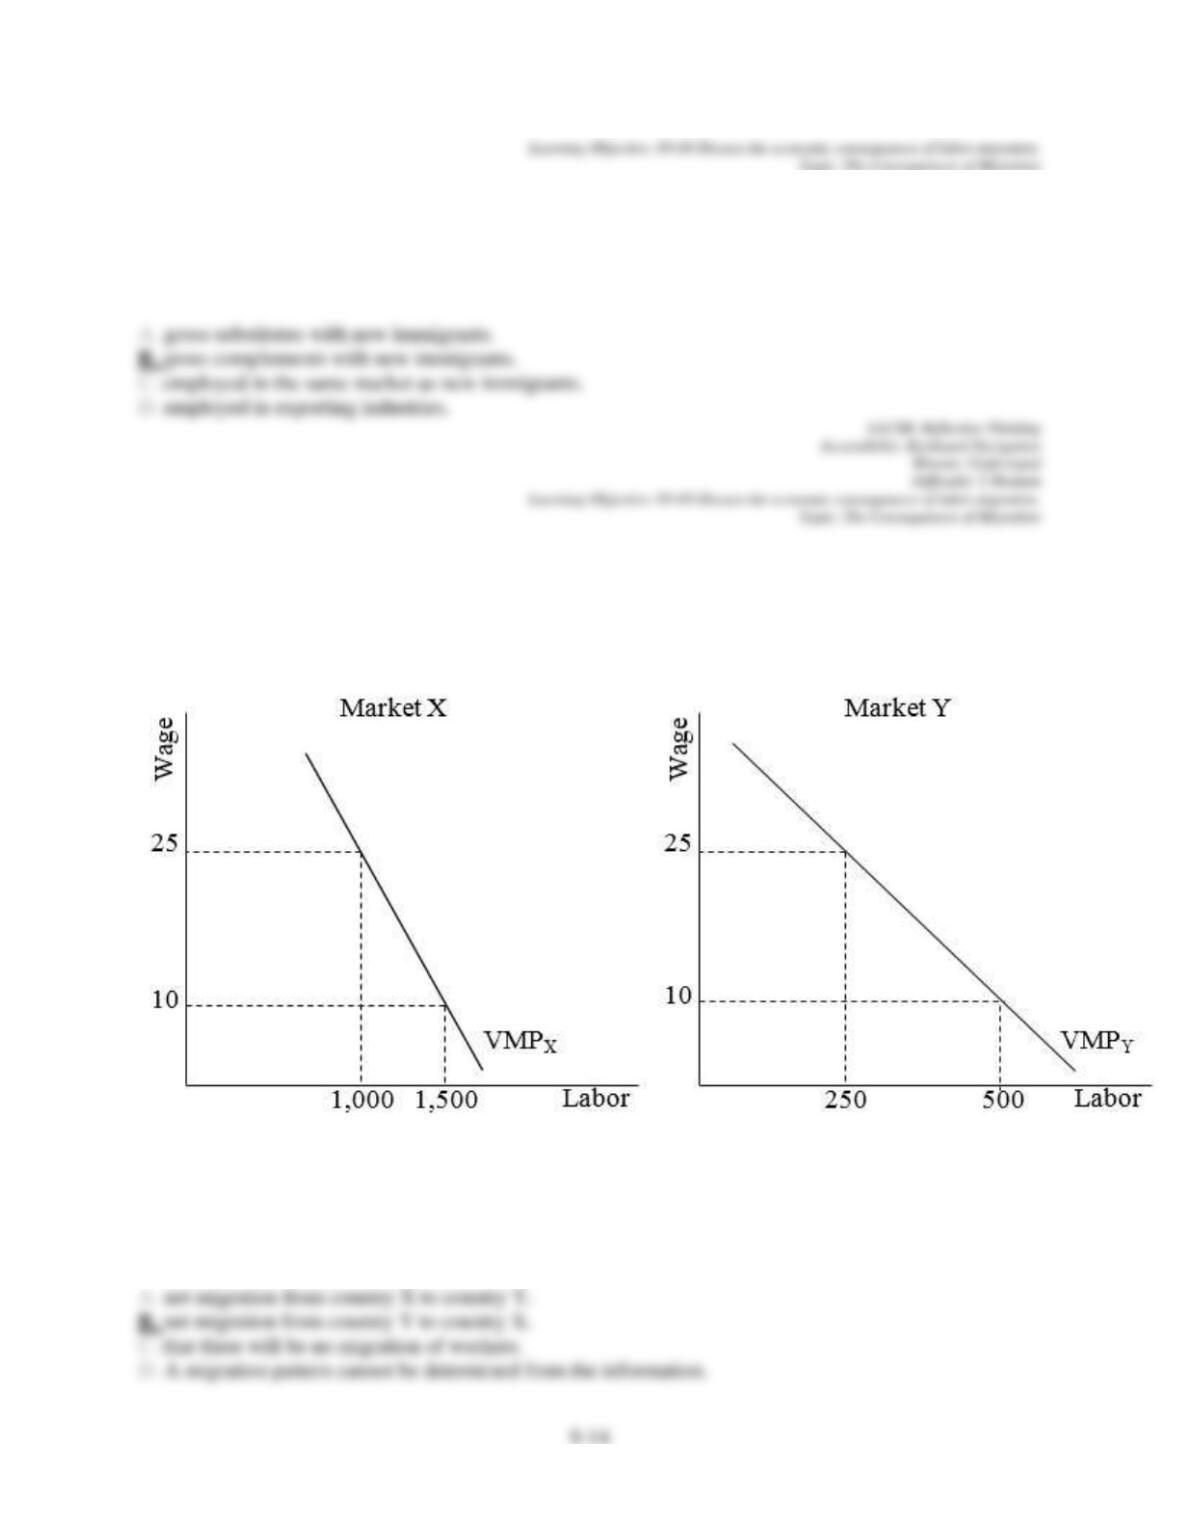
36. Refer to the following diagram. Assume all migration is costless.
If there are initially 1,000 workers in country X and 500 workers in country Y, then we should expect
9-15
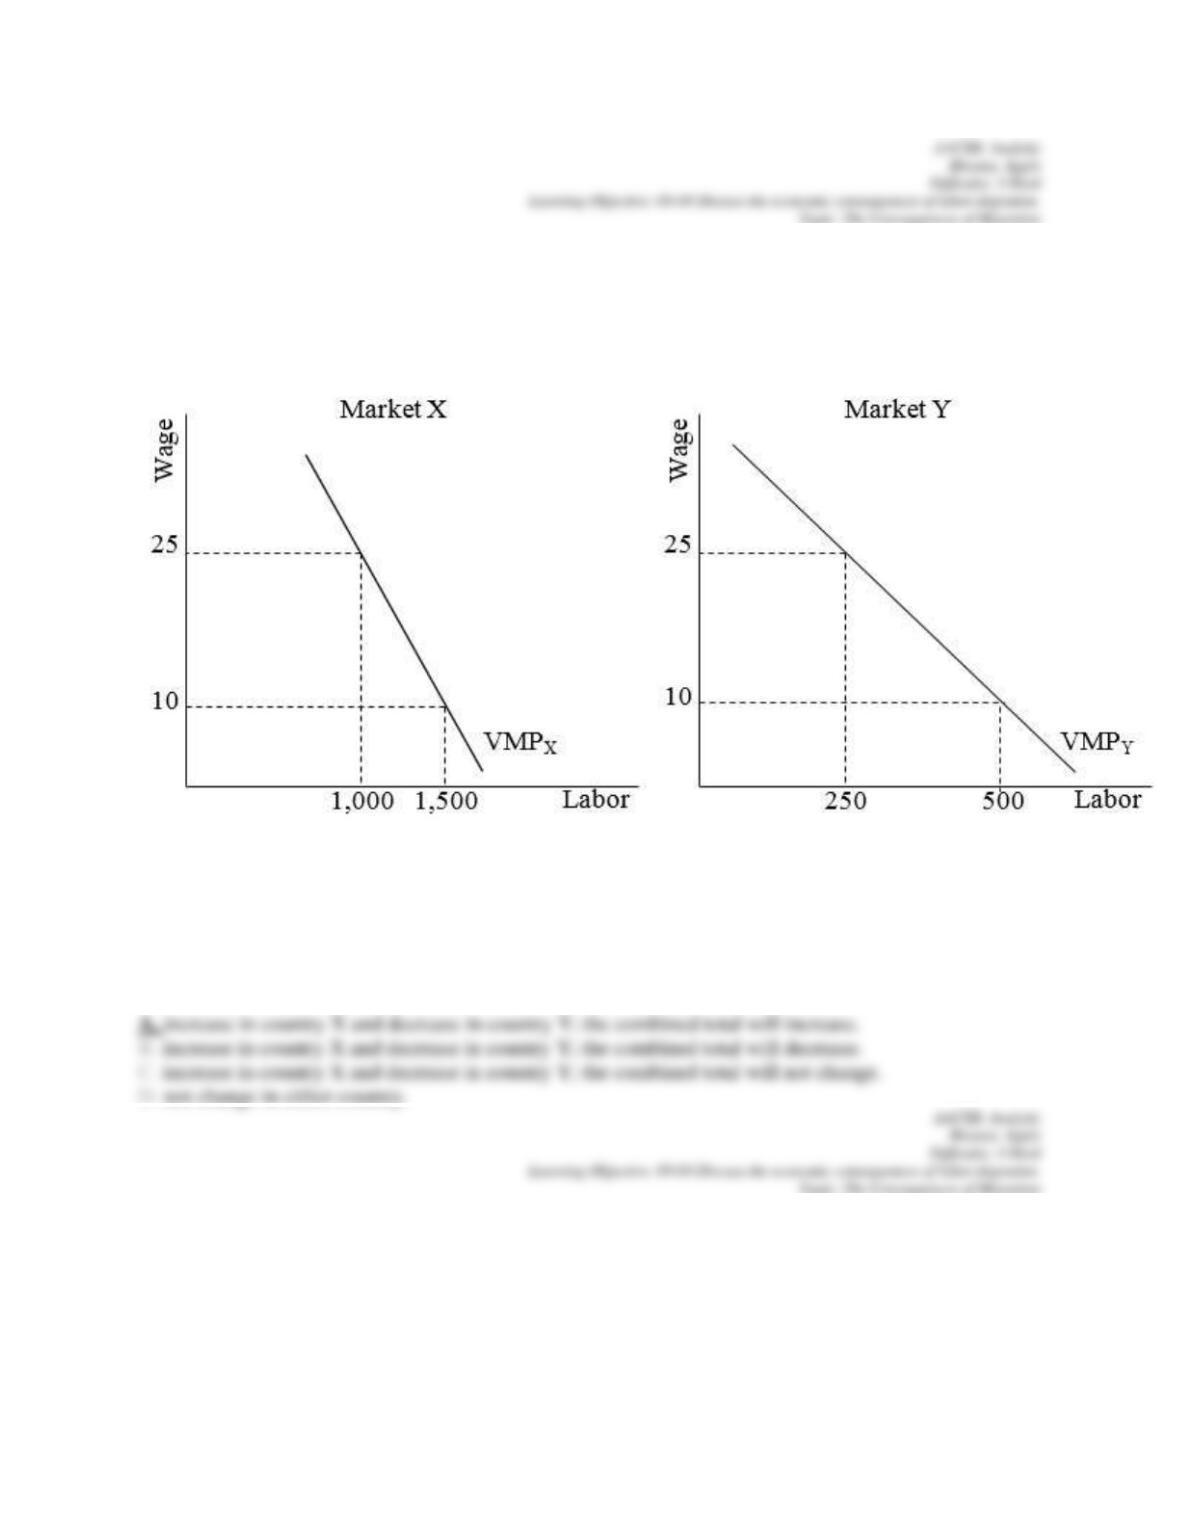
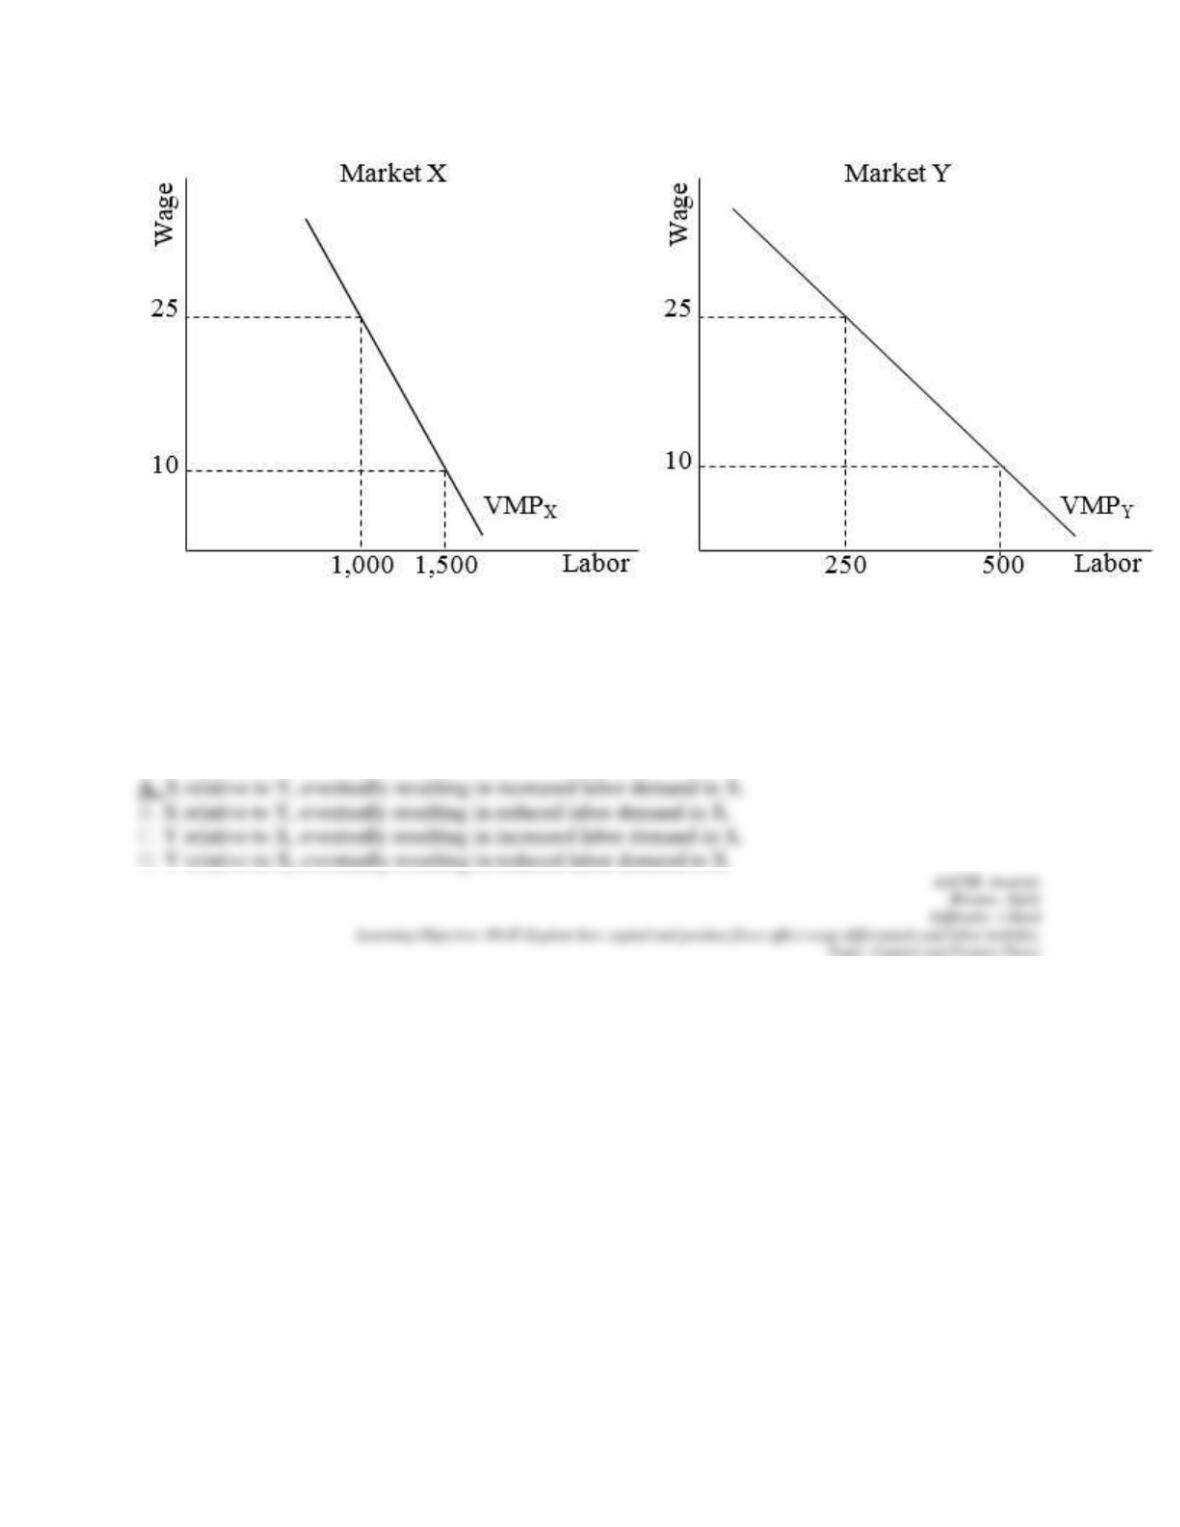
37. Refer to the following diagram. Assume all migration is costless.
Assume there are initially 1,000 workers in country X and 500 workers in country Y. As workers begin to
migrate, the total value of output will
38. Refer to the following diagram. Assume all migration is costless.
9-16
If wages are initially $10 in country X and $25 in country Y, then we should expect higher rates of capital
investment in
39. Refer to the following diagram. Assume all migration is costless.
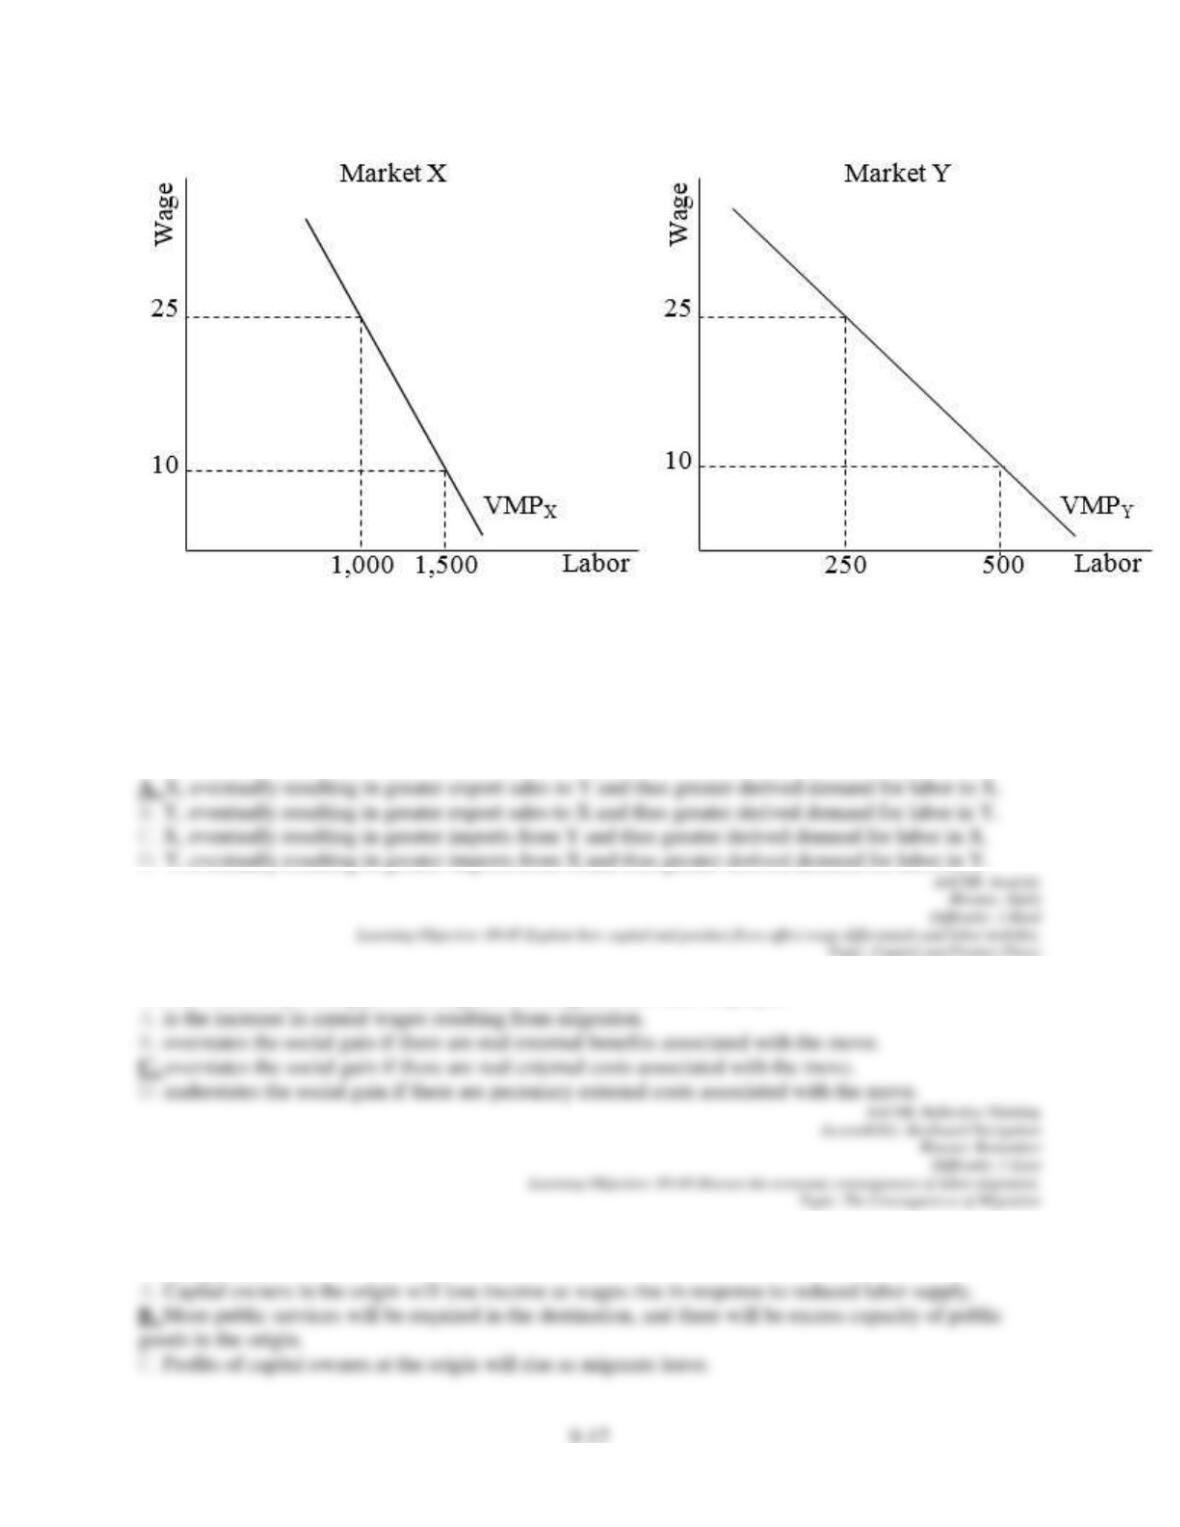
If wages are initially $10 in country X and $25 in country Y, then we should expect a relative price
advantage in country
40. The total net private gain from migration to migrants and their employers
41. Which of the following would be considered a real (as opposed to pecuniary) externality associated
with migration?
42. Historically, immigrants in the United States
43. Legal immigration to the United States
44. Estimates by the U.S. Bureau of the Census suggest that since 1992, total legal and illegal
immigration to the United States each year has averaged approximately
45. Immigration to the United States
9-19
46. An increase of 500 illegal alien workers would most likely
47. Suppose there is an increase in immigration rates of unskilled, illegal aliens.Which of the following is
not likely to result?
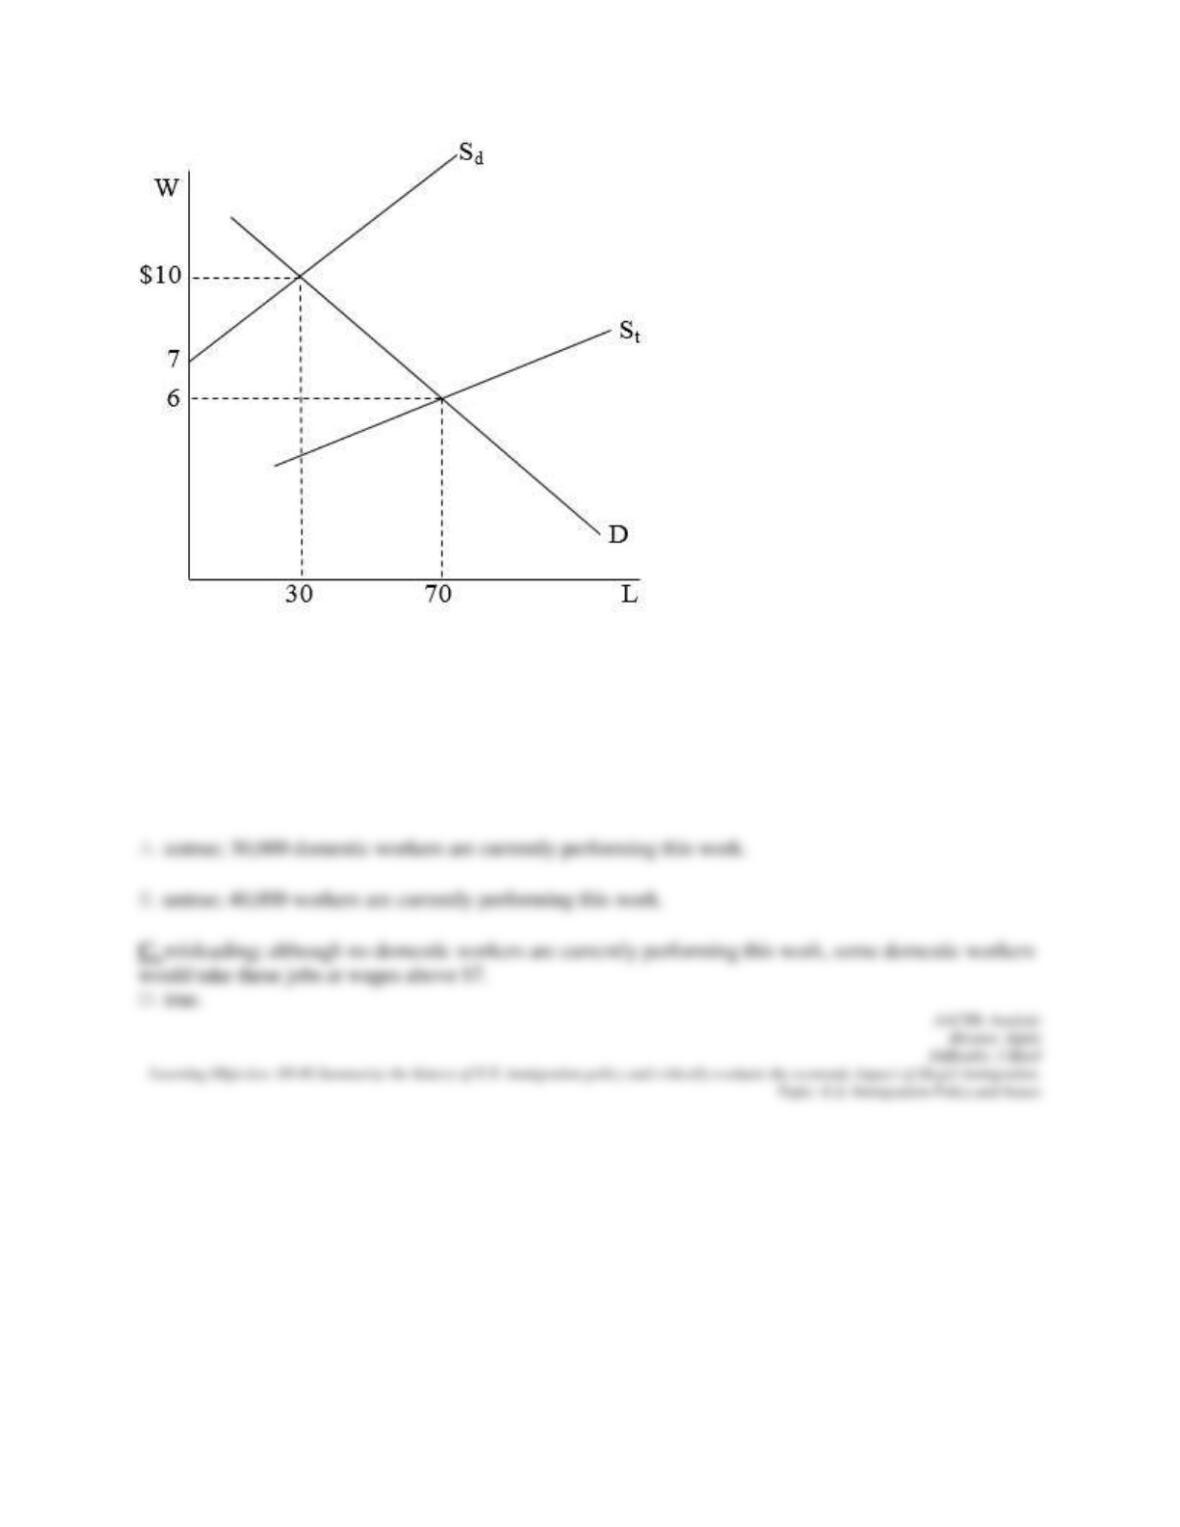
48. Refer to the following diagram, in which Sd is the supply curve of domestic labor and St is the total
labor supply curve including the supplies of illegal immigrant workers. L is measured in thousands of
workers.
9-20
Consider the market depicted in the diagram. Supporters of illegal immigrants claim that no domestic
workers are willing to do this type of work. Their claims are
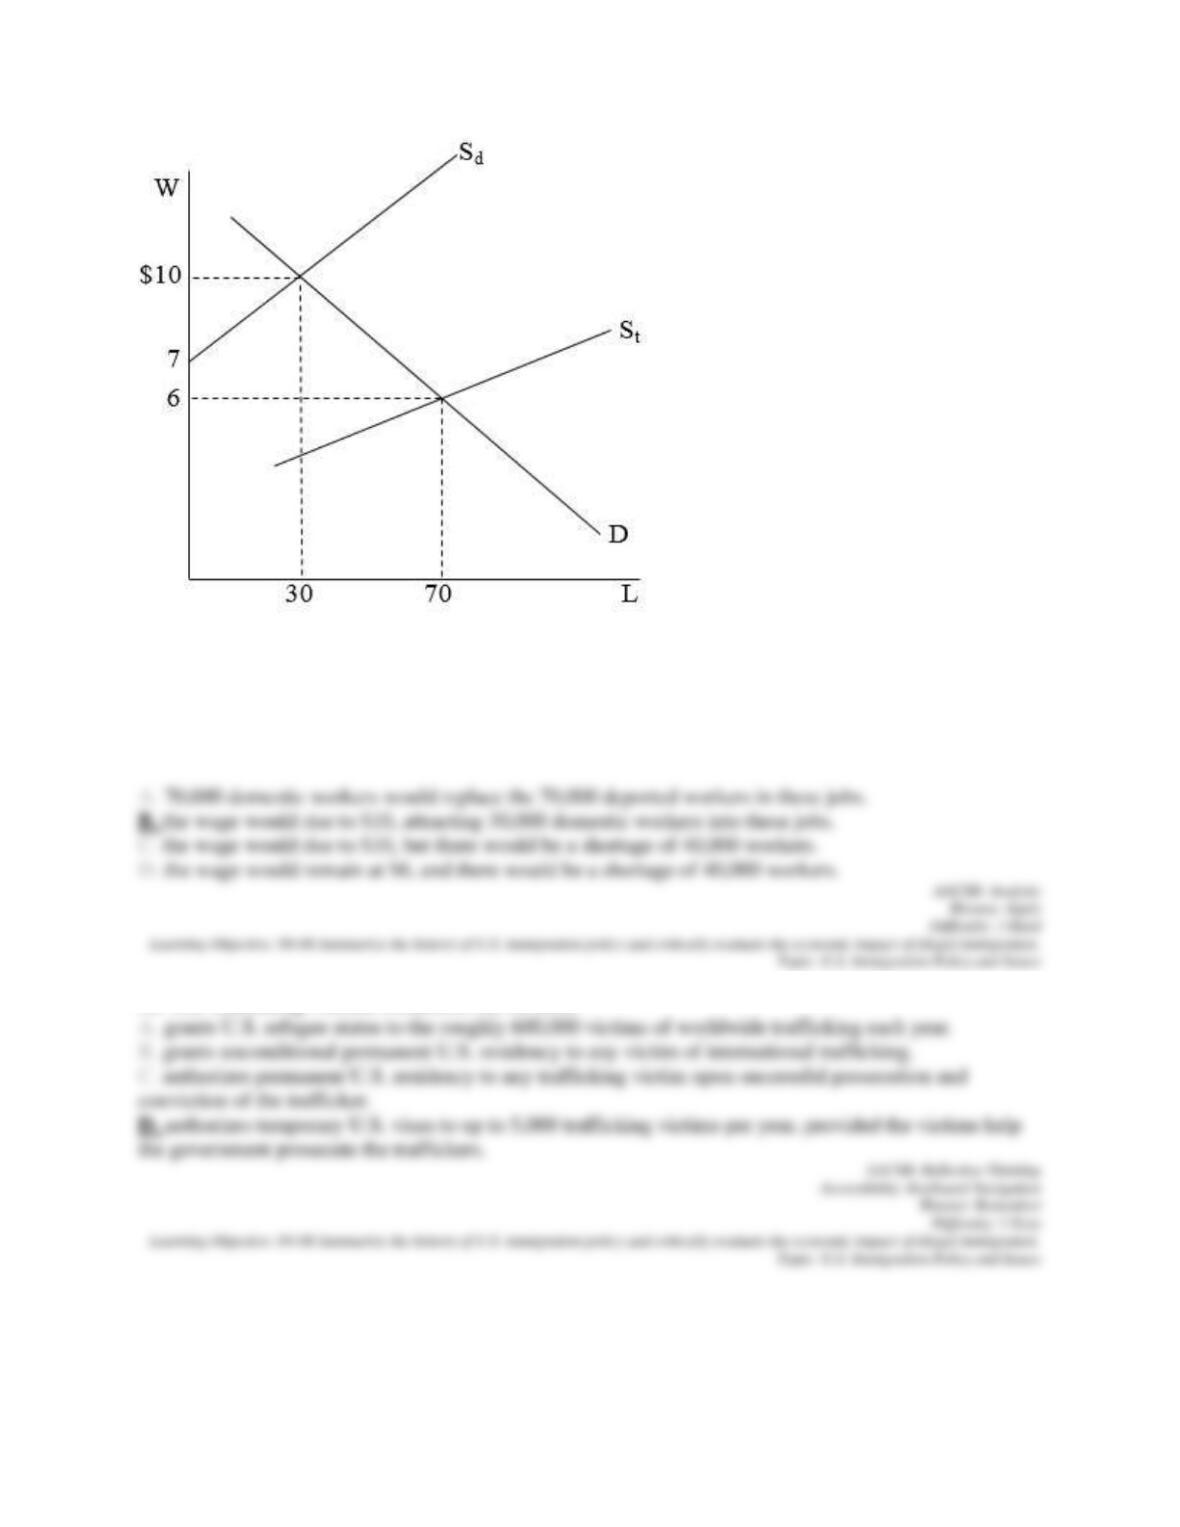
49. Refer to the following diagram, in which Sd is the supply curve of domestic labor and St is the total
labor supply curve including the supplies of illegal immigrant workers. L is measured in thousands of
workers.
9-21
Consider the market depicted in the diagram. If all illegal aliens were deported,
50. The Trafficking Victims Protection Act of 2000
Chapter 09 Test Bank Summary

9-22
Category
# of Quest
ions
AACSB: Analytic
14
AACSB: Reflective Thinking
36
Accessibility: Keyboard Navigation
34
Blooms: Apply
14
Blooms: Remember
31
Blooms: Understand
5
Difficulty: 1 Easy
31
Difficulty: 2 Medium
5
Difficulty: 3 Hard
14
Learning Objective: 09-
01 Distinguish between the various types of labor mobility and explain the relative impo
rtance of each.
5
Learning Objective: 09-
02 Use the analytical framework of human capital investment to explain the migration d
ecision of a household.
4
Learning Objective: 09-03 Discuss the determinants of migration.
9
Learning Objective: 09-04 Discuss the economic consequences of labor migration.
21
Learning Objective: 09-
05 Explain how capital and product flows affect wage differentials and labor mobility.
2
Learning Objective: 09-
06 Summarize the history of U.S. immigration policy and critically evaluate the econom
ic impact of illegal immigration.
9
Topic: Capital and Product Flows
2
Topic: Migration as an Investment in Human Capital
4
Topic: The Consequences of Migration
21
Topic: The Determinants of Migration: A Closer Look
9
Topic: Types of Labor Mobility
5
Topic: U.S. Immigration Policy and Issues
9