
Chapter 09 Test Bank KEY
1. Linda quit her job as a loan officer at First Detroit State Bank to accept a similar position at First
Minneapolis Savings Bank. This is an example of
2. Sam left his job as an auto mechanic to accept a position in his local Sears store as an auto parts
salesman. This is an example of
3. If an economics professor moves from the University of California at Berkeley to the University of
Texas at Austin, that is an example of
4. Approximately what percentage of U.S. workers change occupation each year?
9-2
5. Which one of the following is a true statement?
6. Because migration typically involves present sacrifice in order to obtain a greater stream of future
earnings, many economists consider migration to be
7. “Any worker for whom the present value of lifetime earnings will increase by migration will choose to
move.” This statement is
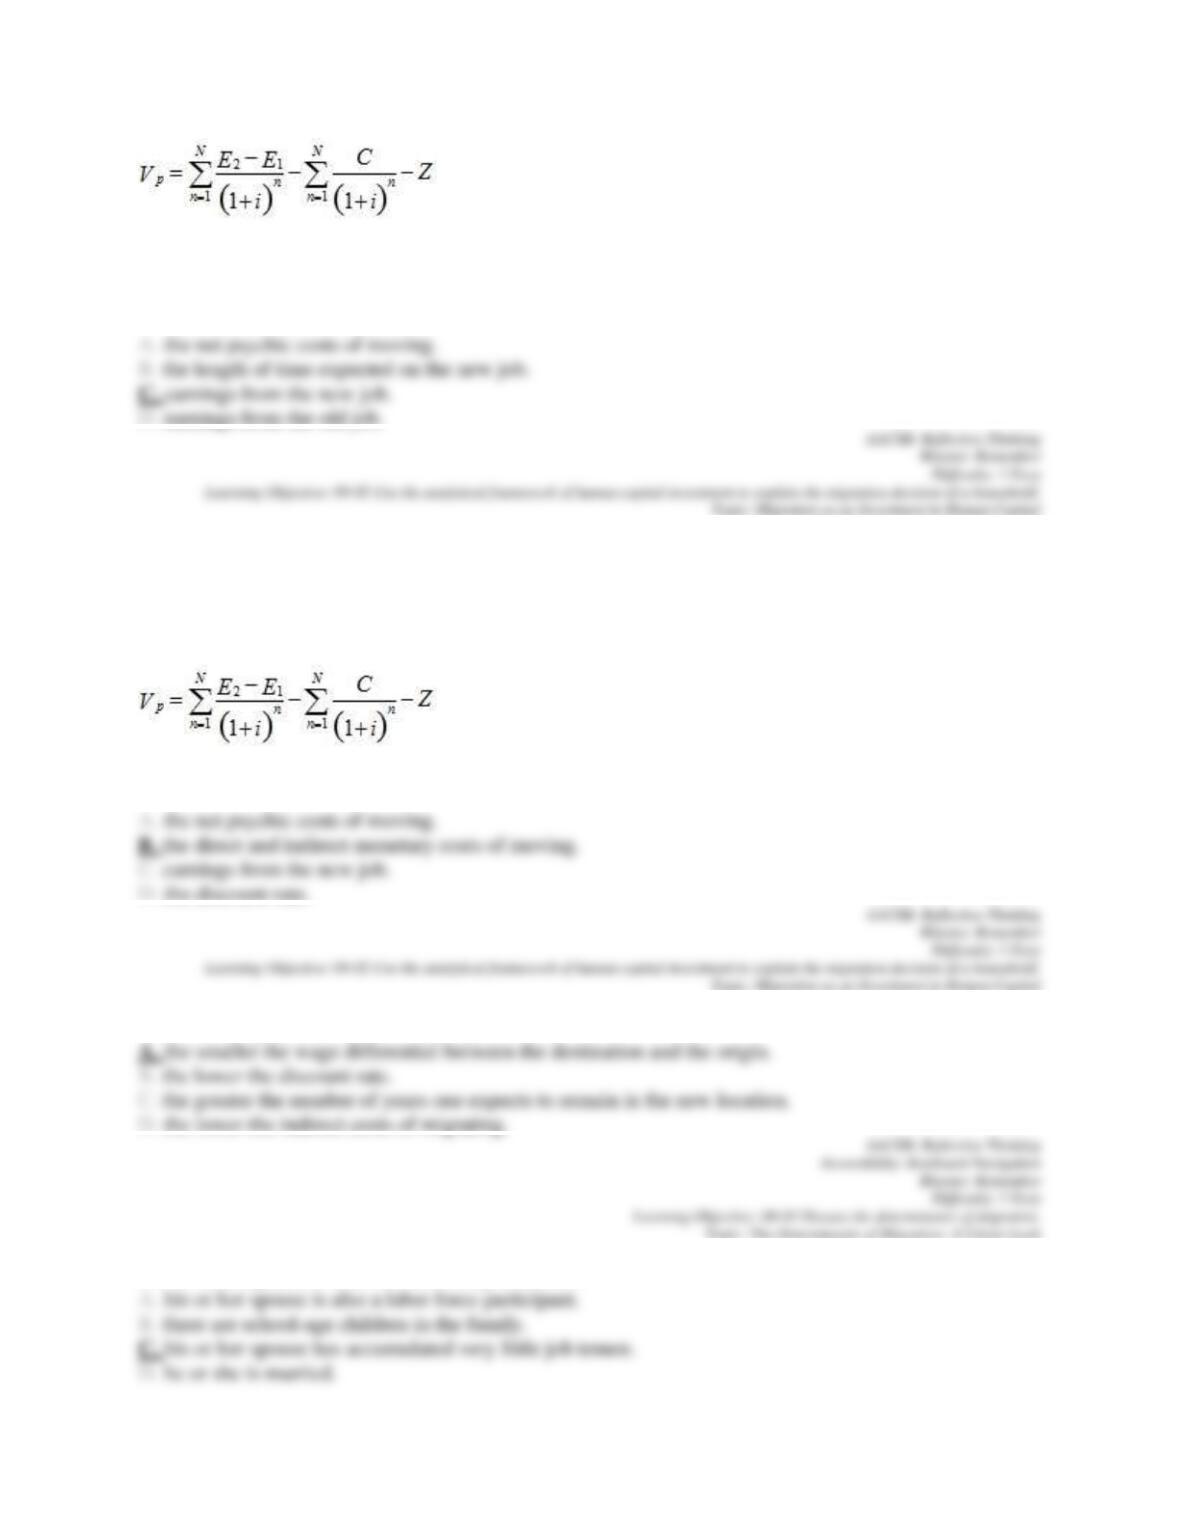
8. In the equation for the net present value of migration,
9-3
, the term “E2” refers to
9. In the equation for the net present value of migration,
, the term “C” refers to
10. All else equal, a worker is less likely to move,
11. All else equal, a worker is more likely to move if
12. All else equal, a worker is less likely to move
13. All else equal, a worker is more likely to move
14. All else equal, a worker is less likely to move
15. Which one of the following helps to explain the observed relationship between age and mobility?
16. Older workers are less likely to migrate, because older workers

17. Which one of the following will tend to decrease the perceived costs of a move relative to the
perceived benefits?
18. Concerning the relationship between unemployment and migration, empirical studies generally find
that
19. The average economic rate of return to migration is estimated to be
20. The expected private rate of return to migration to a particular individual
21. (p. $$pageTag$$) –Early empirical evidence reported by Barry Chiswick indicated that foreign-born
persons migrating to the U.S., all else constant,
22. (p. $$pageTag$$) –Research by Borjas on relatively recent immigrants to the U.S. suggests that they
23. With respect to family earnings, on the average, family migration initially
9-7
24. Following the downturn in air travel following the September 11, 2001, terrorist attacks, several
thousand highly paid Seattle-based union workers were laid off from airplane manufacturer Boeing. Many
of these workers left the Seattle area to accept jobs paying less than their Boeing jobs. What can we
conclude from their actions?
25. Assuming competitive markets, migration in response to wage differentials will likely result in
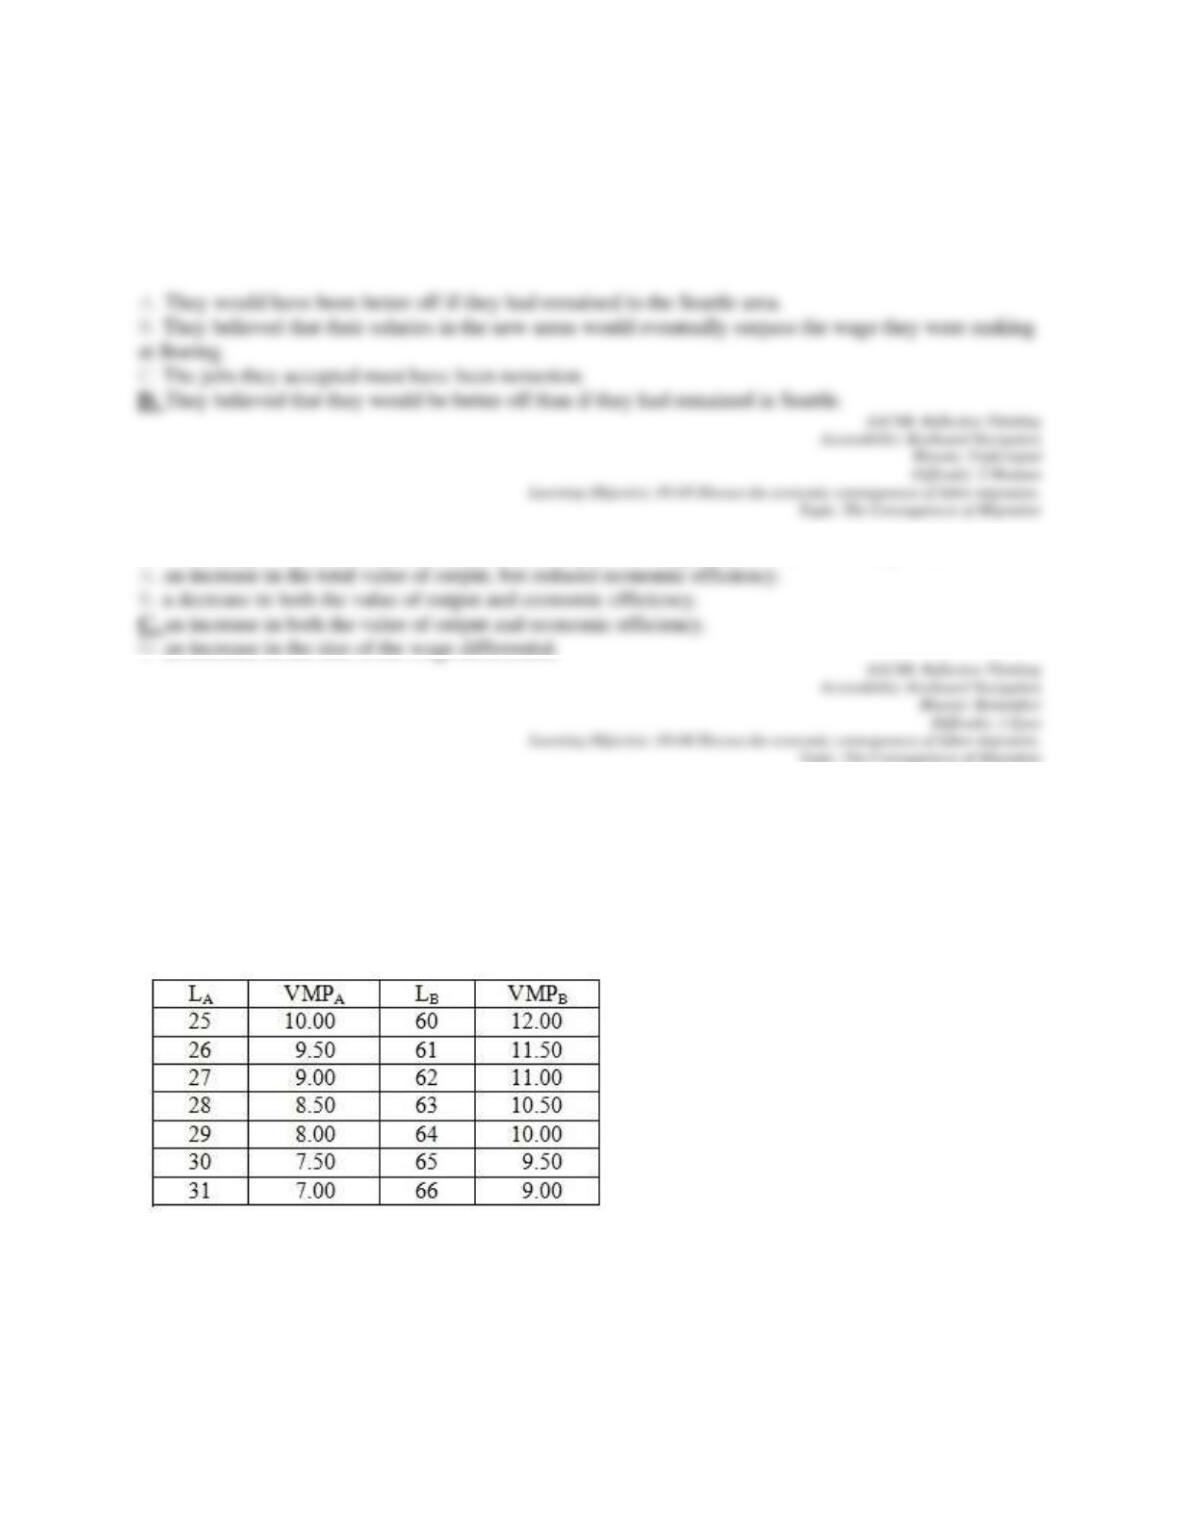
26. Refer to the table below. There are initially 28 workers in market A and 63 workers in market B, as
indicated by the shaded cells. All markets are assumed competitive and there is perfect information and
costless migration; jobs in markets A and B are identical in all nonwage aspects.
Given the initial situation, which one of the following may be expected to occur?
9-8
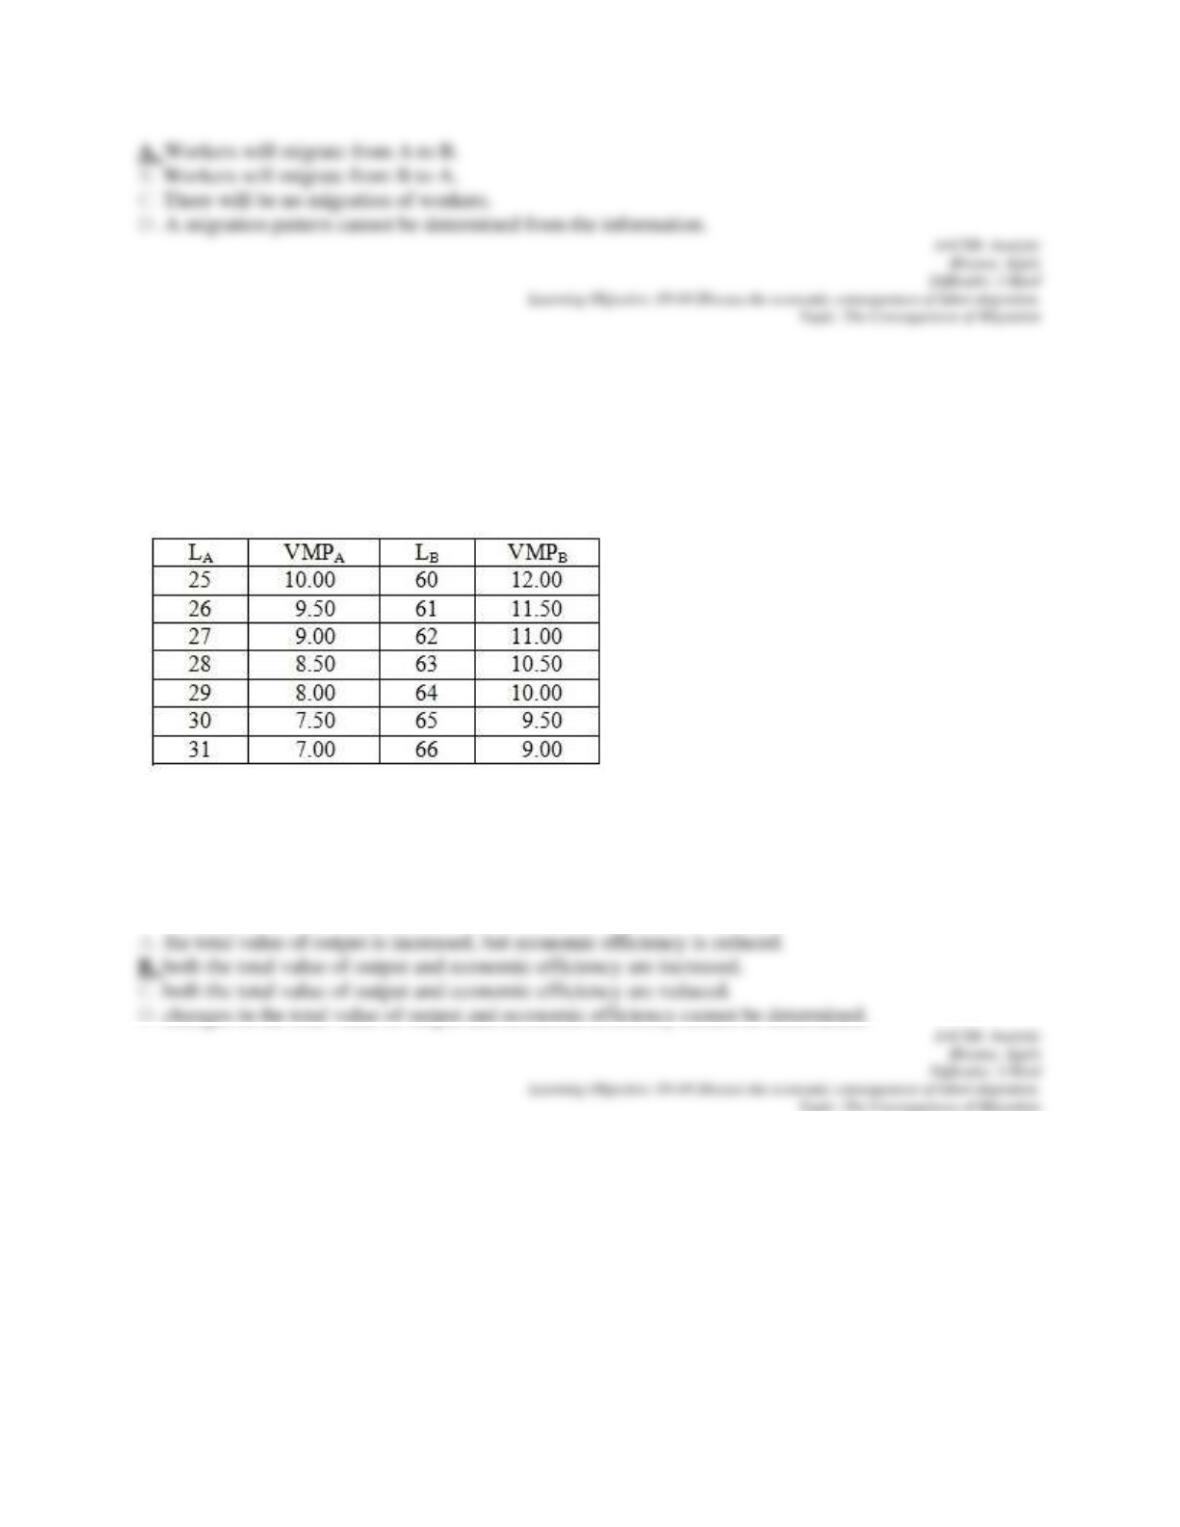
27. Refer to the table below. There are initially 28 workers in market A and 63 workers in market B, as
indicated by the shaded cells. All markets are assumed competitive and there is perfect information and
costless migration; jobs in markets A and B are identical in all nonwage aspects.
After all adjustments to equilibrium take place in this market, we expect to find that
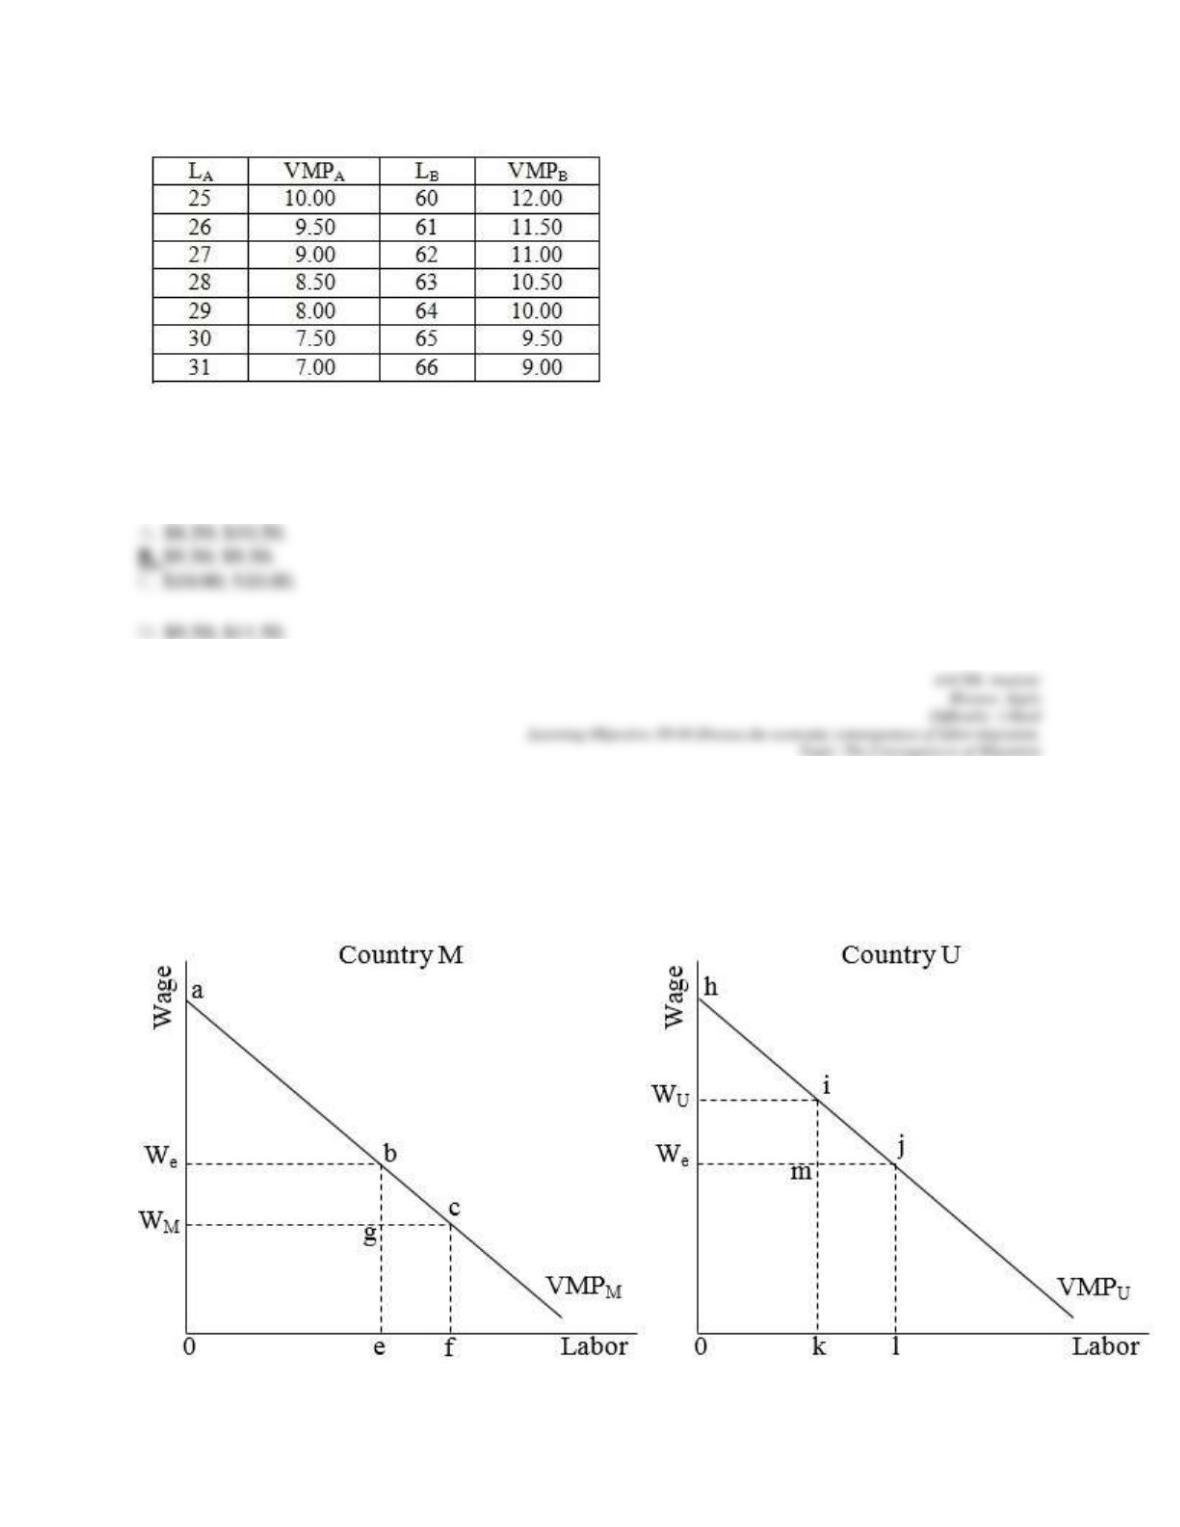
28. Refer to the table below. There are initially 28 workers in market A and 63 workers in market B, as
indicated by the shaded cells. All markets are assumed competitive and there is perfect information and
costless migration; jobs in markets A and B are identical in all nonwage aspects.
9-9
After all adjustments to equilibrium take place in this market, the equilibrium wage ratesin markets A and
B, respectively, are
29. Refer to the following diagram. Initially, wage rates are WM in Country M and WU in Country U.
Subsequent migration results in an equalization of wage rates.
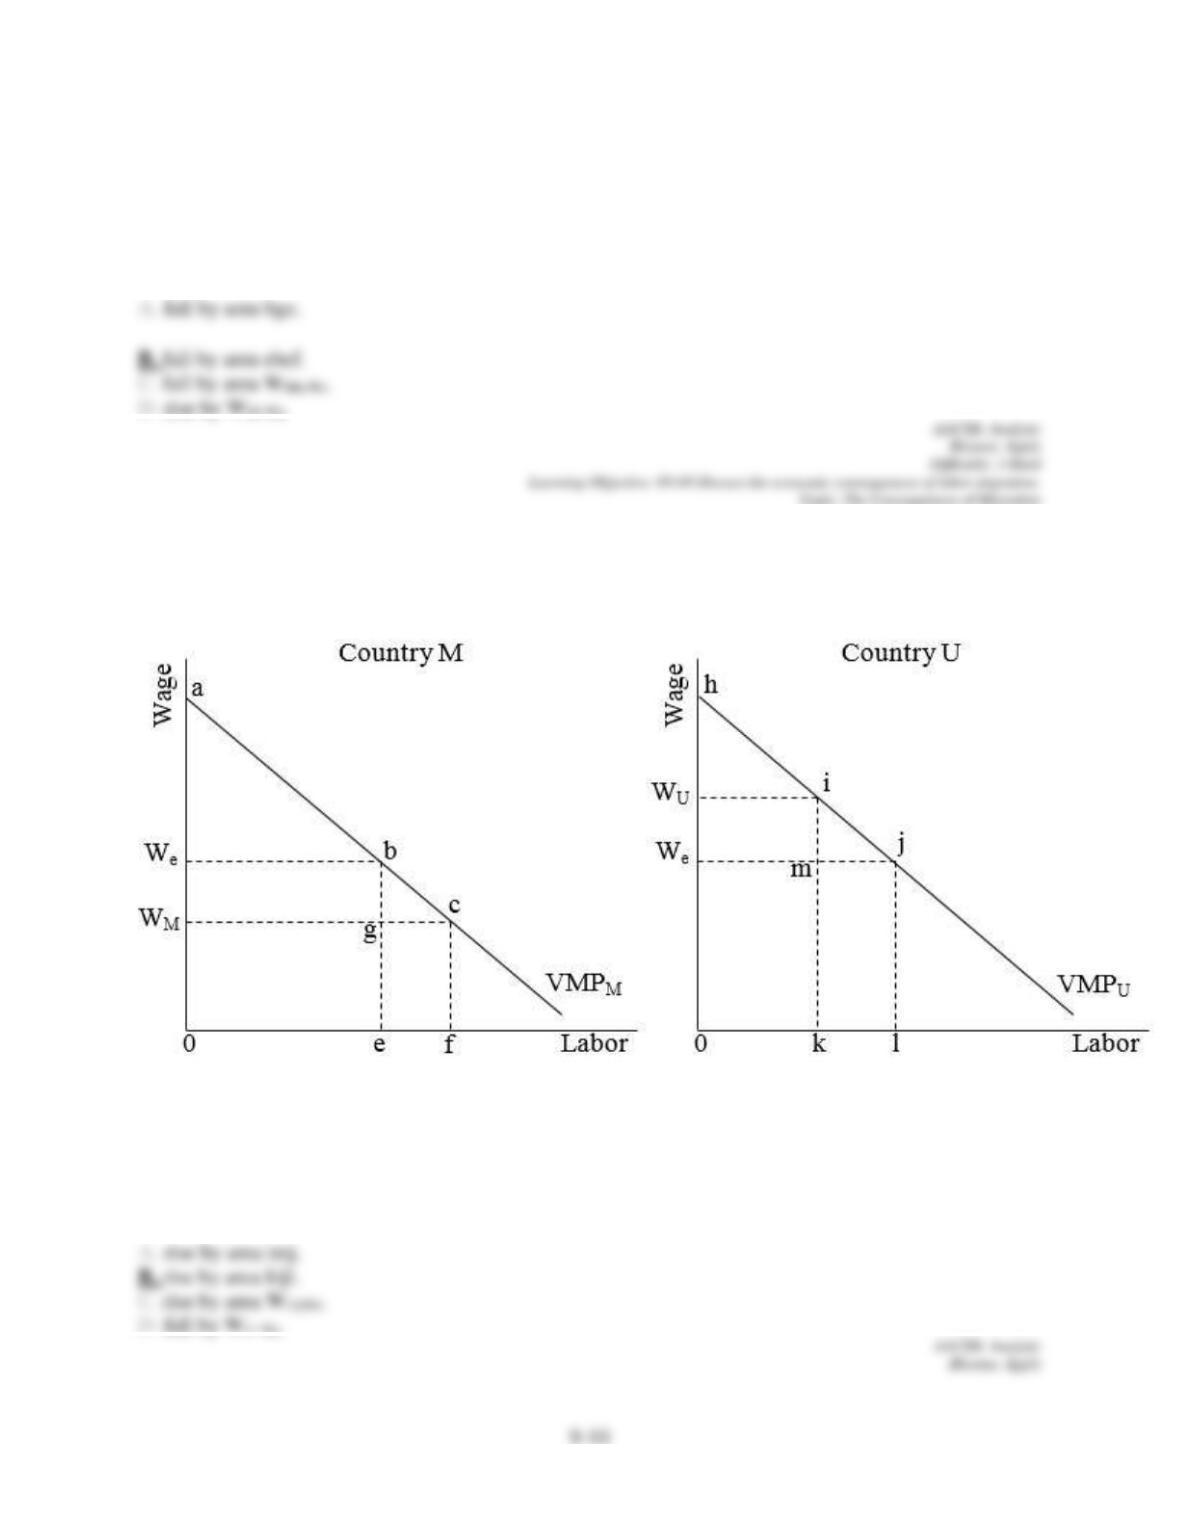
Migration causes the value of output in Country M to
30. Refer to the following diagram. Initially, wage rates are WM in Country M and WU in Country U.
Subsequent migration results in an equalization of wage rates.
Migration causes the value of output in Country U to
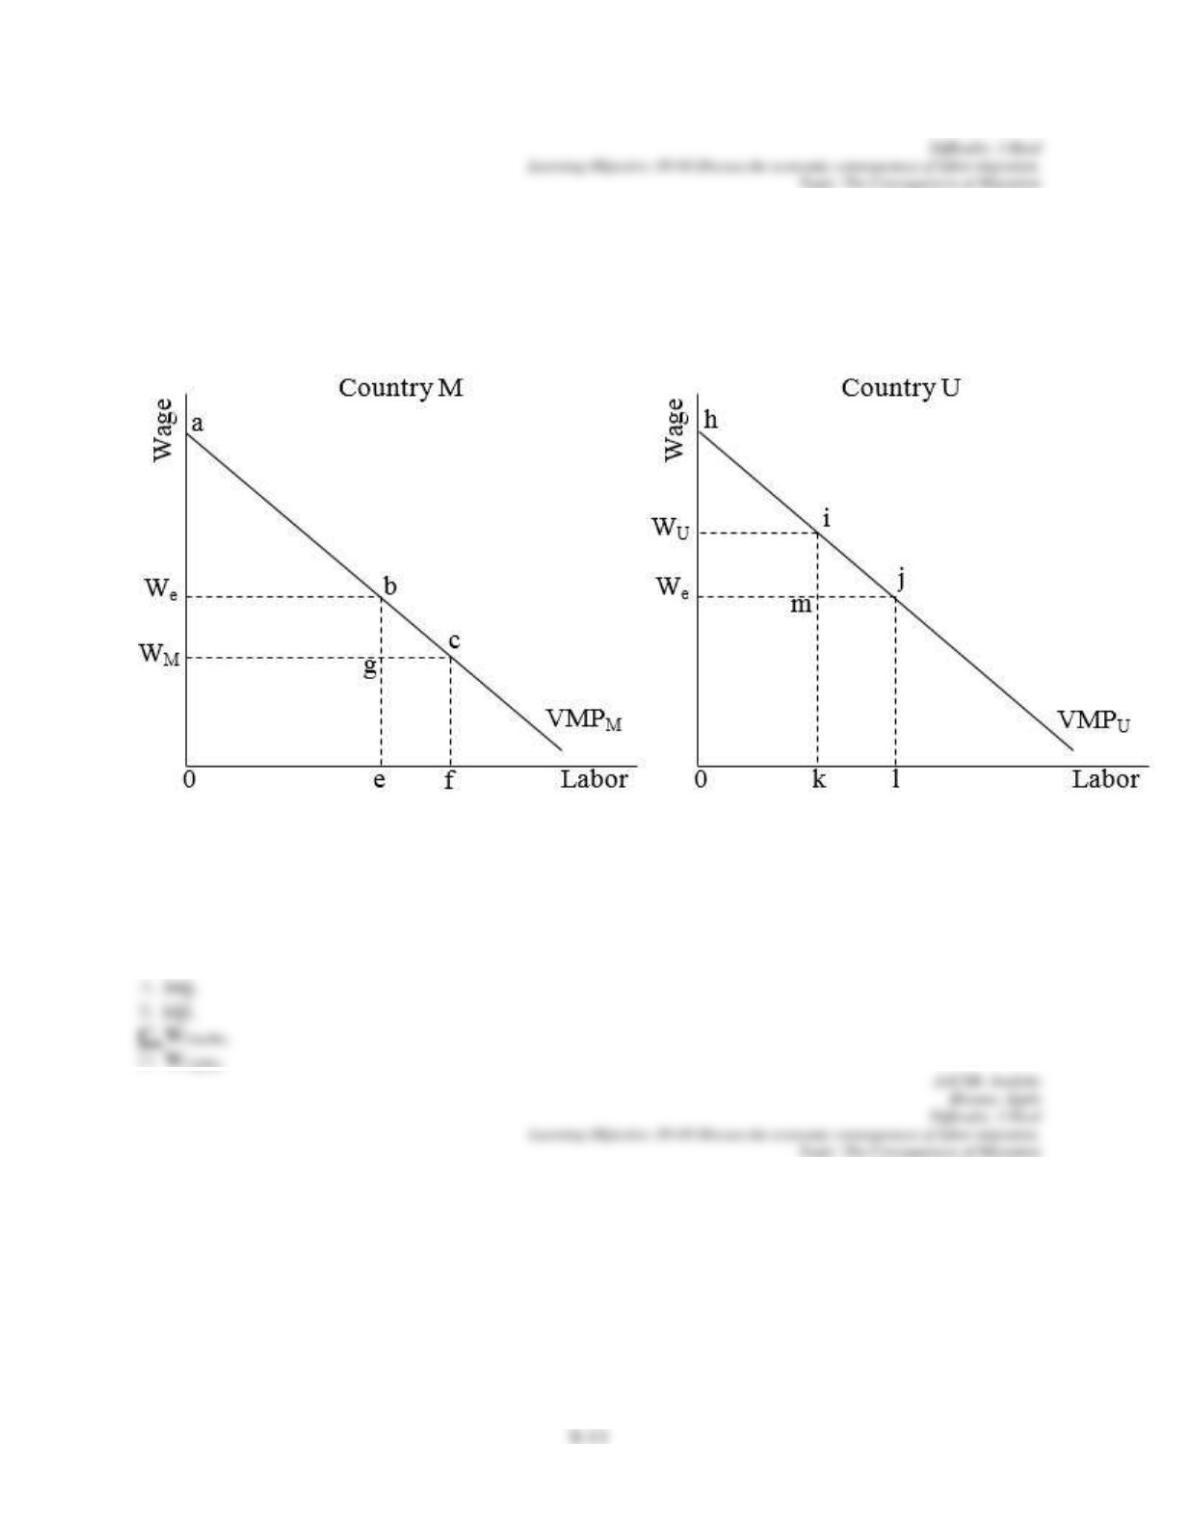
31. Refer to the following diagram. Initially, wage rates are WM in Country M and WU in Country U.
Subsequent migration results in an equalization of wage rates.
For native Country U workers, migration causes a collective loss equal to area
32. Refer to the following diagram. Initially, wage rates are WM in Country M and WU in Country U.
Subsequent migration results in an equalization of wage rates.