
Chapter 9: Sampling Distributions and Confidence Intervals for Proportions – Quiz A
Name ________________________________________
9.2.6 Find and interpret margins of error.
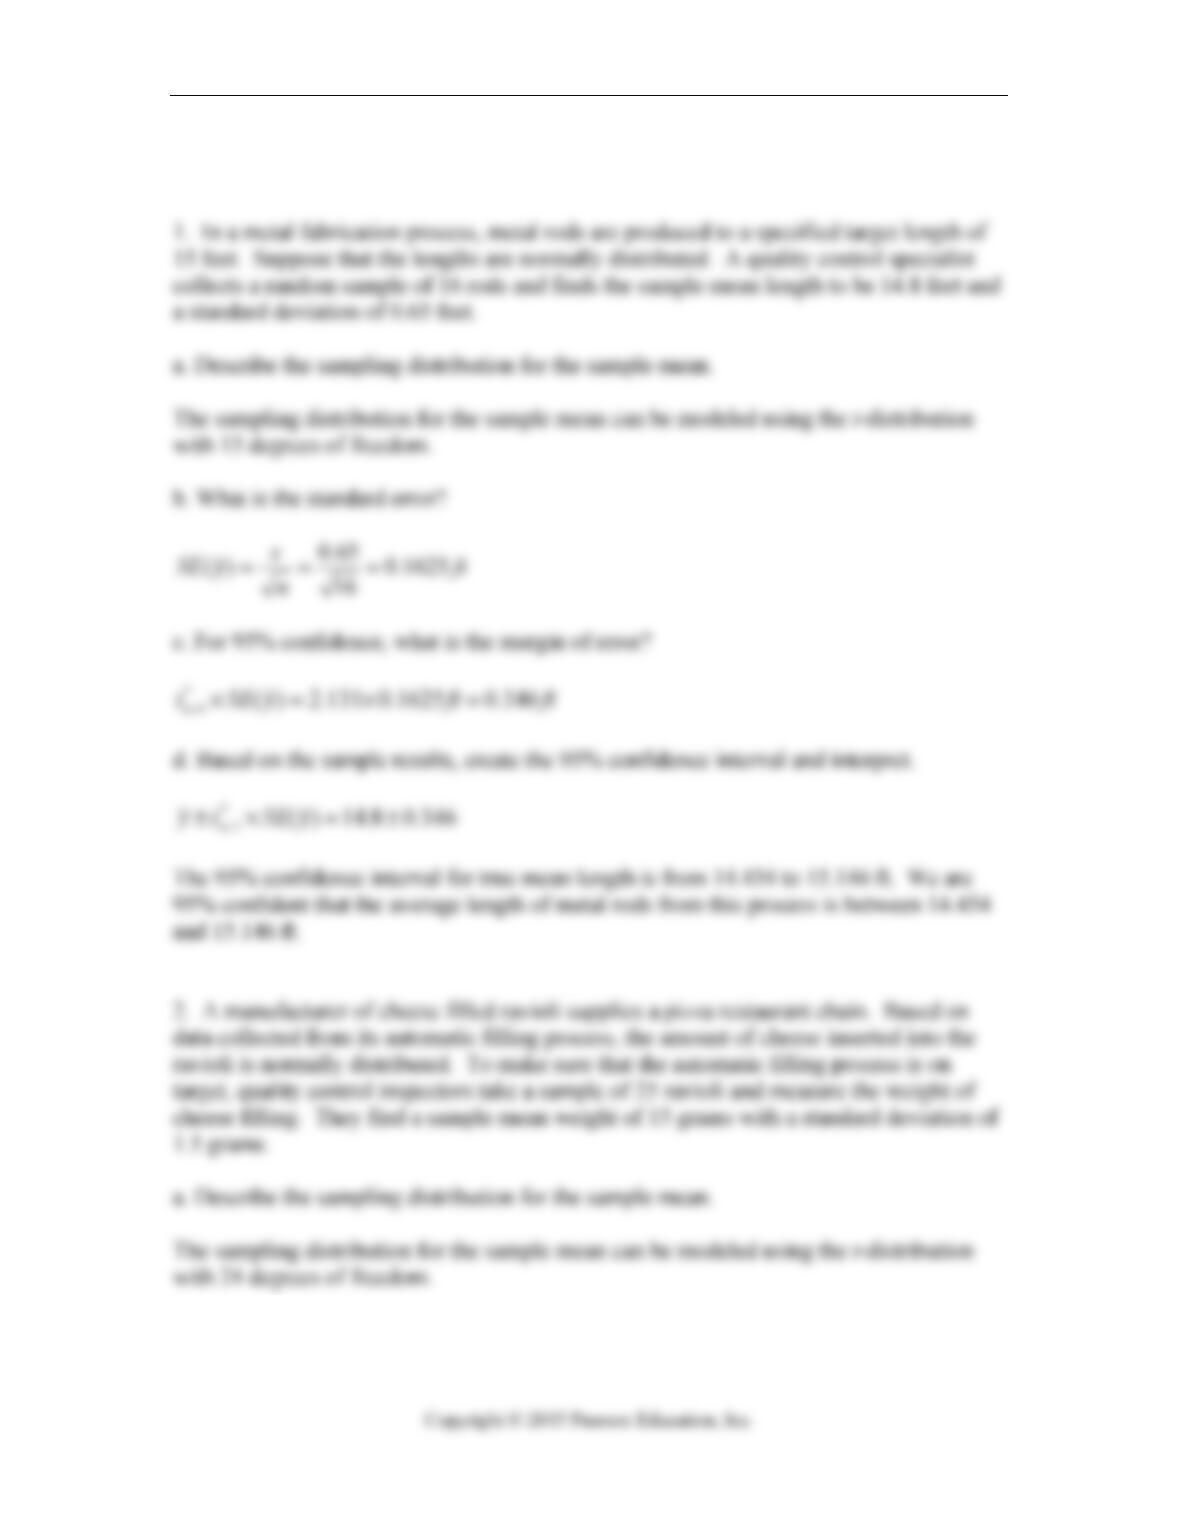
1. In a metal fabrication process, metal rods are produced to a specified target length of
15 feet. Suppose that the lengths are normally distributed. A quality control specialist
collects a random sample of 16 rods and finds the sample mean length to be 14.8 feet and
a standard deviation of 0.65 feet.
a. Describe the sampling distribution for the sample mean.
b. What is the standard error?
c. For 95% confidence, what is the margin of error?
d. Based on the sample results, create the 95% confidence interval and interpret.
9.2.7 Find and interpret confidence intervals.
2. A manufacturer of cheese filled ravioli supplies a pizza restaurant chain. Based on
data collected from its automatic filling process, the amount of cheese inserted into the
ravioli is normally distributed. To make sure that the automatic filling process is on
target, quality control inspectors take a sample of 25 ravioli and measure the weight of
cheese filling. They find a sample mean weight of 15 grams with a standard deviation of
1.5 grams.
a. Describe the sampling distribution for the sample mean.
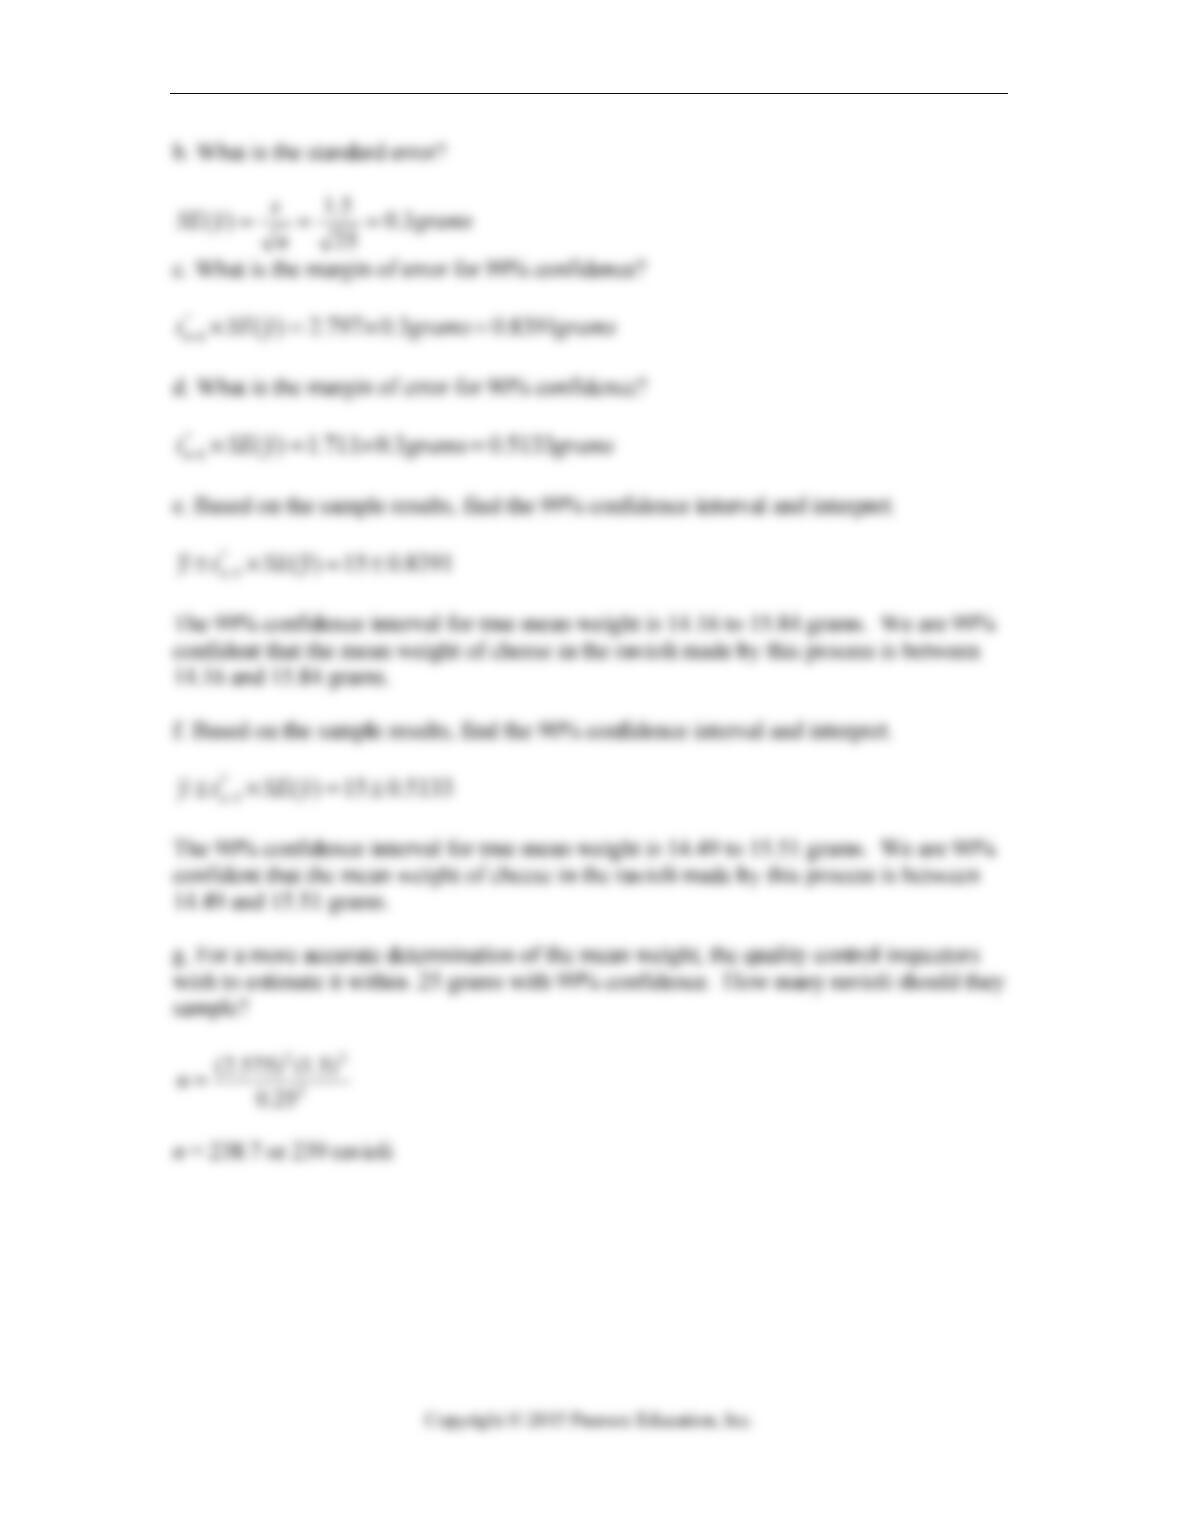
b. What is the standard error?
c. What is the margin of error for 99% confidence?
d. What is the margin of error for 90% confidence?
e. Based on the sample results, find the 99% confidence interval and interpret.
f. Based on the sample results, find the 90% confidence interval and interpret.
g. For a more accurate determination of the mean weight, the quality control inspectors
wish to estimate it within .25 grams with 99% confidence. How many ravioli should they
sample?
9.2.6 Find and interpret confidence intervals.
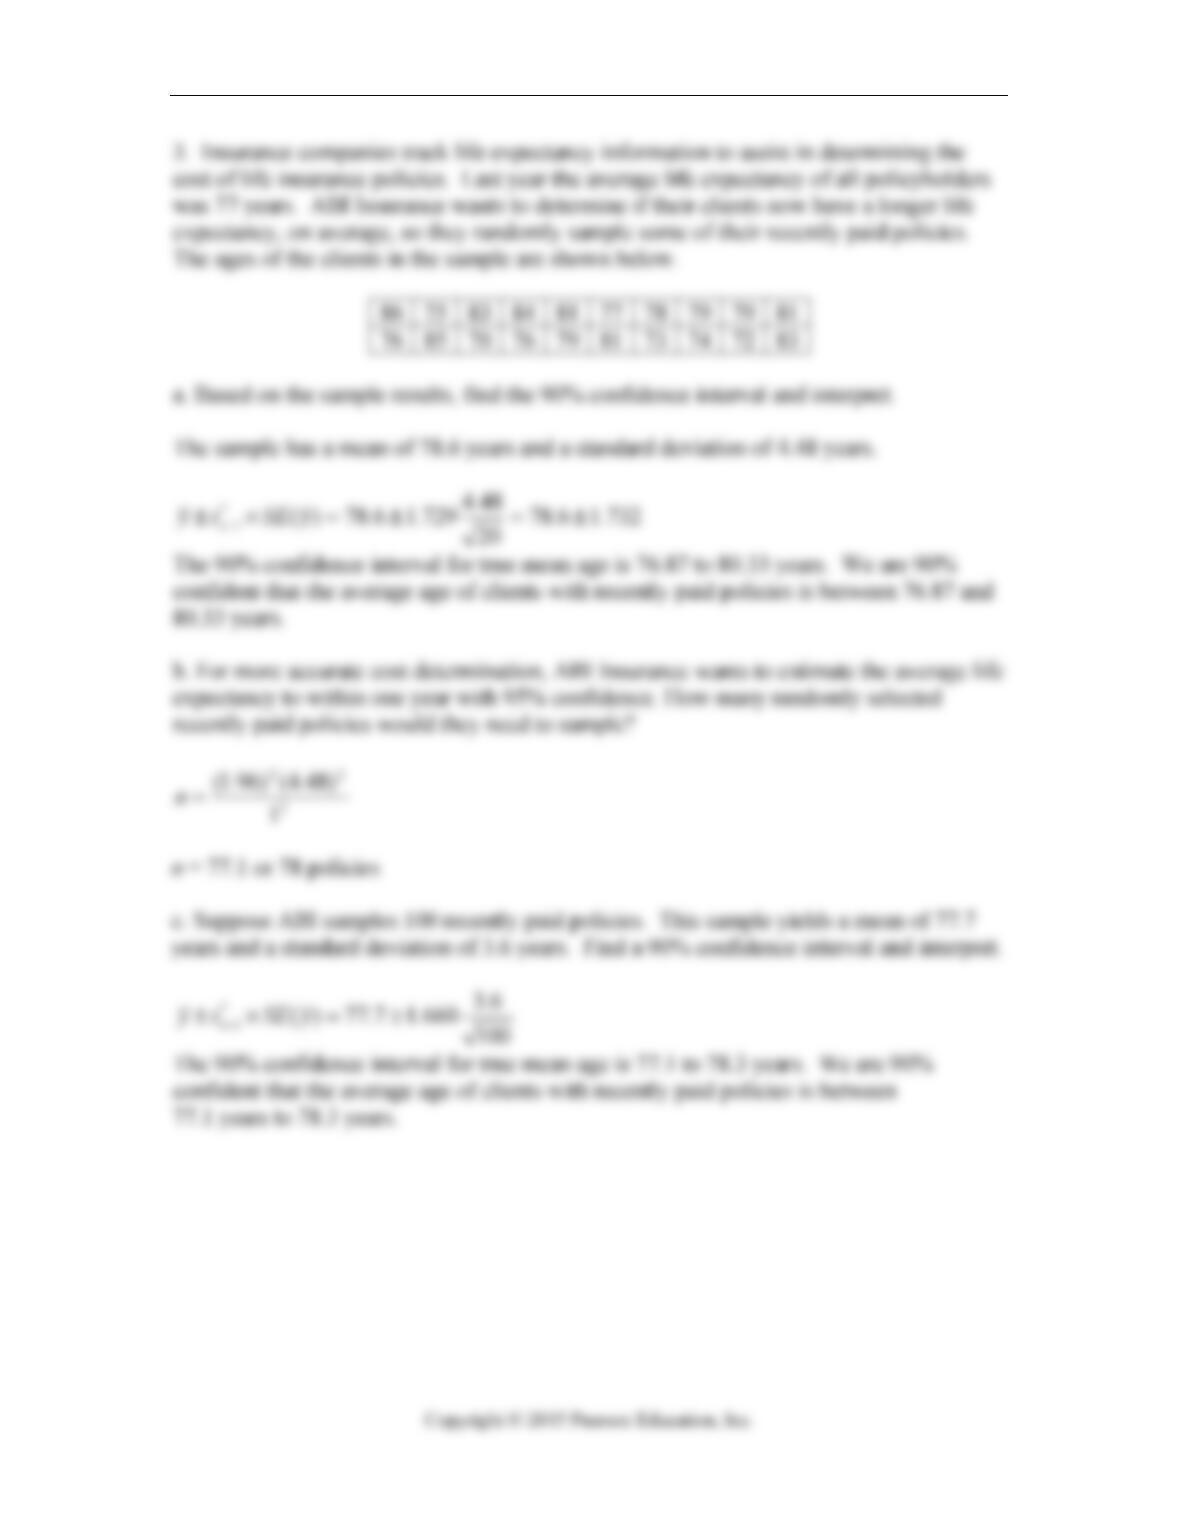
3. Insurance companies track life expectancy information to assist in determining the
cost of life insurance policies. Last year the average life expectancy of all policyholders
was 77 years. ABI Insurance wants to determine if their clients now have a longer life
expectancy, on average, so they randomly sample some of their recently paid policies.
The ages of the clients in the sample are shown below.
86 75 83 84 81 77 78 79 79 81
76 85 70 76 79 81 73 74 72 83
a. Based on the sample results, find the 90% confidence interval and interpret.

9-2 Chapter 9 Sampling Distributions and Confidence Intervals for Proportions
b. For more accurate cost determination, ABI Insurance wants to estimate the average life
expectancy to within one year with 95% confidence. How many randomly selected
recently paid policies would they need to sample?
c. Suppose ABI samples 100 recently paid policies. This sample yields a mean of 77.7
years and a standard deviation of 3.6 years. Find a 90% confidence interval and interpret.
9.1.2 Find the mean and standard deviation of proportions.
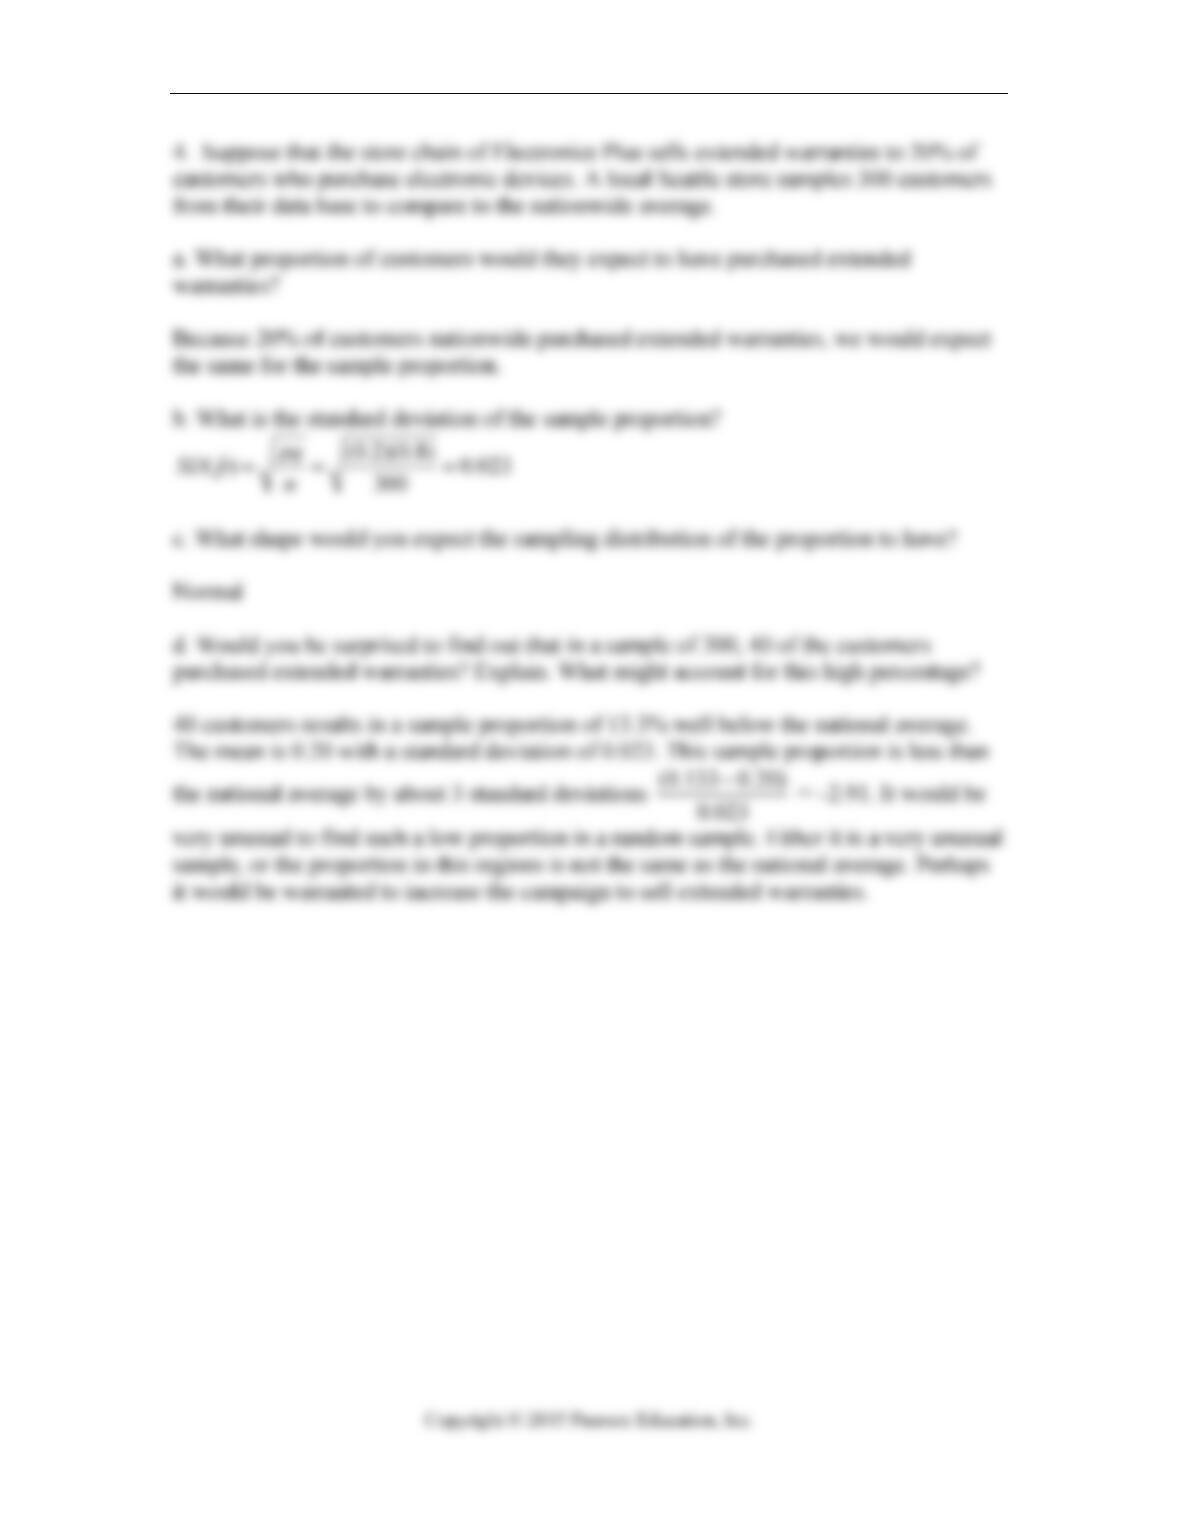
4. Suppose that the store chain of Electronics Plus sells extended warranties to 20% of
customers who purchase electronic devices. A local Seattle store samples 300 customers
from their data base.
a. What proportion of customers would they expect to have purchased extended
warranties?
b. What is the standard deviation of the sample proportion?
c. What shape would you expect the sampling distribution of the proportion to have?
d. Would you be surprised to find out that in a sample of 300, 40 of the customers
purchased extended warranties? Explain. What might account for this high percentage?
Quiz A 9-3
Chapter 9: Sampling Distributions and Confidence Intervals for Proportions –
Quiz A – Key
9-4 Chapter 9 Sampling Distributions and Confidence Intervals for Proportions
Quiz A 9-5
9-6 Chapter 9 Sampling Distributions and Confidence Intervals for Proportions

Quiz B 9-7
Chapter 9: Sampling Distributions and Confidence Intervals for Proportions – Quiz B
Name ________________________________________
9.2.6 Find and interpret confidence intervals.
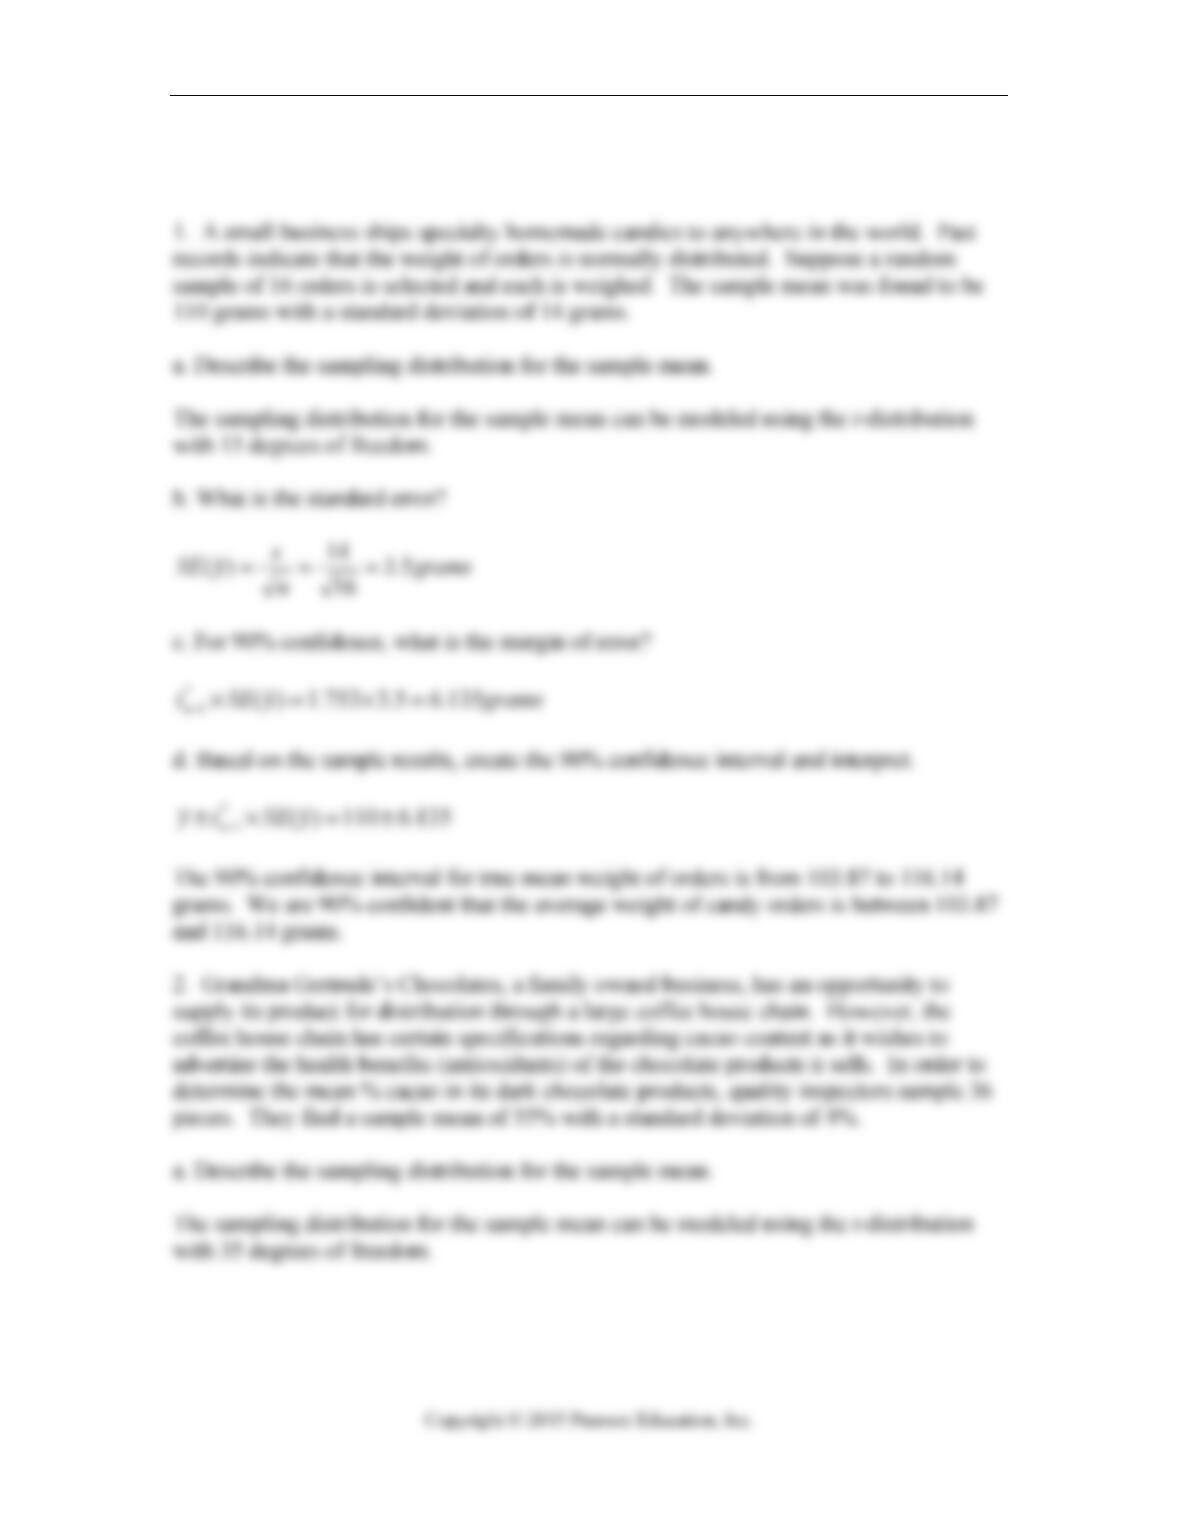
1. A small business ships specialty homemade candies to anywhere in the world. Past
records indicate that the weight of orders is normally distributed. Suppose a random
sample of 16 orders is selected and each is weighed. The sample mean was found to be
110 grams with a standard deviation of 14 grams.
a. Describe the sampling distribution for the sample mean.
b. What is the standard error?
c. For 90% confidence, what is the margin of error?
d. Based on the sample results, create the 90% confidence interval and interpret.
9.2.6 Find and interpret confidence intervals.
2. Grandma Gertrude’s Chocolates, a family owned business, has an opportunity to
supply its product for distribution through a large coffee house chain. However, the
coffee house chain has certain specifications regarding cacao content as it wishes to
advertise the health benefits (antioxidants) of the chocolate products it sells. In order to
determine the mean % cacao in its dark chocolate products, quality inspectors sample 36
pieces. They find a sample mean of 55% with a standard deviation of 4%.
a. Describe the sampling distribution for the sample mean.
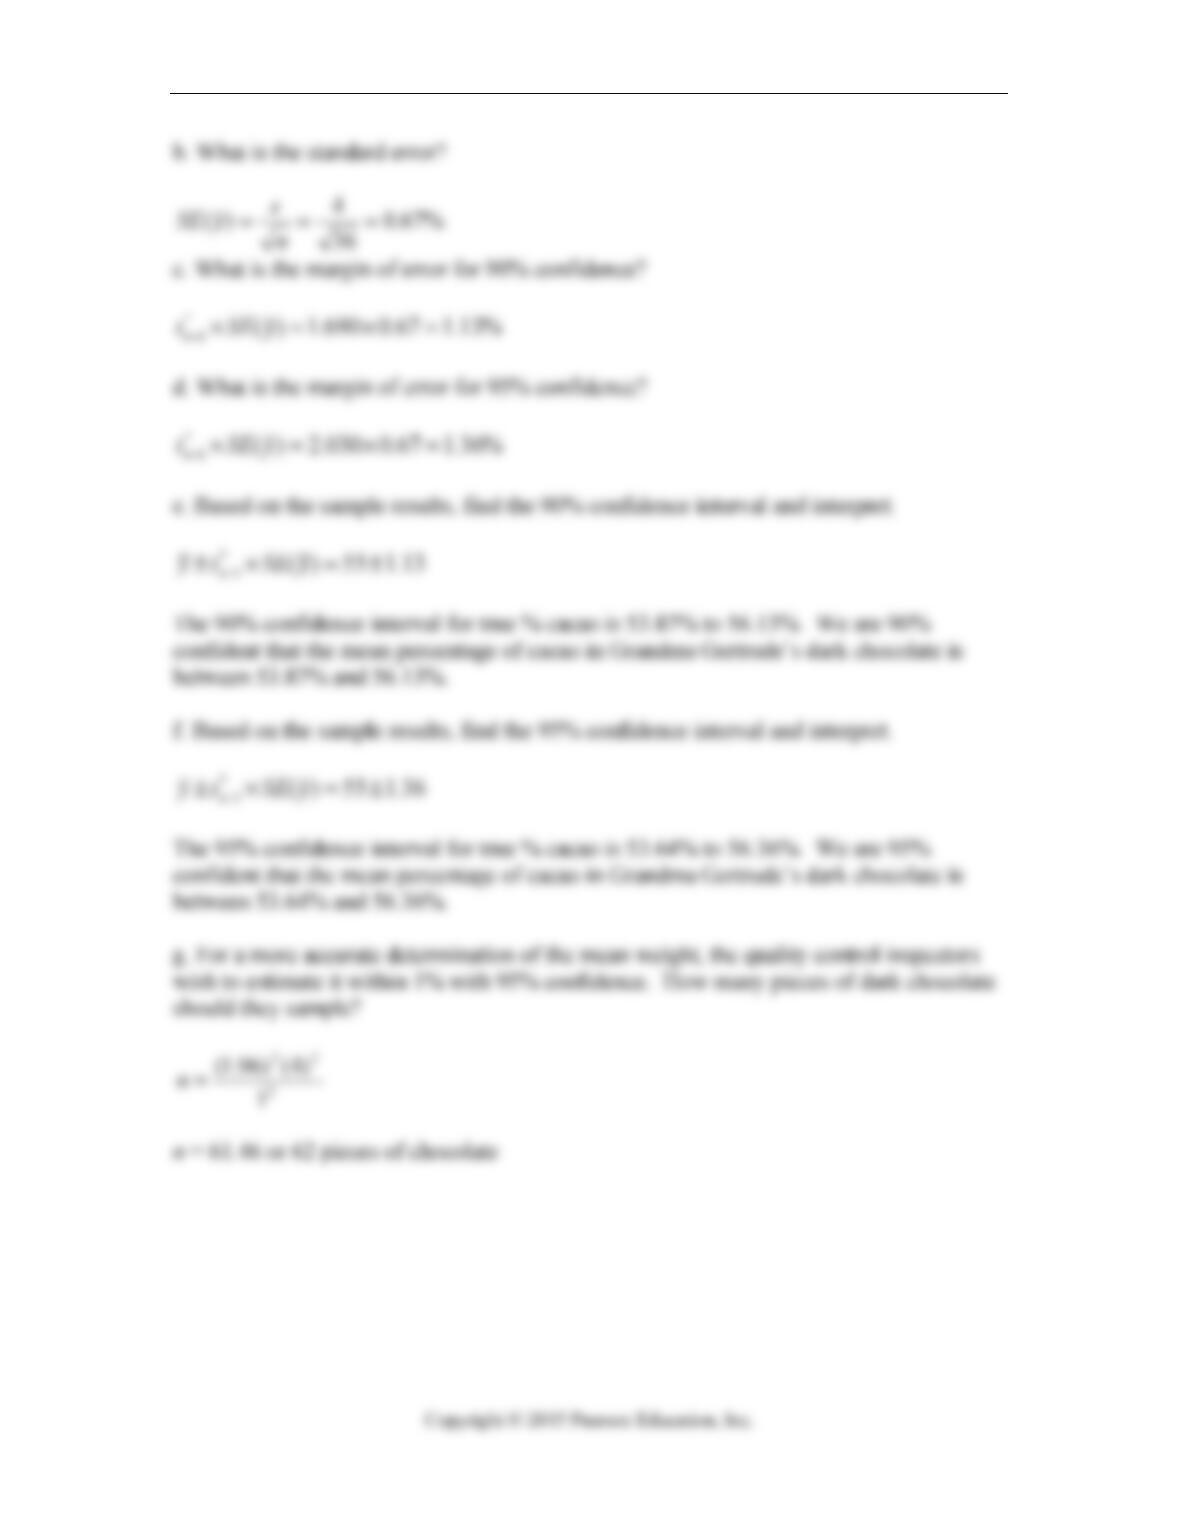
b. What is the standard error?
c. What is the margin of error for 90% confidence?
d. What is the margin of error for 95% confidence?
e. Based on the sample results, find the 90% confidence interval and interpret.
f. Based on the sample results, find the 95% confidence interval and interpret.
g. For a more accurate determination of the mean weight, the quality control inspectors
wish to estimate it within 1% with 95% confidence. How many pieces of dark chocolate
should they sample?
9.2.6 Find and interpret confidence intervals.
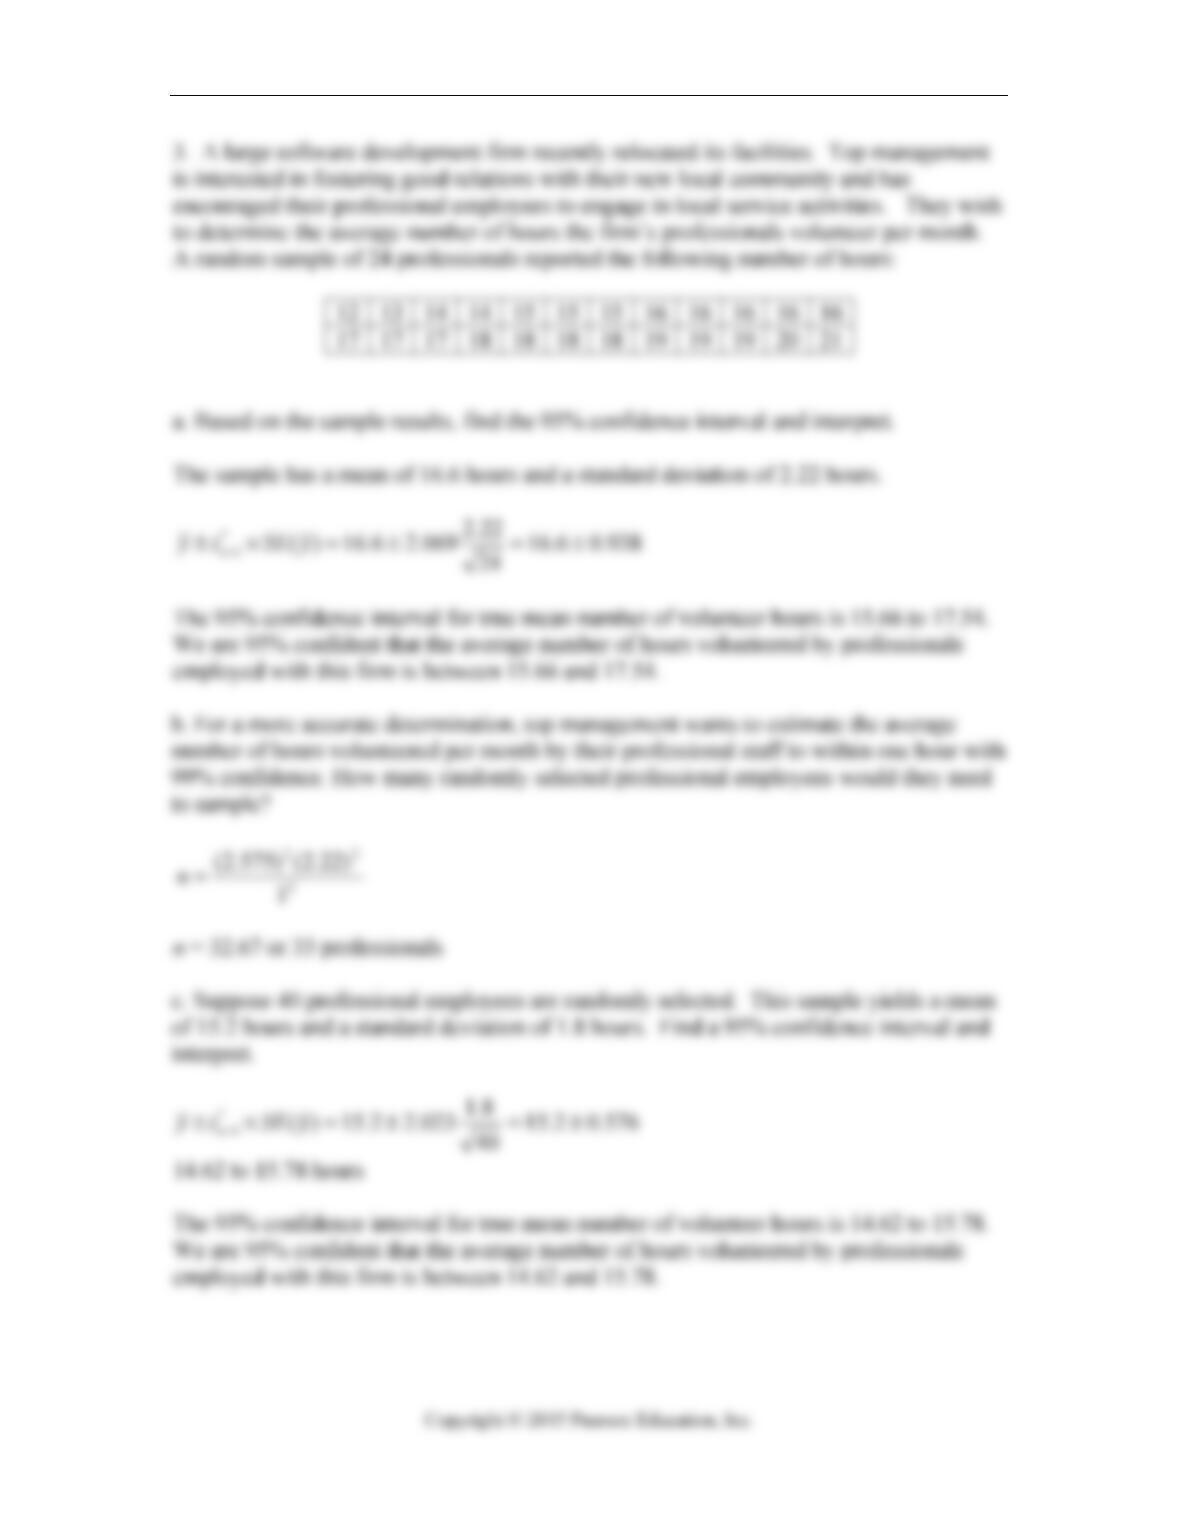
3. A large software development firm recently relocated its facilities. Top management
is interested in fostering good relations with their new local community and has
encouraged their professional employees to engage in local service activities. They wish
to determine the average number of hours the firm’s professionals volunteer per month.
A random sample of 24 professionals reported the following number of hours:
12 13 14 14 15 15 15 16 16 16 16 16
17 17 17 18 18 18 18 19 19 19 20 21
a. Based on the sample results, find the 95% confidence interval and interpret.

9-8 Chapter 9 Sampling Distributions and Confidence Intervals for Proportions
b. For a more accurate determination, top management wants to estimate the average
number of hours volunteered per month by their professional staff to within one hour
with 99% confidence. How many randomly selected professional employees would they
need to sample?
c. Suppose 40 professional employees are randomly selected. This sample yields a mean
of 15.2 hours and a standard deviation of 1.8 hours. Find a 95% confidence interval and
interpret.
9.4.8 Find sample sizes.
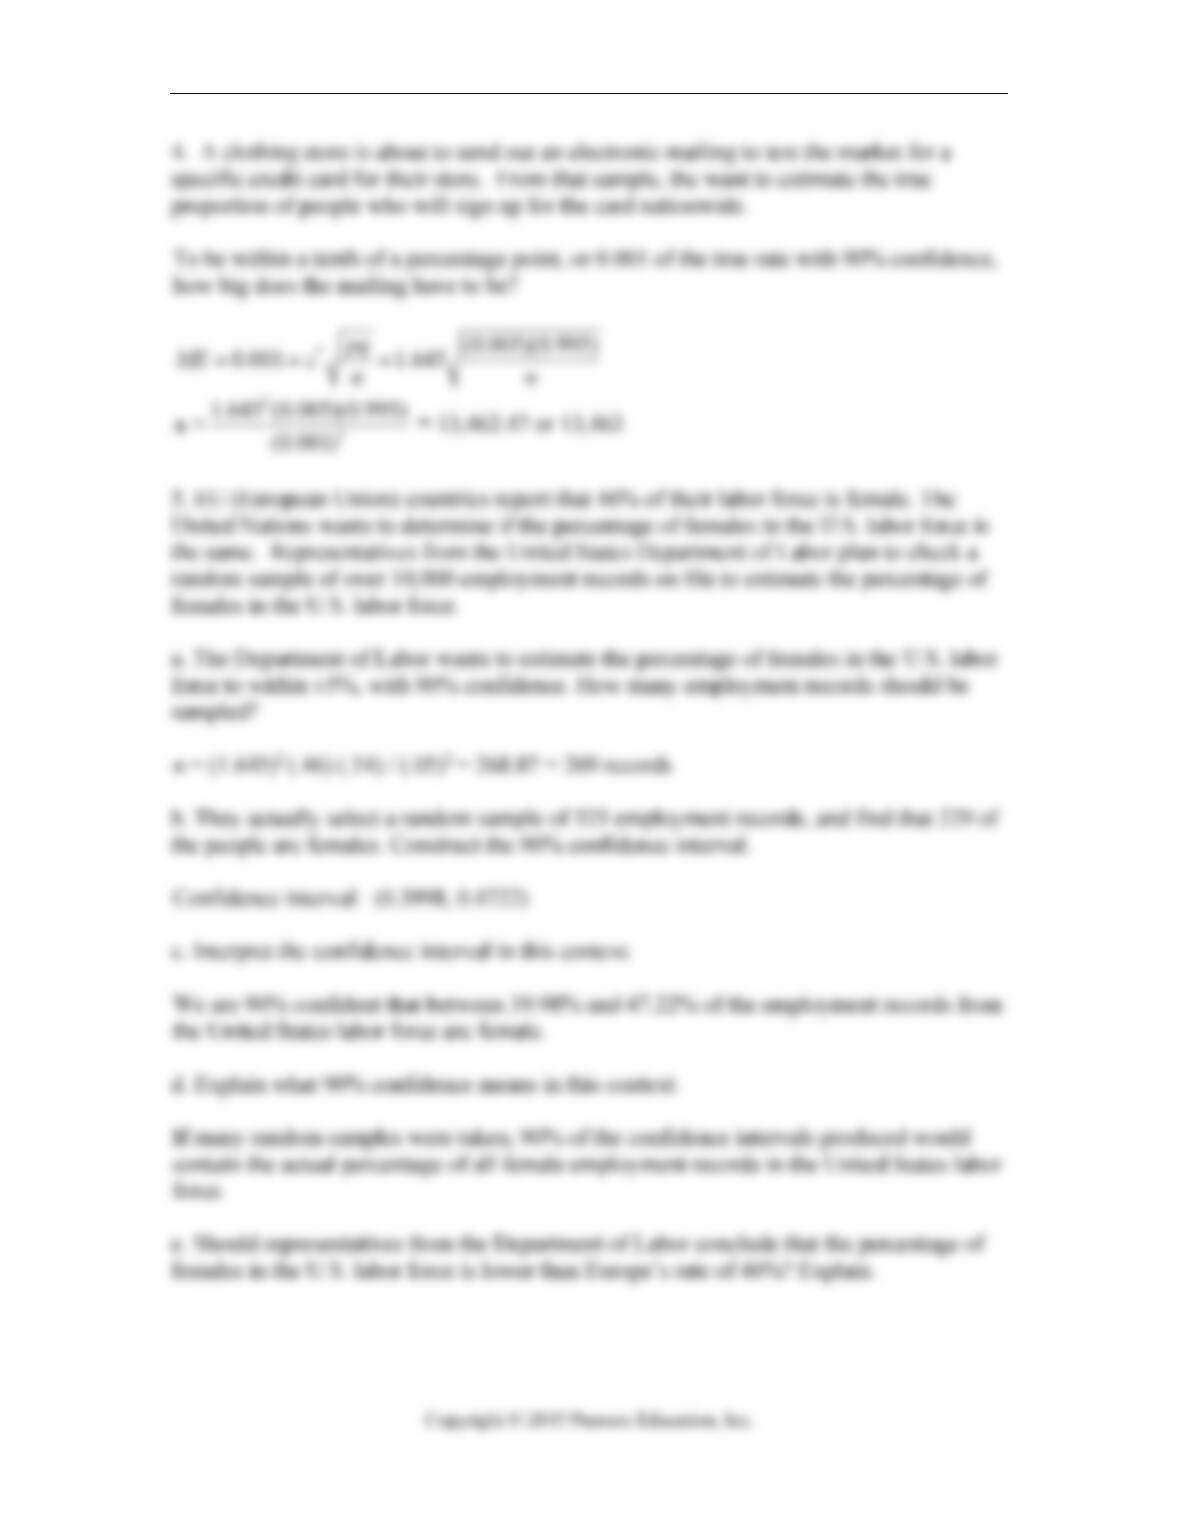
4. A clothing store is about to send out an electronic mailing to test the market for a
specific credit card for their store. From that sample, the want to estimate the true
proportion of people who will sign up for the card nationwide. To be within a tenth of a
percentage point, or 0.001 of the true rate with 90% confidence, how big does the mailing
have to be? Similar mailings in the past lead them to expect about 0.5% of the people
receiving the offer will accept it.
9.2.6 Find and interpret confidence intervals.
5. EU (European Union) countries report that 46% of their labor force is female. The
United Nations wants to determine if the percentage of females in the U.S. labor force is
the same. Representatives from the United States Department of Labor plan to check a
random sample of over 10,000 employment records on file to estimate the percentage of
females in the U.S. labor force.
a. The Department of Labor wants to estimate the percentage of females in the U.S. labor
force to within ±5%, with 90% confidence. How many employment records should be
sampled?
b. They actually select a random sample of 525 employment records, and find that 229 of
the people are females. Construct the 90% confidence interval.
c. Interpret the confidence interval in this context.
d. Explain what 90% confidence means in this context.
e. Should representatives from the Department of Labor conclude that the percentage of
females in the U.S. labor force is lower than Europe’s rate of 46%? Explain.
f. Are the assumptions and conditions for constructing a confidence interval met?
Explain.
Quiz B 9-9
Chapter 9: Sampling Distributions and Confidence Intervals for Proportions
– Quiz B – Key
9-10 Chapter 9 Sampling Distributions and Confidence Intervals for Proportions
Quiz B 9-11
9-12 Chapter 9 Sampling Distributions and Confidence Intervals for Proportions
Quiz B 9-13

9-14 Chapter 9 Sampling Distributions and Confidence Intervals for Proportions
Chapter 9: Sampling Distributions and Confidence Intervals for Proportions – Quiz C
– Multiple Choice Name ________________________________________
9.2.6 Find and interpret confidence intervals.
1. EU (European Union) countries report that 46% of their labor force is female. The
United Nations wants to determine if the percentage of females in the U.S. labor force is
the same. Representatives from the United States Department of Labor select a random
sample of 525 from over 10,000 employment records on file and find that 229 are female.
The 90% confidence interval for the proportion of females in the U.S. labor force is
A. 0.3998 to 0.4722
B. 0.2747 to 0.5973
C. 0.1776 to 0.6944
D. 0.4235 to 0.5679
E. 0.1243 to 0.7100
9.2.6 Find and interpret confidence intervals.
2. EU (European Union) countries report that 46% of their labor force is female. The
United Nations wants to determine if the percentage of females in the U.S. labor force is
the same. Based on a sample of 500 employment records, representatives from the
United States Department of Labor find that the 95% confidence interval for the
proportion of females in the U.S. labor force is .357 to .443. Which of the following is the
correct interpretation?
A. The percentage of females in the U.S. labor force is between 35.7% and 44.3%.
B. We are 95% confident that between 35.7% and 44.3% of the persons in the U.S. labor
force is female.
C. The margin of error for the true percentage of females in the U.S. labor force is
between 35.7% and 44.3%.
D. All samples of size 500 will yield a percentage of females in the U.S. labor force that
falls within 35.7% and 44.3%.
E. None of the above.
9.2.6 Find and interpret margins of error.
3. EU (European Union) countries report that 46% of their labor force is female. The
United Nations wants to determine if the percentage of females in the U.S. labor force is
the same. Based on a sample of 500 employment records, representatives from the
United States Department of Labor find that 240 are female. What is the margin of error
for the 95% confidence interval of the proportion of females in the U.S. labor force?
A. 0.022
B. 0.044
C. 0.036
D. 0.056
E. 0.089

Quiz C 9-15
9.2.7 Find and interpret confidence intervals.
4. EU (European Union) countries report that 46% of their labor force is female. The
United Nations wants to determine if the percentage of females in the U.S. labor force is
the same. Based on a sample of 500 employment records, representatives from the
United States Department of Labor find that the 95% confidence interval for the
proportion of females in the U.S. labor force is .357 to .443. If the Department of Labor
wishes to tighten its interval, they should
A. increase the confidence level.
B. decrease the sample size.
C. increase the sample size.
D. Both A and B
E. Both A and C
9.2.6 Check that inference conditions are satisfied.
5. All else being equal, increasing the level of confidence desired will
A. tighten the confidence interval.
B. decrease the margin of error.
C. increase precision.
D. increase the margin of error.
E. Both A and D.
9.2.6 Check that inference conditions are satisfied.
6. Which of the following is not an assumption and/or condition required for
constructing a confidence interval for the proportion?
A. Randomization condition
B. Linearity condition
C. Success/Failure condition
D. 10% condition
E. None of the above
9.2.6 Find and interpret margins of error.
7. Automobile mechanics conduct diagnostic tests on 150 new cars of particular make
and model to determine the extent to which they are affected by a recent recall due to
faulty catalytic converters. They find that 42 of the new cars tested do have faulty
catalytic converters. What is the margin of error for a 99% confidence interval based on
these sample results?
A. 0.0366
B. 0.0719
C. 0.0944
D. 0.1140
E. 0.2876

9-16 Chapter 9 Sampling Distributions and Confidence Intervals for Proportions
9.2.7 Find and interpret confidence intervals.
8. Automobile mechanics conduct diagnostic tests on 150 new cars of particular make
and model to determine the extent to which they are affected by a recent recall due to
faulty catalytic converters. They find that 42 of the new cars tested do have faulty
catalytic converters. The 99% confidence interval for the true proportion of new cars
with faulty catalytic converters is
A. 0.1856 to 0.3744
B. 0.2434 to 0.3166
C. 0.2081 to 0.3519
D. 0.1660 to 0.3940
E. 0.1243 to 0.4123
9.4.8 Find sample sizes.
9. The U.S. Department of Labor wants to estimate the percentage of females in the labor
force to within ±5% with 90% confidence. As a planning value they use 46%, the
reported percentage of females in the labor force of EU (European Union) countries.
How many employment records should be sampled?
A. 121
B. 269
C. 451
D. 382
E. 1000
9.4.8 Find sample sizes.
10. The U.S. Department of Labor wants to estimate the percentage of females in the
labor force to within ±2% with 90% confidence. As a planning value they use 46%, the
reported percentage of females in the labor force of EU (European Union) countries.
How many employment records should be sampled?
A. 121
B. 269
C. 451
D. 382
E. 1681

Quiz C 9-17
Chapter 9: Confidence Intervals and Hypothesis Tests for Means – Quiz C – Key

9-18 Chapter 9 Sampling Distributions and Confidence Intervals for Proportions
Chapter 9: Sampling Distributions and Confidence Intervals for Proportions – Quiz D
– Multiple Choice Name ________________________________________
9.2.7 Find and interpret confidence intervals.
1. A recent poll of 120 adults who frequent the local farmer’s market found that 54 have
purchased reusable cloth bags for their groceries. The 95% confidence interval for the
proportion of adults who have purchased reusable cloth bags is
A. 0.361 to 0.539
B. 0.4046 to 0.4954
C. 0.4383 to 0.4617
D. 0.205 to 0.525
E. 0.3856 to 0.4896
9.2.6 Find and interpret margins of error.
2. A recent poll of 120 adults who frequent the local farmer’s market found that 54 have
purchased reusable cloth bags for their groceries. Based on these data, what is the margin
of error for a 95% confidence interval of the proportion of adults who have purchased
reusable cloth bags?
A. 0.0454
B. 0.0117
C. 0.089
D. 0.075
E. 0.0432
9.2.7 Find and interpret confidence intervals.
3. One division of a large defense contractor manufactures telecommunication
equipment for the military. This division reports that 12% of non-electrical components
are reworked. Management wants to determine if this percentage is the same as the
percentage rework for the company’s electrical components. Based on a random sample
of 450 electrical components, they find that 46 had to be reworked. The 99% confidence
interval is
A. 0.0652, 0.1388
B. 0.0432, 0.1608
C. 0.0763, 0.1277
D. 0.0541, 0.1499
E. None of the above.

Quiz D 9-19
9.2.7 Find and interpret confidence intervals.
4. One division of a large defense contractor manufactures telecommunication
equipment for the military. This division reports that 12% of non-electrical components
are reworked. Management wants to determine if this percentage is the same as the
percentage rework for the company’s electrical components. The Quality Control
Department plans to check a random sample of the over 10,000 electrical components
manufactured across all divisions. The resulting 95% confidence interval based on these
data is .0758 to .1339. Which of the following is the correct interpretation?
A. The percentage of electronic components that are reworked is between 7.6% and
13.4%.
B. We are 95% confident that between 7.6% and 13.4% of electrical components are
reworked.
C. The margin of error for the true percentage of electrical components that are
reworked is between 7.6% and 13.4%.
D. All samples of size 450 will yield a percentage of reworked electrical components
that falls within 7.6% and 13.4%.
E. None of the above.
9.2.7 Find and interpret confidence intervals.
5. One division of a large defense contractor manufactures telecommunication
equipment for the military. This division reports that 12% of non-electrical components
are reworked. Management wants to determine if this percentage is the same as the
percentage rework for the company’s electrical components. The Quality Control
Department plans to check a random sample of the over 10,000 electrical components
manufactured across all divisions. The 95% confidence interval based on this data is
.0758 to .1339. Should management conclude that the percentage of rework for
electrical components is lower than the rate of 12% for non-electrical components?
A. Yes, because the lower limit of the confidence interval is 7.6%.
B. Yes, because 12% is contained with the 95% confidence interval.
C. No, because 12% is contained with the 95% confidence interval.
D. No, because the upper limit of the confidence interval is 13.4%.
E. None of the above.
9.4.8 Find sample sizes.
6. The Quality Control Department wants to estimate the true percentage of rework for
electrical components to within ±4%, with 99% confidence. Based on similar past
studies, the percentage of rework was found to be 12%. How many components should
they sample?
A. 651
B. 1000
C. 344
D. 438
E. 579

9-20 Chapter 9 Sampling Distributions and Confidence Intervals for Proportions
9.4.8 Find sample sizes.
7. The unemployment rate of persons with a disability is typically higher than for those
with no disability. Recent statistics report that the national rate of unemployment among
this group is 14.5%. The local government of a small city wants to determine the rate in
its region to within ±5%, with 90% confidence. How many individuals with disabilities
should they sample?
A. 135
B. 191
C. 354
D. 678
E. 981
9.4.8 Find sample sizes.
8. The unemployment rate of persons with a disability is typically higher than for those
with no disability. Recent statistics report that the national rate of unemployment among
this group is 14.5%. The local government of a small city wants to determine the rate in
its region to within ±5%, with 95% confidence. How many individuals with disabilities
should they sample?
A. 135
B. 191
C. 354
D. 678
E. 981
9.2.6 Find and interpret margins of error.
9. All else being equal, decreasing the level of confidence desired will
A. widen the confidence interval.
B. increase the margin of error.
C. increase certainty.
D. decrease the margin of error.
E. Both A and B.
9.2.7 Find and interpret confidence intervals.
10. Recent statistics report that the national rate of unemployment among persons with
disabilities is 14.5%. The local government of a small city samples 200 individuals with
disabilities and finds that 44 are unemployed. The 99% confidence interval for the
unemployment rate among persons with disabilities in their city is
A. 0.1646 to 0.2754
B. 0.1735 to 0.2665
C. 0.1446 to 0.2954
D. 0.1332 to 0.3298
E. 0.1145 to 0.4374

Quiz D 9-21
Chapter 9: Confidence Intervals for Proportions – Quiz D – Key