
Chapter 09 Characterizing Risk and Return Answer Key
Multiple Choice Questions
1.
Which of these includes any capital gain (or loss) that occurred as well as any income that
you received from a specific investment?
2.
Which of these is the dollar return characterized as a percentage of money invested?
Difficulty: 1 Easy
Learning Objective: 09-01 Compute an investment’s dollar and percentage return.
Topic: Return
3.
Which of these is a measure summarizing the overall past performance of an investment?
4.
Which of these statements is true?
Learning Objective: 09-01 Compute an investment’s dollar and percentage return.
Topic: Historical Returns
5.
Which of the following is defined as the volatility of an investment, which includes firm
specific risk as well as market risk?
6.
Which of these is a measure of risk to reward earned by an investment over a specific
period of time?

7.
Which of the following is an index that tracks 500 companies, which allows for a great deal
of diversification?
8.
Which of these is defined as a combination of investment assets held by an investor?
9.
Which of the following is defined as the portion of total risk that is attributable to firm or
industry factors and can be reduced through diversification?
10.
Which of these is the portion of total risk that is attributable to overall economic factors?
11.
Which of the following is another term for market risk?
12.
Which of the following is the concept and procedure for combining securities into a
portfolio to minimize risk?
13.
Which of these is the investor’s combination of securities that achieves the highest
expected return for a given risk level?
14.
Which of these is the term for portfolios with the highest return possible for each risk
level?
15.
Which of the following makes this a true statement: The shape of the efficient frontier
implies that:
16.
Which of the following is a measurement of the co-movement between two variables that
ranges between -1 and +1?
17.
To find the percentage return of an investment:
18.
Which statement is true?
19.
We commonly measure the risk-return relationship using which of the following?
20.
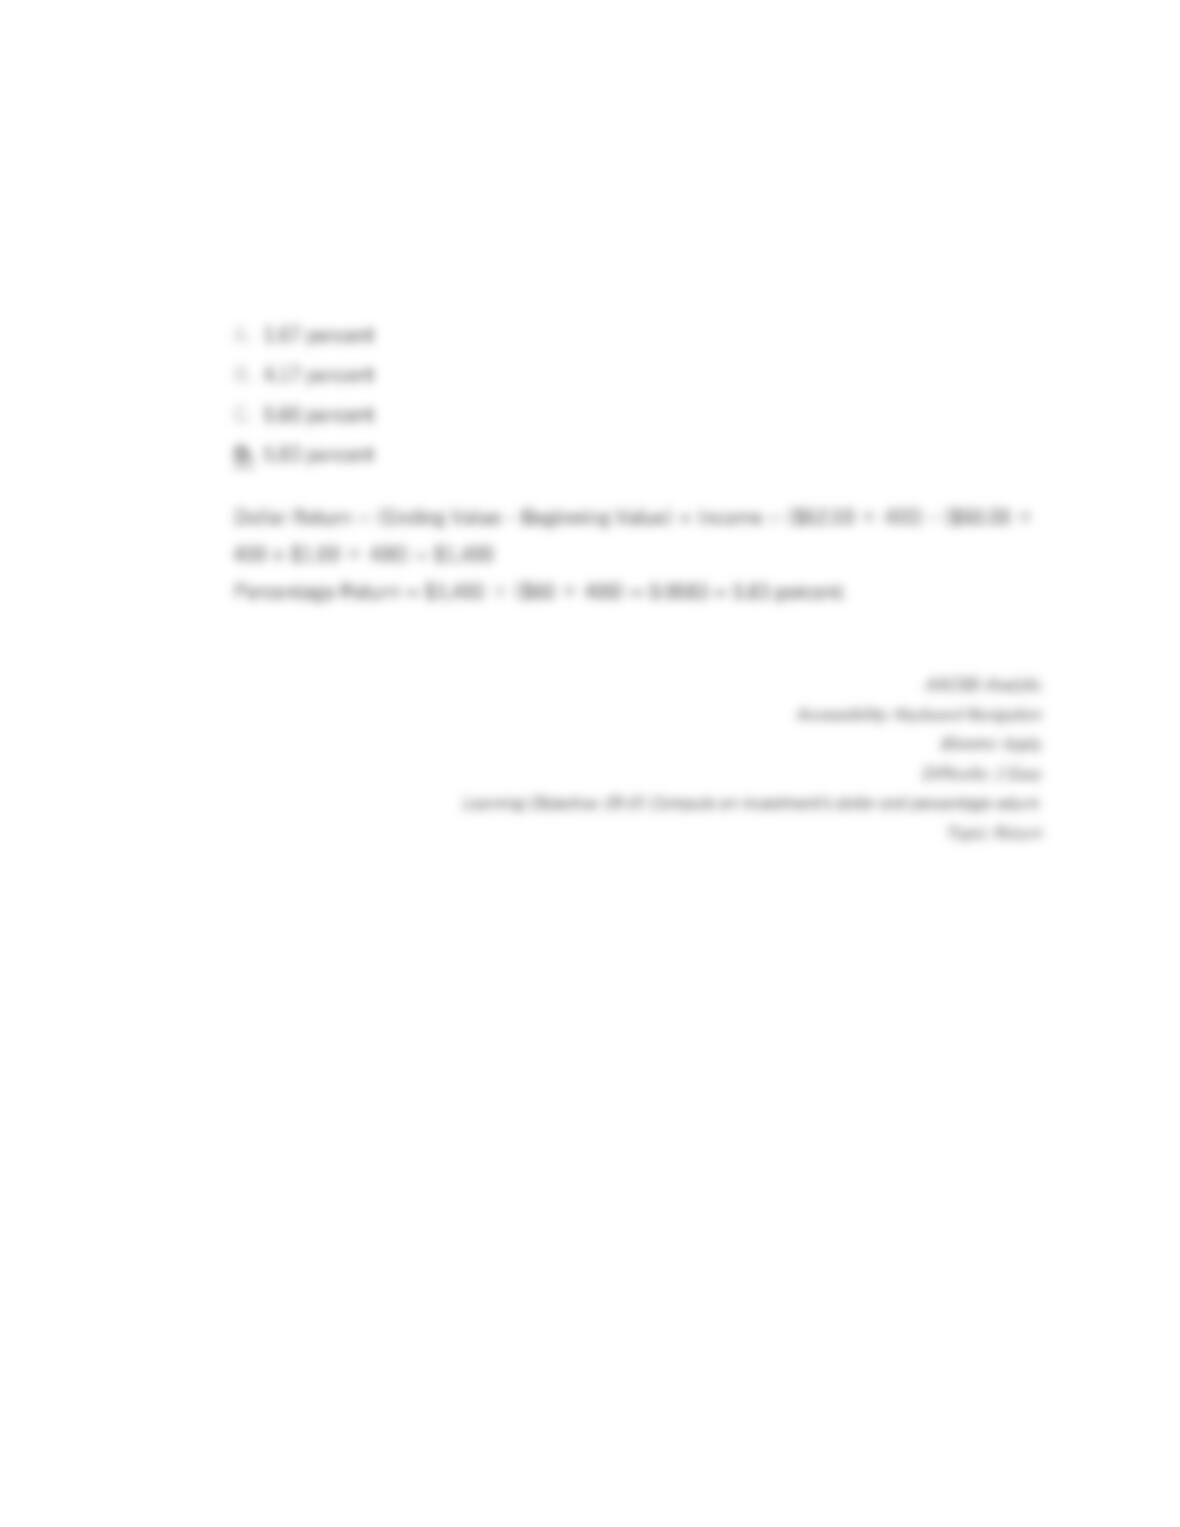
Investment Return MedTech Corp. stock was $50.95 per share at the end of last year.
Since then, it paid a $0.45 per share dividend. The stock price is currently $62.50. If you
owned 500 shares of MedTech, what was your percent return?
21.
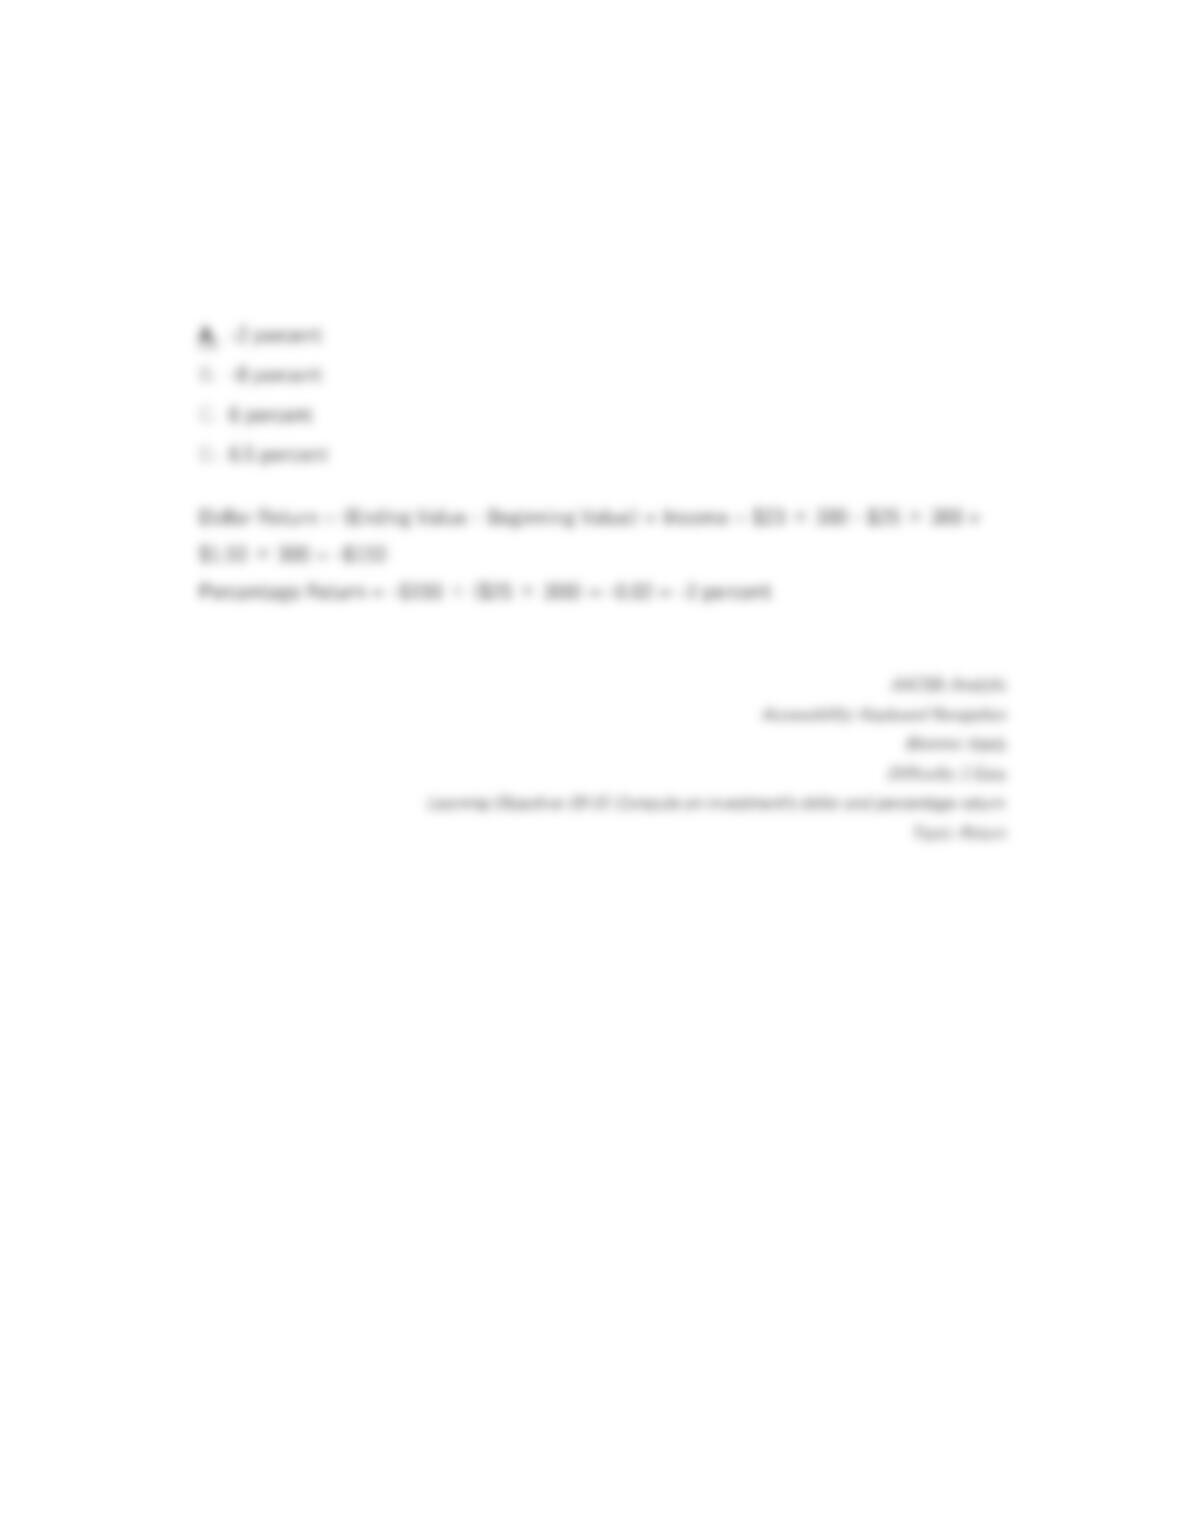
Investment Return Rx Corp. stock was $60.00 per share at the end of last year. Since
then, it paid a $1.00 per share dividend last year. The stock price is currently $62.50. If you
owned 400 shares of Rx, what was your percent return?
22.
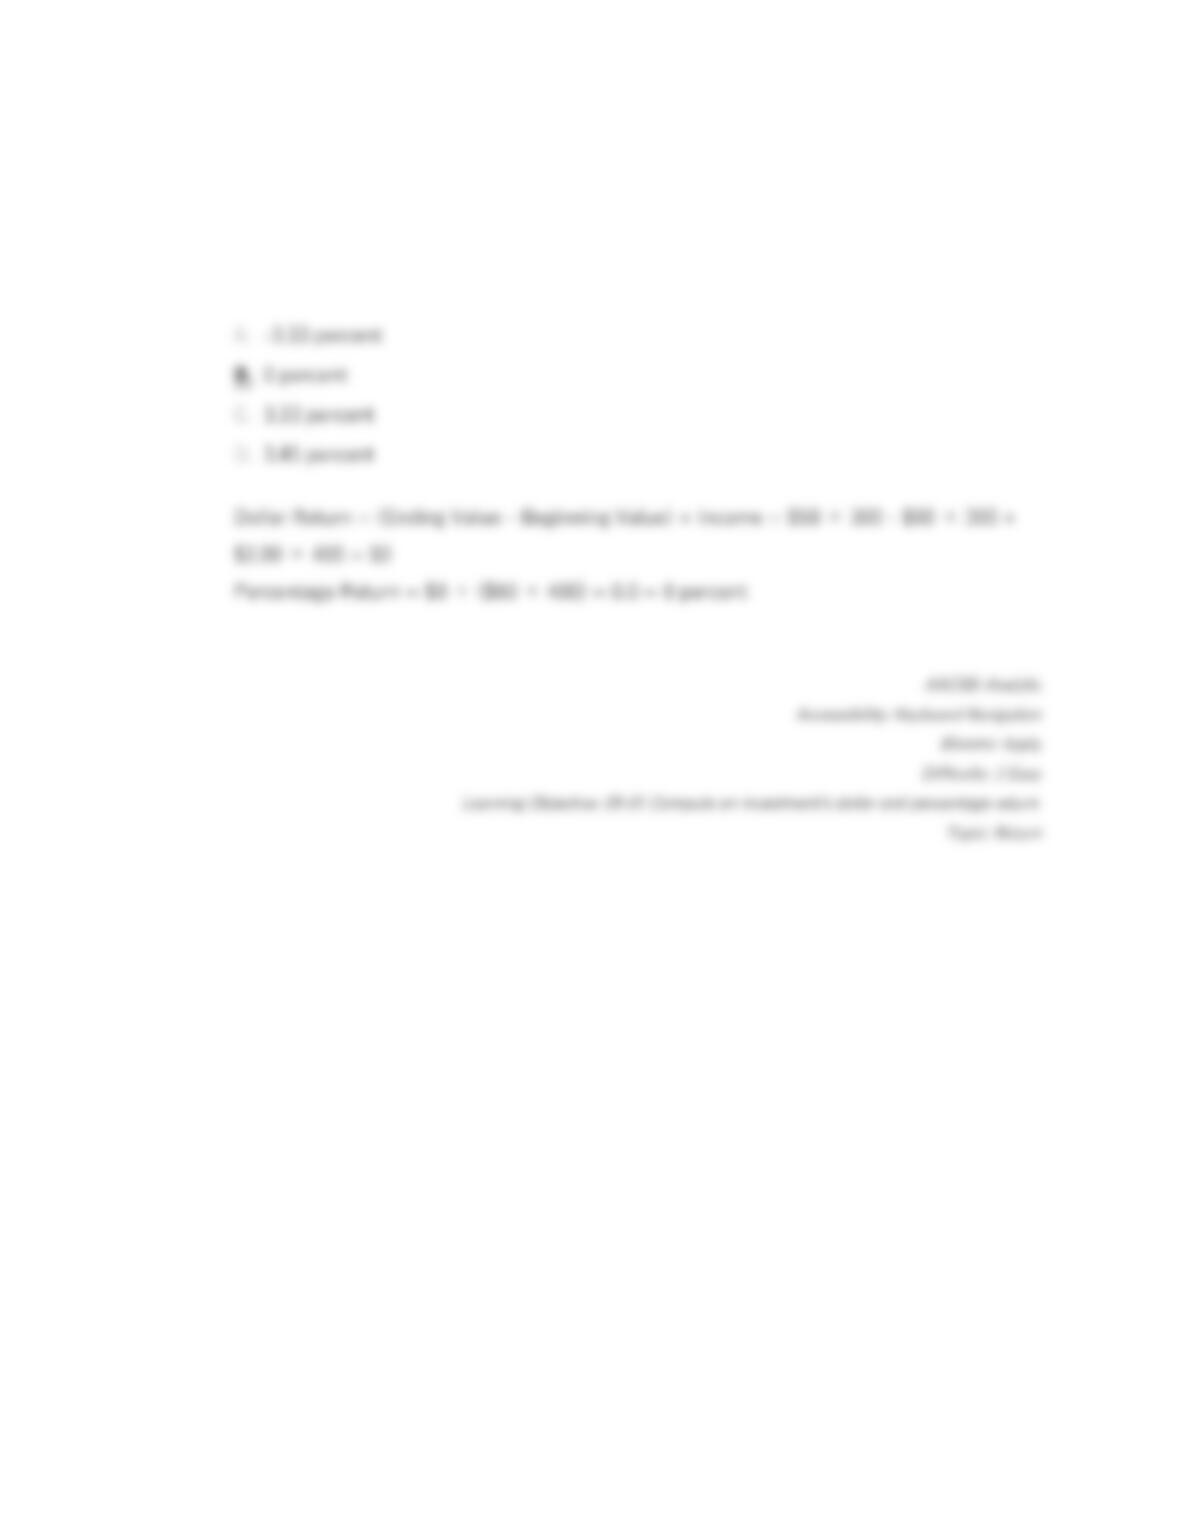
Investment Return TechNo stock was $25 per share at the end of last year. Since then, it
paid a $1.50 per share dividend last year. The stock price is currently $23. If you owned
300 shares of TechNo, what was your percent return?
23.
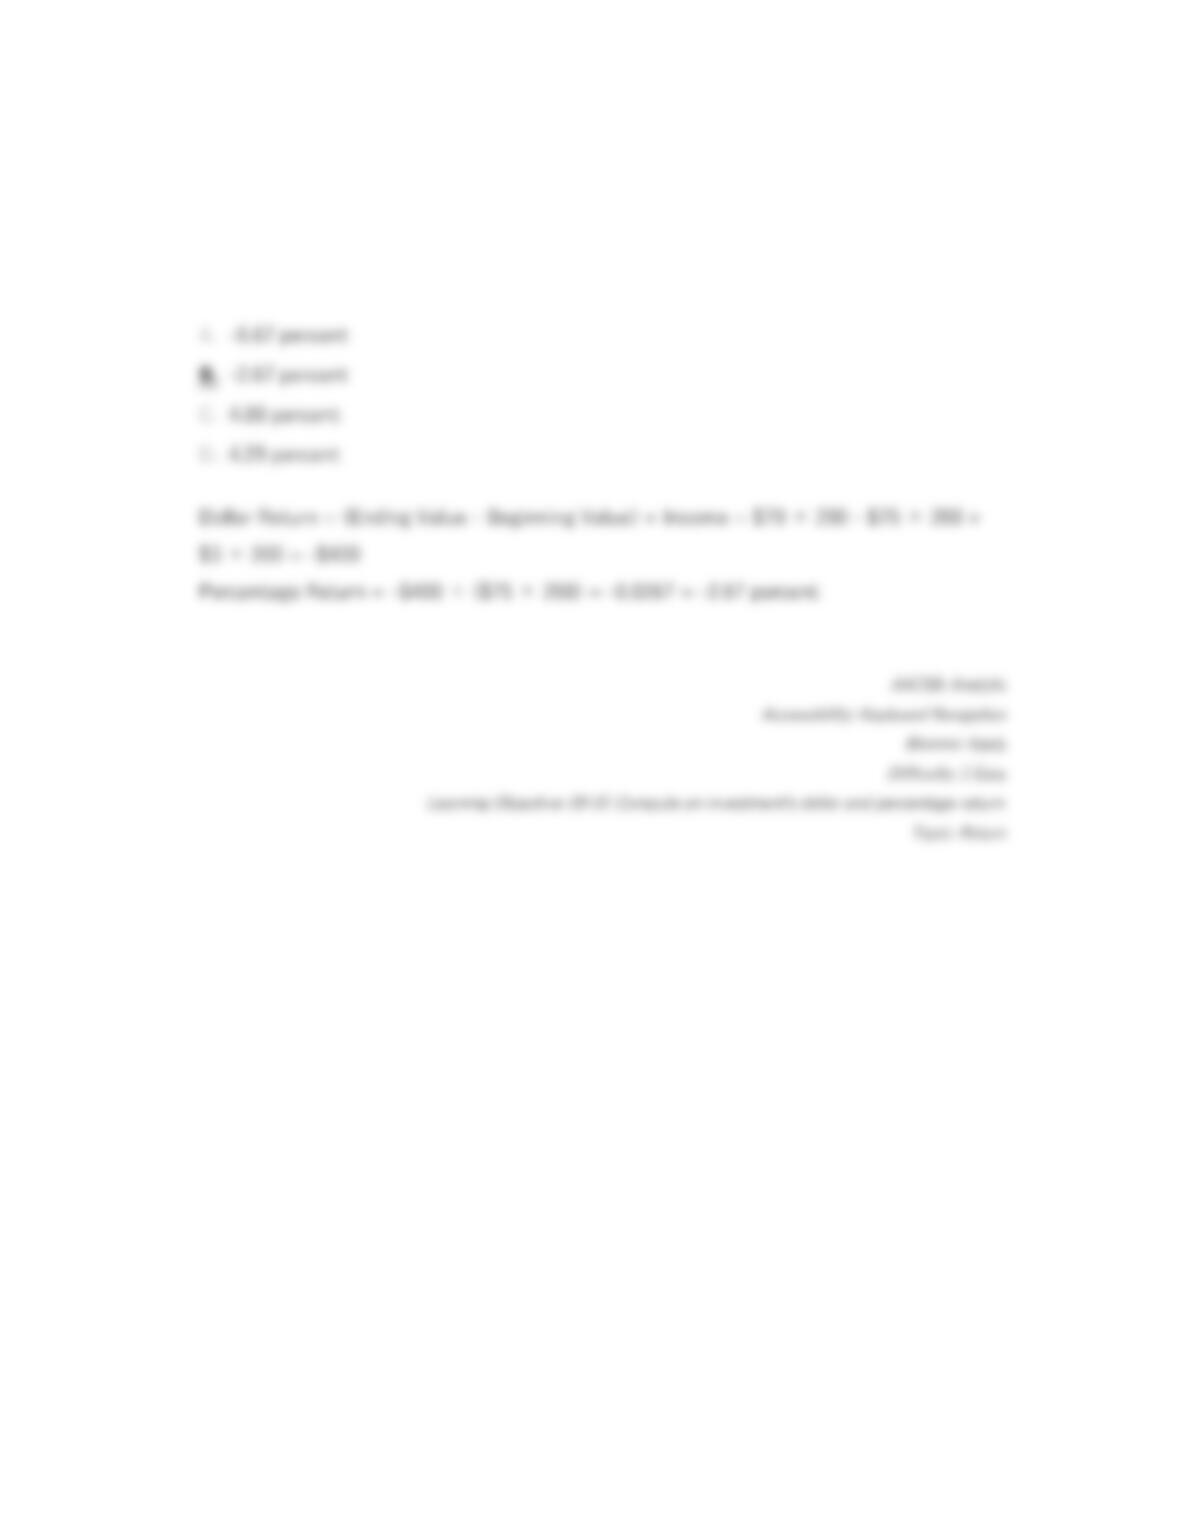
Investment Return Noble stock was $60.00 per share at the end of last year. Since then,
it paid a $2.00 per share dividend last year. The stock price is currently $58. If you owned
400 shares of Noble, what was your percent return?
24.
Investment Return WayCo stock was $75 per share at the end of last year. Since then, it
paid a $3 per share dividend last year. The stock price is currently $70. If you owned 200
shares of WayCo, what was your percent return?
25.
Total Risk Rank the following three stocks by their level of total risk, highest to lowest.
Rail Haul has an average return of 10 percent and standard deviation of 15 percent. The
average return and standard deviation of Idol Staff are 15 percent and 25 percent; and of
Poker-R-Us are 12 percent and 35 percent.
26.
Total Risk Rank the following three stocks by their level of total risk, highest to lowest.
Rail Haul has an average return of 8 percent and standard deviation of 10 percent. The
average return and standard deviation of Idol Staff are 10 percent and 20 percent; and of
Poker-R-Us are 6 percent and 15 percent.
27.
Risk versus Return Rank the following three stocks by their risk-return relationship, best
to worst. Rail Haul has an average return of 10 percent and standard deviation of 15
percent. The average return and standard deviation of Idol Staff are 15 percent and 25
percent; and of Poker-R-Us are 12 percent and 35 percent.
28.
Risk versus Return Rank the following three stocks by their risk-return relationship, best
to worst. Rail Haul has an average return of 8 percent and standard deviation of 10
percent. The average return and standard deviation of Idol Staff are 10 percent and 20
percent; and of Poker-R-Us are 6 percent and 15 percent.
29.
Dominant Portfolios Determine which one of these three portfolios dominates another.
Name the dominated portfolio and the portfolio that dominates it. Portfolio Blue has an
expected return of 14 percent and risk of 19 percent. The expected return and risk of
portfolio Yellow are 15 percent and 18 percent, and for the Purple portfolio are 16 percent
and 21 percent.
30.
Dominant Portfolios Determine which one of these three portfolios dominates another.
Name the dominated portfolio and the portfolio that dominates it. Portfolio Blue has an
expected return of 7 percent and risk of 10 percent. The expected return and risk of
portfolio Yellow are 13 percent and 10 percent, and for the Purple portfolio are 9 percent
and 14 percent.
31.
Dominant Portfolios Determine which one of these three portfolios dominates another.
Name the dominated portfolio and the portfolio that dominates it. Portfolio Blue has an
expected return of 13 percent and risk of 17 percent. The expected return and risk of
portfolio Yellow are 15 percent and 19 percent, and for the Purple portfolio are 12 percent
and 18 percent.