
Business Statistics: Part II: Modeling with Probability – Test B
Name___________________________________________________
Chapter 6: Determine and/or use an appropriate probability model.
1. A publishing company conducted a survey of its readership and found that 60%
subscribed to Food & Wine, 30% subscribed to Wine Spectator, and 25% subscribed to
both. The probability that a reader does not subscribe to either is
A. 0.10
B. 0.65
C. 0.50
D. 0.45
E. 0.35
Chapter 6: Determine and/or use an appropriate probability model.
2. A government agency has 6000 employees. As an alternative to the traditional five
day work week, employees were asked whether they preferred a four day work week (10
hours per day) or flexible hours. The table below shows the results by age category.
What is the probability that an employee at this government agency prefers a four day
work week?
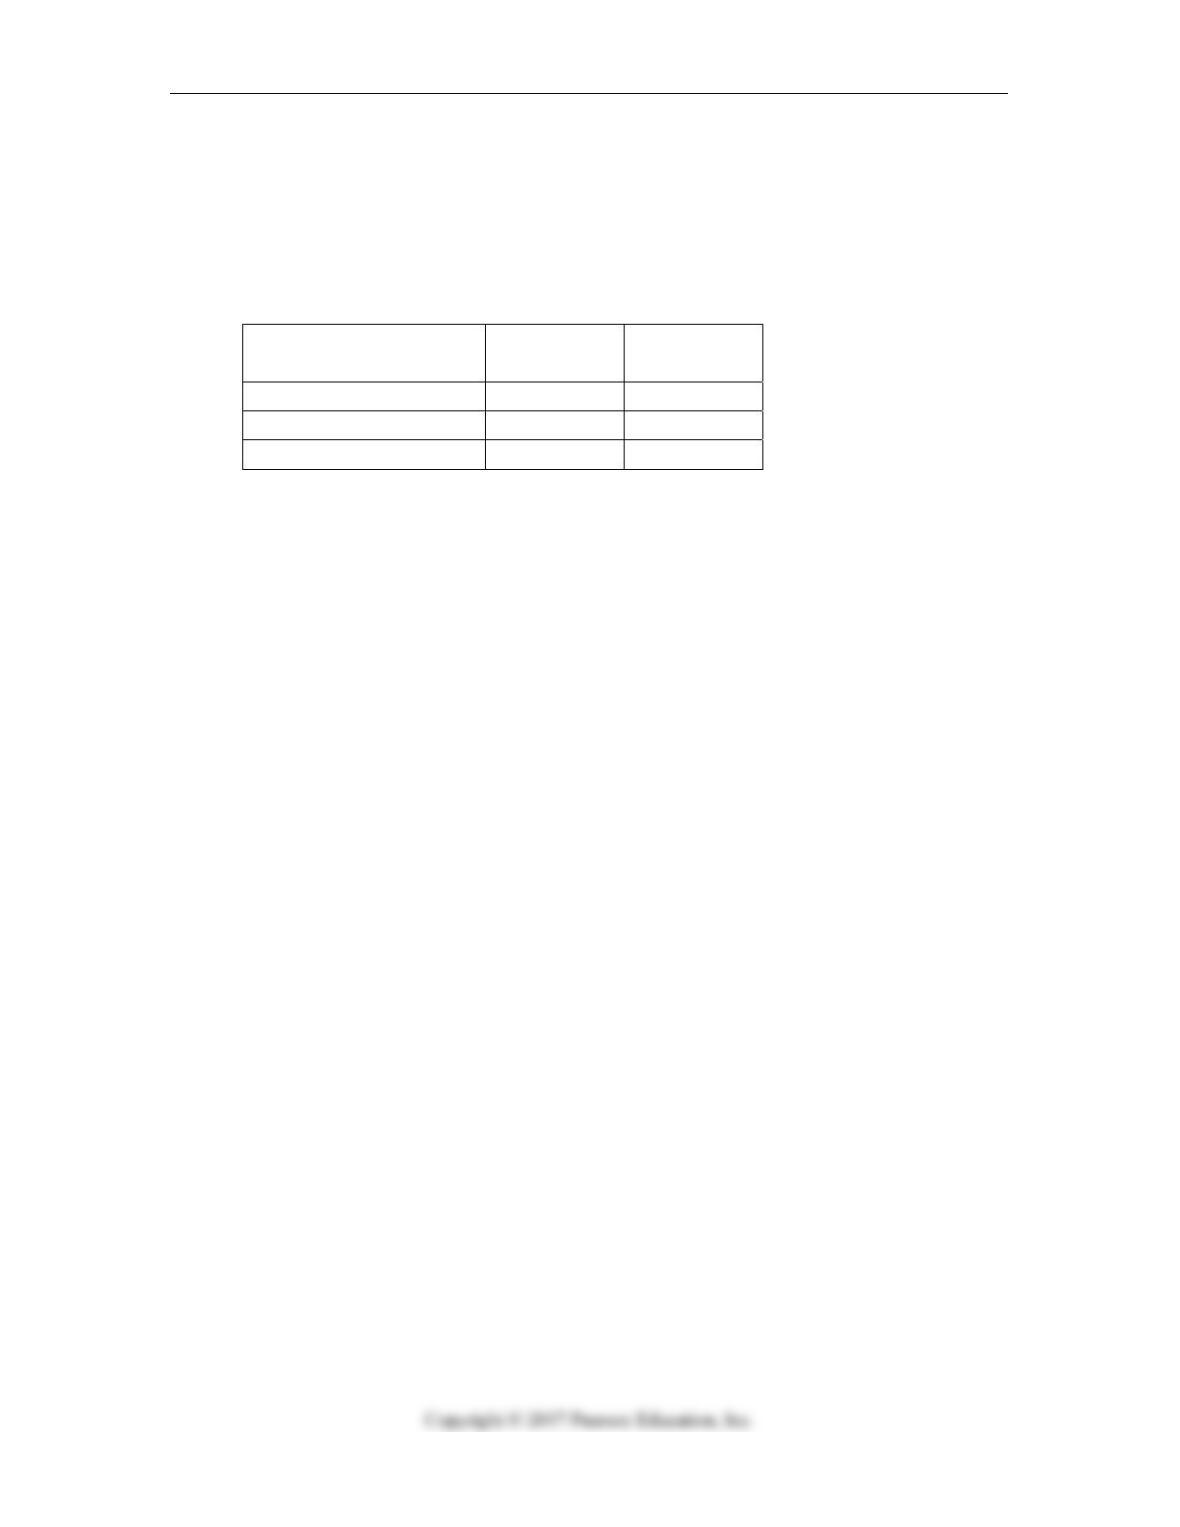
Age Category Prefers 4
Day Week
Prefers Flex
Hours
Under 30 600 300
30 – 45 1200 1500
Over 45 2100 300
A. 0.54
B. 0.15
C. 0.50
D. 0.35
E. 0.65
IIB-2 Part II: Modeling with Probability
Chapter 6: Determine and/or use an appropriate probability model.
3. A government agency has 6000 employees. As an alternative to the traditional five
day work week, employees were asked whether they preferred a four day work week (10
hours per day) or flexible hours. The table below shows the results by age category.
Which of the following statements is true about work week preferences and age
category?
Age Category Prefers 4
Day Week
Prefers Flex
Hours
Under 30 600 300
30 – 45 1200 1500
Over 45 2100 300
A. Work week preferences are independent of age category.
B. Work week preferences are mutually exclusive.
C. Work week preferences are not independent of age category.
D. Work week preferences are independent and mutually exclusive.
E. There is insufficient information to determine whether work week preferences and
age category are independent or mutually exclusive.
Chapter 6: Find the expected value and standard deviation of a random variable.
4. IT staff for a large corporation has developed the following probability distribution for
the number of calls requiring troubleshooting problems per day. Based on the
distribution, the expected number of calls per day is
Number of Calls Probability
0 .32
1 .35
2 .18
3 .10
4 .05
A. 2.77
B. 1.56
C. 1.21
D. 1.31
E. 1

Test B IIB-3
Chapter 6: Determine and/or use an appropriate probability model.
5. As a result of the financial crisis on Wall Street in September 2008 that required
federal government intervention, a survey showed that 40% of Americans reallocated
their investments to reduce exposure to the stock market. What is the probability that out
of 5 randomly selected Americans, none will have reallocated their investments in this
way?
A. 0.2592
B. 0.8154
C. 0.1699
D. 0.0778
E. 0.1234
Chapter 7: Use z‐scores to find probabilities, percentages, and values.
6. Suppose the time it takes for a purchasing agent to complete an online ordering
process is normally distributed with a mean of 8 minutes and a standard deviation of 2
minutes. What is the probability that it takes longer than 11 minutes for the purchasing
agent to complete the process?
A. 0.9332
B. 0.4332
C. 0.0668
D. 0.5668
E. none of the above
Chapter 9: Describe a sampling distribution model.
7. Suppose the time it takes for a purchasing agent to complete an online ordering
process is normally distributed with a mean of 8 minutes and a standard deviation of 2
minutes. Suppose a random sample of 25 ordering processes is selected. The standard
deviation of the sampling distribution of mean times is
A. 0.4 minutes
B. 2 minutes
C. 0.08 minutes
D. 1.6 minutes
E. 0.12 minutes
Chapter 8: Determine and analyze sampling methods; identify and understand biases.
8. A researcher is conducting a study on Internet use. He decides to first categorize the
population by education level (high school, college graduate, advanced degree, etc.) and
then survey a select number from each category. This sampling strategy is called
A. Systematic
B. Cluster
C. Random
D. Judgmental
E. Stratified

IIB-4 Part II: Modeling with Probability
Chapter 8: Determine and analyze sampling methods; identify and understand biases.
9. If a parameter is computed from a set of data, which of the following statements is
true?
A. The data are obtained from a census.
B. The data are obtained from a random sample.
C. The data is from a sample that is representative of the population.
D. The data are obtained from a stratified sample.
E. The data must be quantitative.
Chapter 8: Determine and analyze sampling methods; identify and understand biases.
10. A manufacturer of batteries routinely tests its products to determine lifetime (hours
of continuous usage). Suppose they select a sample of 30 AAA batteries and find that the
average lifetime is 1500 hours. This is a
A. parameter.
B. statistic.
C. sampling frame.
D. sample.
E. population.
Chapter 9: Find and interpret confidence intervals.
11. Which is true about a 99% confidence interval based on a given sample?
I. The interval contains 99% of the population.
II. Results from 99% of all samples will lie in this interval.
III. The interval is wider than a 95% confidence interval would be.
A. None
B. I only
C. II only
D. III only
E. I and III
Chapter 9: Find sample sizes.
12. A human resources manager at a large company wants to estimate the proportion of
employees that would be interested in reimbursement for college courses. If she wishes
to be 95% confident that her estimate is within 5% of the true proportion, how many
employees would need to be sampled?
A. 271
B. 385
C. 543
D. 646
E. 1234

Test B IIB-5
Chapter 7: Use the 68‐95‐99.7 Rule to find probabilities and intervals of values.
13. Assume that a set of test scores in an Introduction to Finance class is normally
distributed with a mean of 72 and a standard deviation of 8. Use the 68-95-99.7 rule to
find the percentage of scores greater than 88.
A. 0.15%
B. 0.3%
C. 2.5%
D. 5%
E. 95%
Chapter 7: Use the 68‐95‐99.7 Rule to find probabilities and intervals of values.
14. Assume that a set of test scores in an Introduction to Finance class is normally
distributed with a mean of 72 and a standard deviation of 8. Use the 68-95-99.7 rule to
find the percentage of scores between 80 and 96.
A. 13.5%
B. 15.85%
C. 30.7%
D. 2.5%
E. 25.5%
IIB-6 Part II: Modeling with Probability
Chapter 7: Assess Normality.
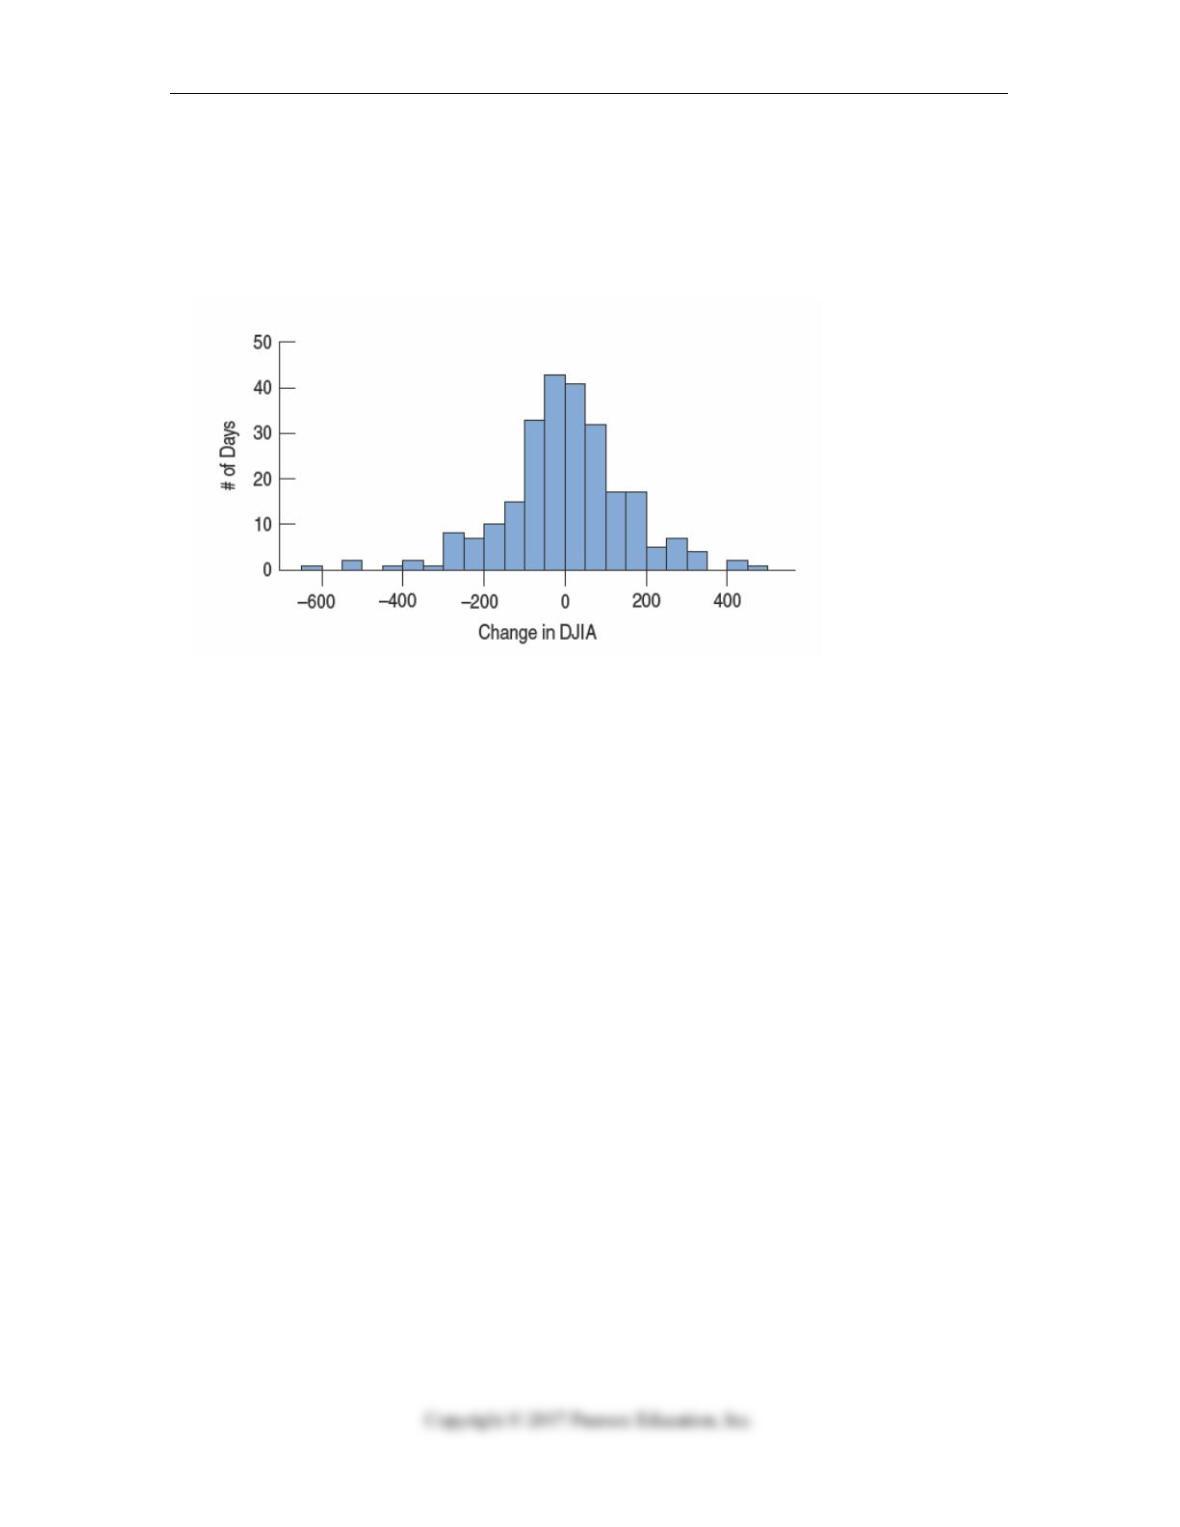
15. After the financial crisis of 2007/2008, the Dow Jones Industrial Average (DJIA)
improved from a low of 7278 on March 20, 2009, to new records just a few years later.
On August 8, 2011, the Dow dropped 634.8 points. A histogram of day-to-day changes in
the DJIA looked like the histogram below. An accurate description of the distribution of
changes in the DJIA is
A. The distribution is fairly symmetric.
B. The distribution is somewhat left skewed with a number of low outliers.
C. A normal probability plot would add information about the normality of the data
set.
D. Both A and C
E. Both B and C
Test B IIB-7
Chapter 7: Assess Normality.
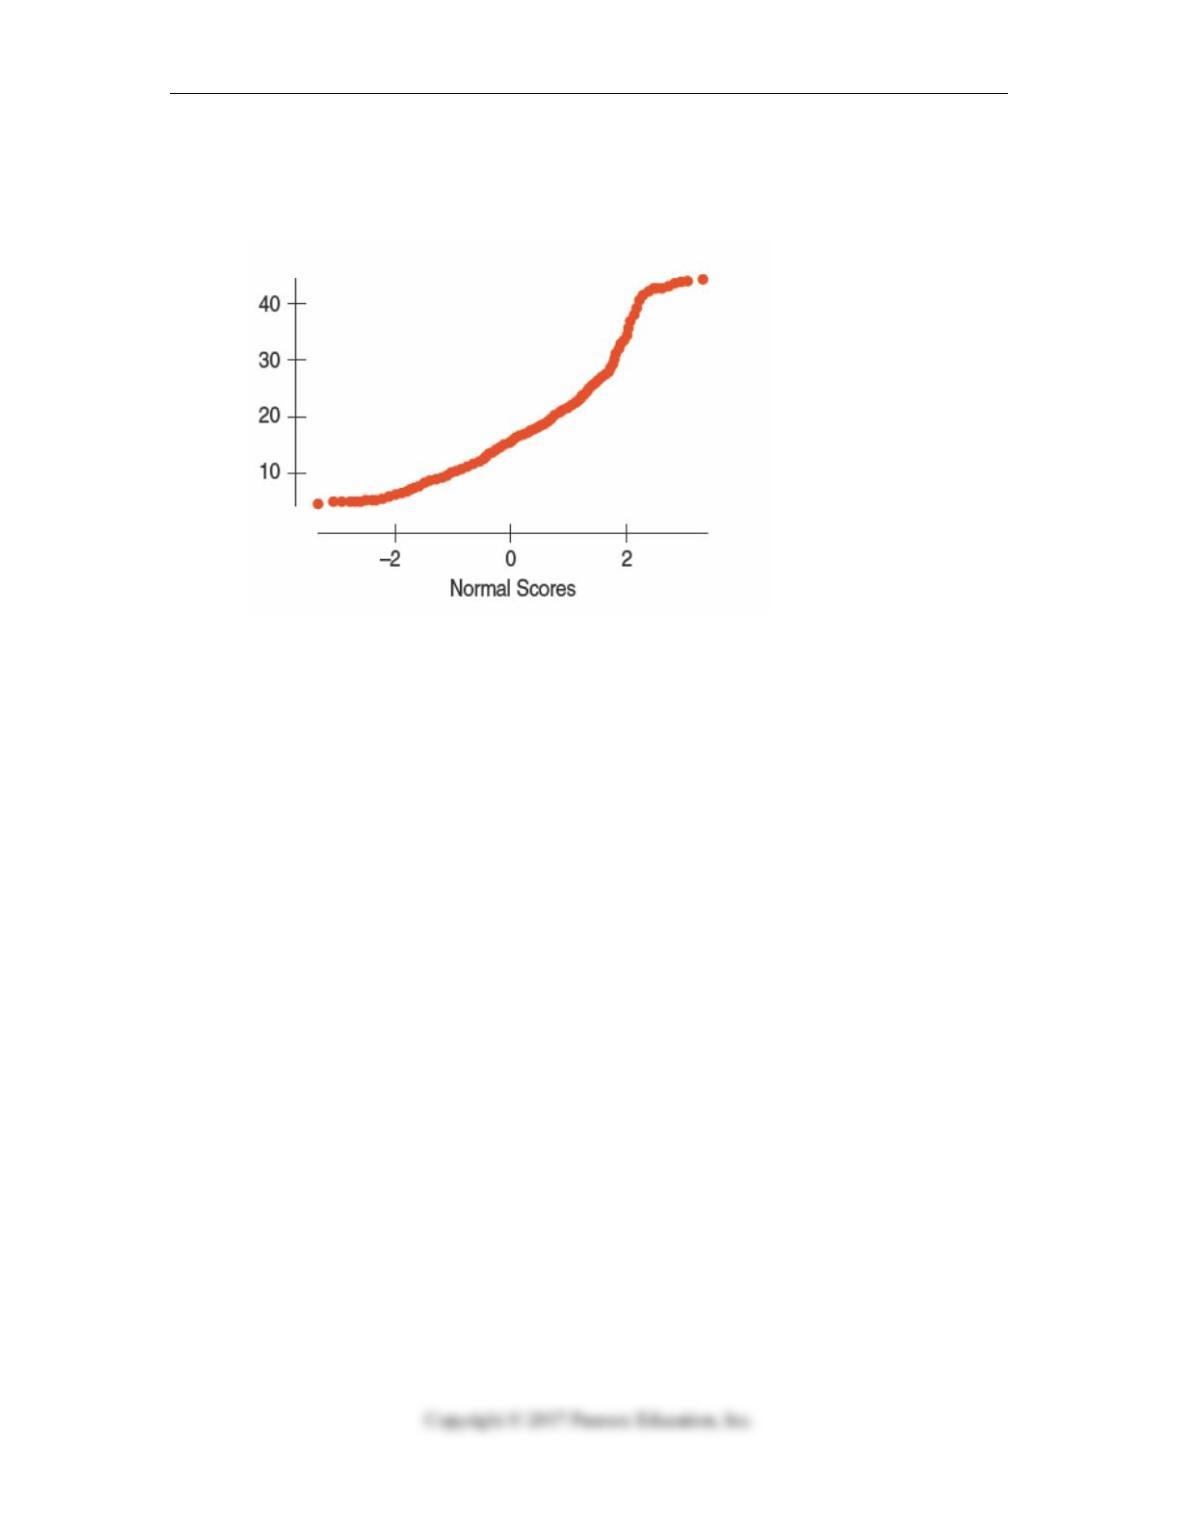
16. A Normal probability plot of the weights of individuals signed up for a popular diet
program is shown below. The best description of the plot is
A. The distribution is fairly symmetric.
B. The distribution is right skewed and nonlinear.
C. The kink in the bend success values that don’t continue the skewness consistently.
D. The distribution is left skewed and nonlinear.
E. B and C are correct.
Chapter 9: Find sample sizes.
17. Nine out of 25 randomly selected Students of WMU live in Southwest Michigan.
The result says that the true proportion could be as low as 0.17 or as high as 0.55. If we
want to reduce the margin of error from 0.19 to 0.10. Using the estimate of 0.36 based on
the initial sample, what sample size would be needed to achieve the reduced margin of
error?
A. 92
B. 85
C. 10
D. 50
E. Cannot be determined

IIB-8 Part II: Modeling with Probability
Chapter 9: Find and interpret the confidence interval.
18. Which is true about a 90% confidence interval based on a given sample?
I. The interval contains 90% of the population.
II. Results from 90% of all samples will lie in this interval.
III. The interval is smaller than a 95% confidence interval would be.
A. None
B. I only
C. II only
D. III only
E. I and III
Test B IIB-9
Business Statistics: Part II: Modeling with Probability – Test B- Key