
9
Writing and Images
Old line writing teachers like me were content with leaving photojournalism to photojournalists
and those skilled enough to teach that topic. Besides, photojournalism was a separate sphere of
journalism, and when I was working with newspapers, a photojournalist wouldn’t let a reporter
even touch any of the photo equipment. Photojournalism instructors were almost as touchy —
although all were terribly nice folks.
The material in this chapter is almost all
completely new to Writing for the Mass Media, and
it is another indicator the change in emphasis that
this edition represents from previous iterations of the text.
charts and graphs, and students need to understand how to use these for journalistic purpose —
the kinds of information necessary for a good chart and the rules governing the construction of
charts and graphs.
Key terms and concepts
Three types of shots. The three types of photos are based on how far away the photographer is
from the subject: establishing shots, mid-range shots and closeups. Students should know the
differences among the three and should understand why each is important. Beginning
photographers often feel self-conscious about what they are doing and believe they will irritate
their subjects if they get to close. They should work to overcome those feelings.
Chapter notes
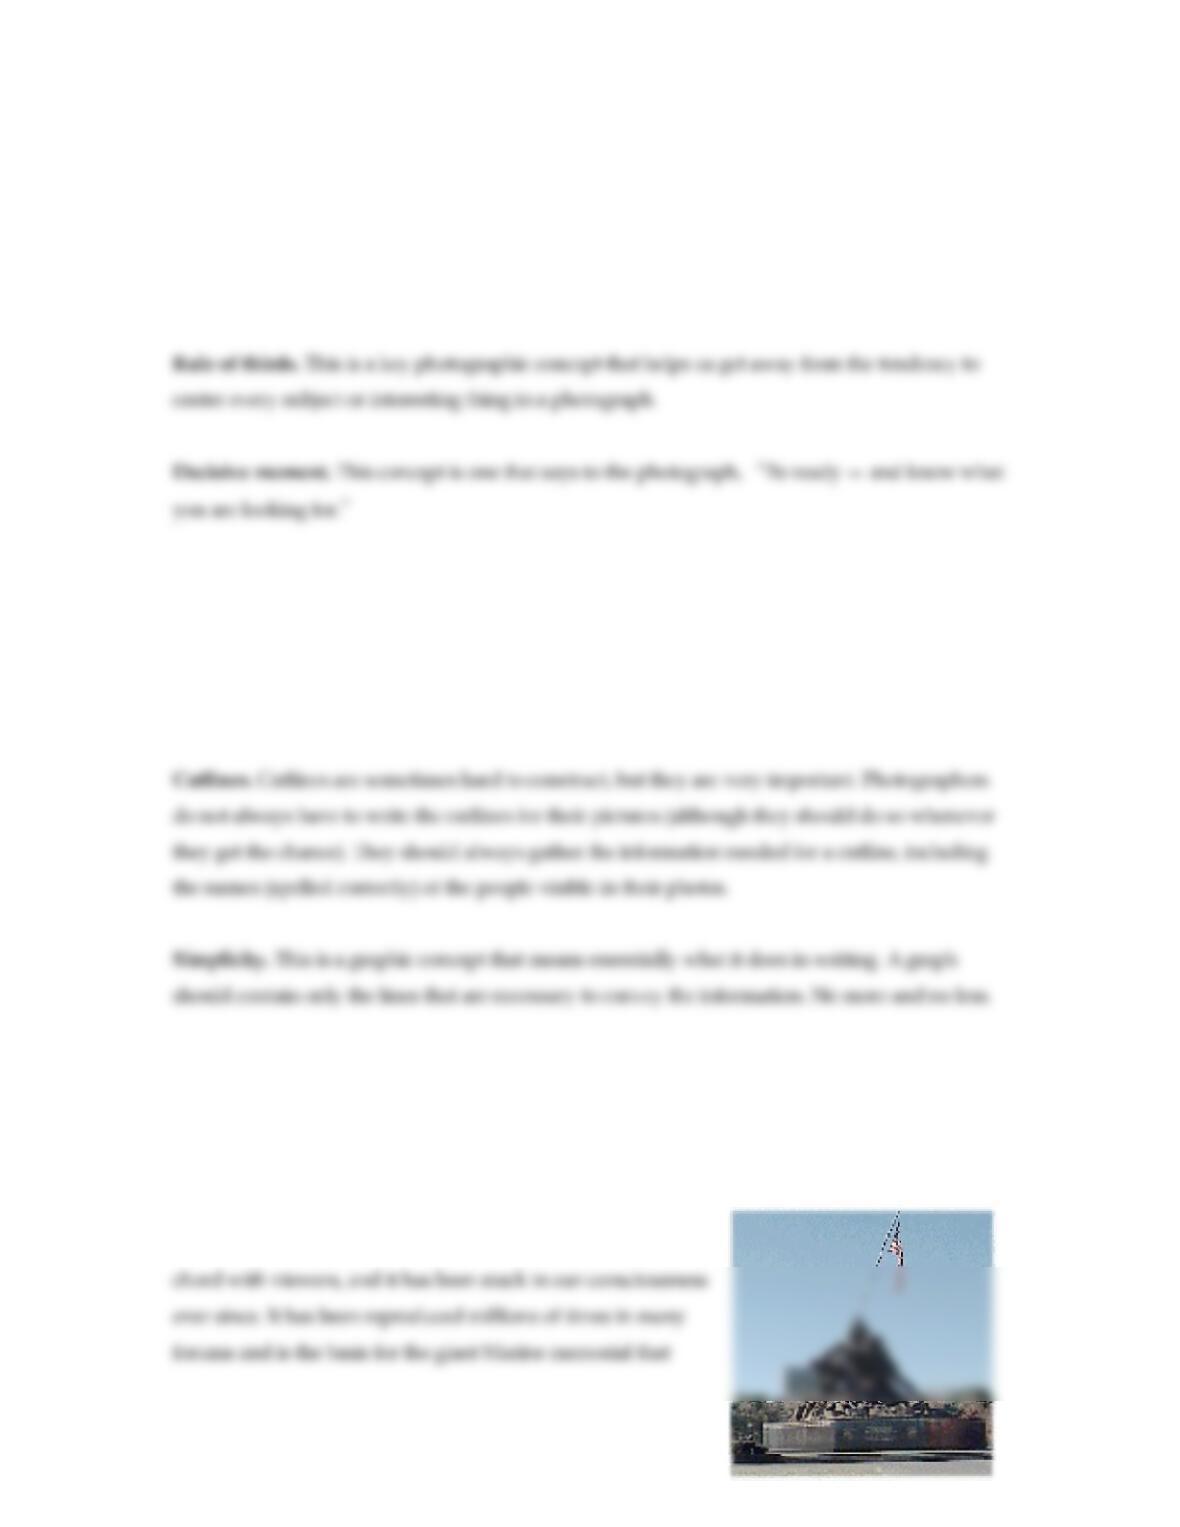
The iconic image. Few of us get to leave the impression that Joe Rosenthal did. Rosenthal was the
33-year-old Associated Press photographer who took the
picture of Marines raising the flag during the fierce battle of
Iwo Jima in the Pacific in 1945. That image struck an instant
Telling the truth. Daniel Okrent, the public editor of the New York Times, has wrote an excellent
piece in 2005 based on the decision by Times editors to run a picture of a grieving mother among
a number of babies killed by the Dec. 26 tsunami in the Indian Ocean. The photo is graphic and
difficult to look at. It is like many such photos that have burned themselves into our psyches.
tell
ut not the whole truth. Editors know that. Readers and viewers should
recognize it, too.
But Okrent goes beyond the decision to run the photo to talk about pictures themselves. Under
the provocative headline “No Picture Tells the Truth. The Best Do Better Than That,” Okrent
discusses the fact that no picture captures the entire event of which it is part. A picture can
part of the truth, b
News photos you can use. If you are interested in having timely photos for your publication or
web site — but can’t afford to subscribe to a professional news service — you can find them at a

ts who are learning about charts and how to
produce them should remember the following:
tes.
harts used by
newspapers every day. Look closely at the way they are put together.
d “data” is a plural noun and should have a plural verb. The word “
media” is plural also.
Tips for beginning graphics journalists. Studen
• Study charts that have been professionally produced by newspapers or news websi
The Associated Press has a graphics department that produces many c
Data is plural. The wor
Math. Many journalists say (sometimes jokingly, sometimes not) that they got into the profession
because they would not have to deal with a lot of math. For most working reporters, however,
xercises E
Exercise 6.7
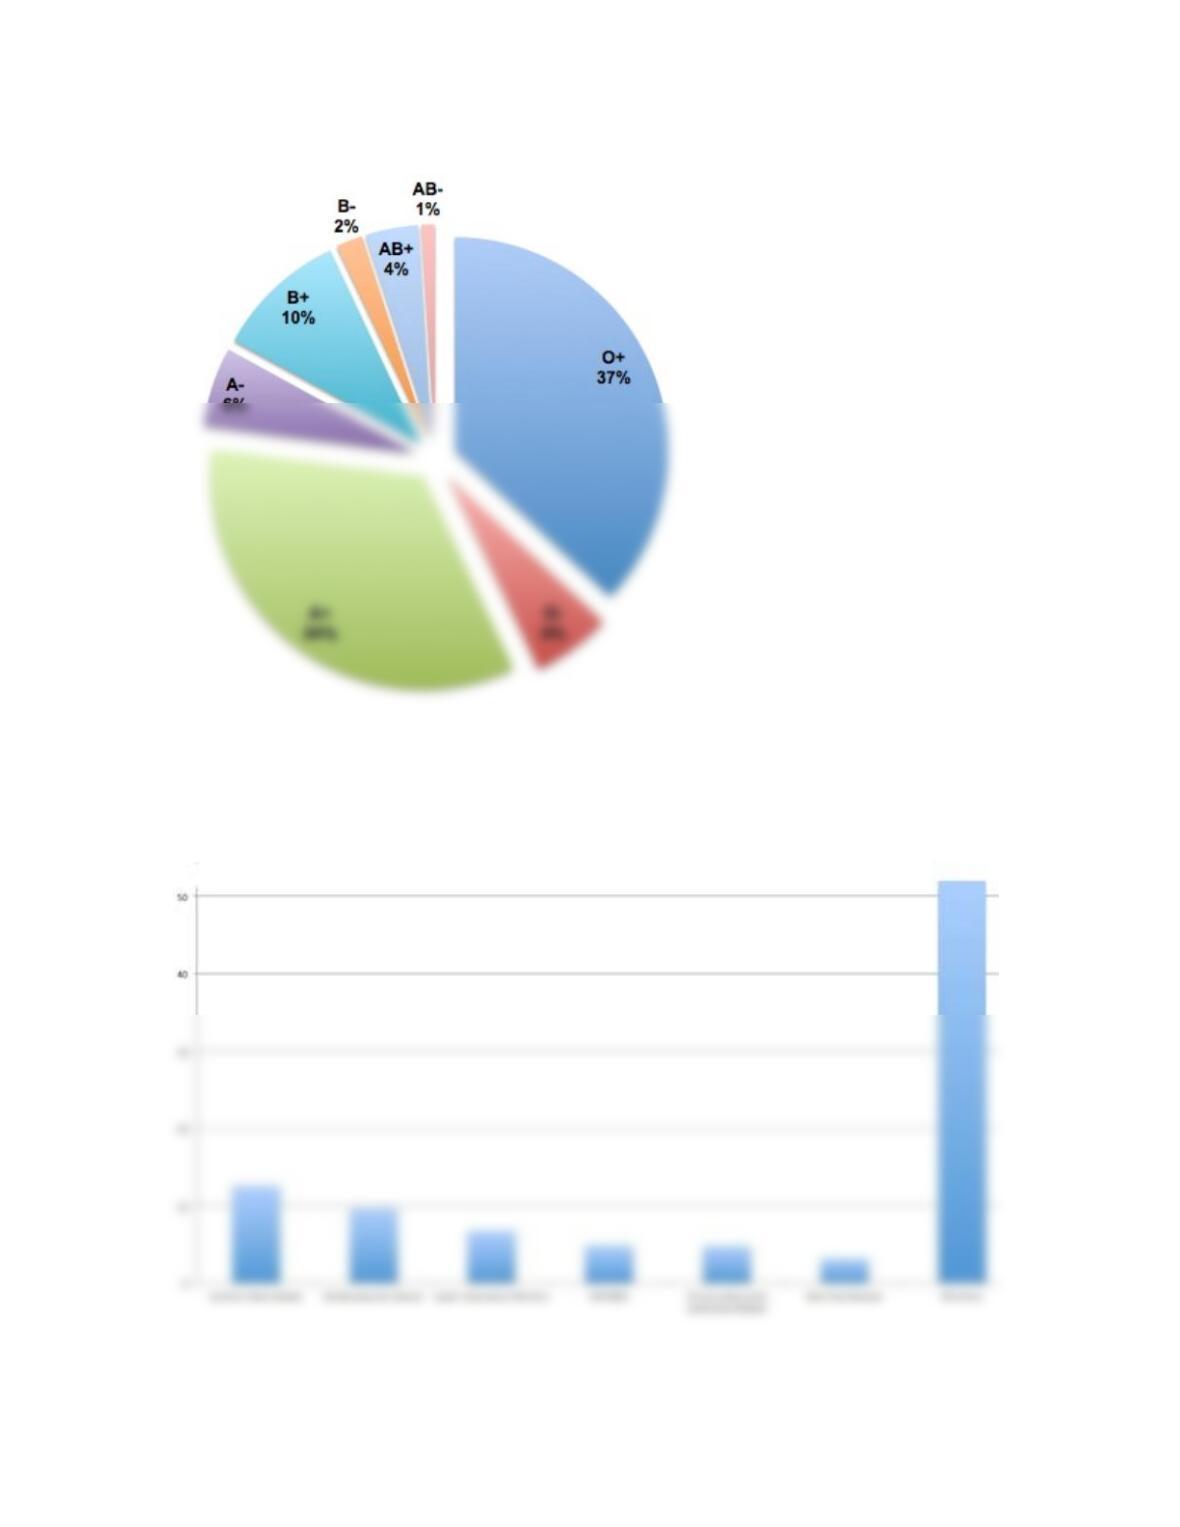
Example chart:
xample chart:
Exercise 6.8
E
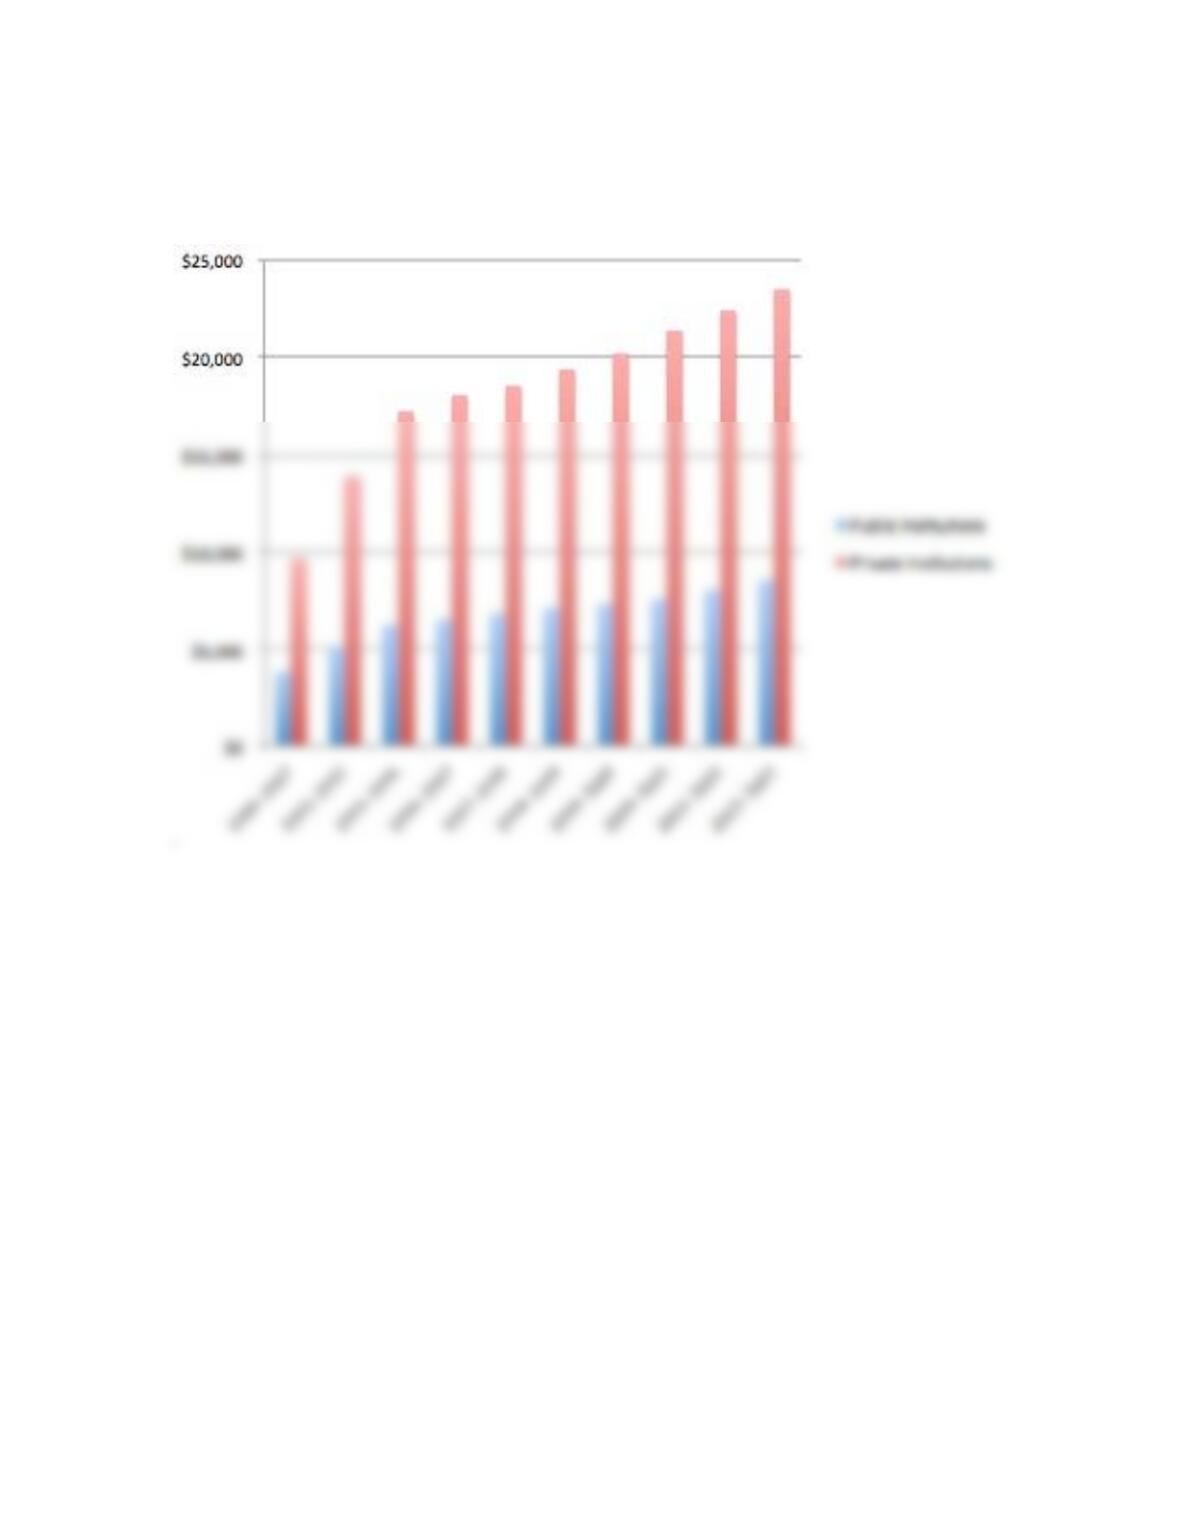
Exercise 6.9
Example chart:
xample chart:
Exercise 6.11
E
Question bank
The framing of a photograph should be governed by
In covering an event with a camera, a good piece of advice is to
An absolutely necessary piece of equipment for the photojournalist is
One of the great values of photojournalism is

Photojournalists should think about an event and where the best places would be to get pictures
before they are at the event.
Photojournalists should spend most of their time getting good establishing shots because these
are usually the most interesting.
Which of the following is most likely to generate interest in a photo; that is, to get viewers to look
at the photo?
One of the first great photojournalists, a man who is responsible for many of the images we have
of the Civil War, was
In writing a cutline for a photograph, you should generally use
People recognizable in a photograph should be fully identified in a cutline.
Accuracy is less important in a photo’s cutline than in other journalistic writing because the
photograph shows what’s going on anyway.
With a set of photos on a website, what becomes important about their presentation?

The process of cutting away certain parts of a picture to enhance or emphasize other parts is
called
Another word for “average” is
Miles per gallon is an example of a/an
A line chart should be used solely to present
In a chart, the text below a headline that gives information about the information in the chart is
called a/an
In a pie chart, the data should always be presented as
An average gives a general picture of a set of numbers, but sometimes that picture can be
skewed. In those cases you may want to find the
A set of percentages, if they represent the complete item or entity that is being divided, should
add up to
A pie chart is good only for showing
To figure the percent of change between A and B, you would