Business Statistics: Part II: Modeling with Probability – Test A
Name___________________________________________________
Chapter 6: Determine and/or use an appropriate probability model.
1. A survey of investors finds that 60% use a full service brokerage firm to invest in
stocks, 30% trade stocks online and 24% do both. The probability that an investor
selected at random uses a full service brokerage firm or trades stocks online is
A. 90%
B. 66%
C. 34%
D. 54%
E. 60%
Chapter 6: Determine and/or use an appropriate probability model.
2. An advocacy group is investigating whether gender has an effect on job category in
large investment firms. She surveyed a sample of firms with the following results:
Job Category Male Female
Clerical / Technical 85 215
Professional Staff 720 480
Executive / Managerial 400 100
What is the probability that a randomly selected employee’s job category is executive /
managerial given that she is female?
A. 0.13
B. 0.20
C. 0.80
D. 0.05
E. 0.45
Chapter 6: Determine and/or use an appropriate probability model.
3. An advocacy group is investigating whether gender has an effect on job category in
large investment firms. Given the results shown in the table below, which of the
following statements is true about gender and job category?
Job Category Male Female
Clerical / Technical 85 215
Professional Staff 720 480
Executive / Managerial 400 100
A. Gender and job category are independent.
B. Gender and job category are not independent.
C. Gender and job category are mutually exclusive.
D. Gender and job category are independent and mutually exclusive.
E. There is not sufficient information to determine whether gender and job category
are independent or mutually exclusive.

IIA-2 Part II: Modeling with Probability
Chapter 6: Determine and/or use an appropriate probability model.
4. The number of claims for lost luggage in a small city airport averages nine per day.
Assuming the Poisson distribution, what is the probability that there will be fewer than 3
claims on any given day?
A. 0.0150
B. 0.0212
C. 0.0062
D. 0.0337
E. 0.5000
Chapter 6: Determine and/or use an appropriate probability model.
5. In a particular production process, drying times for newly pained parts are uniformly
distributed between 2 and 8 minutes. The probability that a part dries in less than 6
minutes is
A. 2/6
B. 2/8
C. 3/6
D. 4/6
E. 4/8
Chapter 6: Find the expected value and standard deviation of a random variable.
6. A men’s clothing store has determined the following probability distribution for the
number of special size orders placed per month. Based on this distribution, the standard
deviation in the number of special size orders placed per month is
Number Ordered Probability
0 .10
5 .10
10 .12
15 .30
20 .38
A. 43.56
B. 6.6
C. 15.345
D. 4.9
E. 3.88

Test A IIA-3
Chapter 9: Describe a sampling distribution model.
7. Insurance company records indicate that 10% of its policyholders file claims involving
theft or robbery of personal property from their homes. Suppose a random sample of 400
policyholders is selected. The standard deviation of the sampling distribution of the
sample proportion of policyholders filing claims involving theft or robbery from their
homes is
A. 0.000225
B. 0.25
C. 0.0455
D. 0.1667
E. 0.015
Chapter 8: Determine and analyze sampling methods; identify and understand biases.
8. A researcher is conducting a study on eating disorders. Using a list of recent
participants in the online Weight Watchers program, she randomly selects a name from
the alphabetized list. She then chooses every tenth person from that point on to include
in her study. This sampling strategy is called
A. Systematic
B. Cluster
C. Random
D. Stratified
E. Judgmental
Chapter 8: Determine and analyze sampling methods; identify and understand biases.
9. A researcher is conducting a study on eating disorders. Using a list of recent
participants in the online Weight Watchers program, she randomly selects a sample from
the alphabetized list. This list represents the
A. Sample
B. Parameter
C. Population
D. Sampling frame
E. Statistic
Chapter 8: Determine and analyze sampling methods; identify and understand biases.
10. A researcher is conducting a study to determine how knowledgeable teenagers are
about making good food choices. She decides to interview teenagers eating at a fast food
restaurant. The results may be biased because this is a
A. simple random sample.
B. voluntary response sample.
C. convenience sample.
D. stratified sample.
E. census.

IIA-4 Part II: Modeling with Probability
Chapter 9: Find and interpret margins of error.
11. We have calculated a 95% confidence interval and would like our next confidence
interval to have a smaller margin of error without losing any confidence. In order to do
this, we can
I. change the z∗ value to a smaller number.
II. take a larger sample.
III. take a smaller sample.
A. I only
B. II only
C. III only
D. I and II
E. I and III
Chapter 9: Find and interpret confidence intervals.
12. In economic downturns, companies attempt to downsize their workforces by offering
early retirement incentives to older employees. A survey of 723 companies found that
195 engage in such downsizing practices. The 99% confidence interval for the
proportion of companies that downsize their workforces by offering early retirement
incentives is
A. 0.19 to 0.35
B. 0.65 to 0.81
C. 0.19 to 0.47
D. 0.69 to 0.77
E. 0.23 to 0.31
Chapter 9: Describe a sampling distribution model.
13. Suppose the time it takes for a purchasing agent to complete an online ordering
process is normally distributed with a mean of 8 minutes and a standard deviation of 2
minutes. Suppose a random sample of 25 ordering processes is selected. The standard
deviation of the sampling distribution of mean times is
A. 0.4 minutes
B. 2 minutes
C. 0.08 minutes
D. 1.6 minutes
E. 0.12 minutes

Test A IIA-5
Chapter 7: Use z‐scores to find probabilities, percentages, and values.
14. Suppose the time it takes for a purchasing agent to complete an online ordering
process is normally distributed with a mean of 8 minutes and a standard deviation of 2
minutes. Suppose a random sample of 25 ordering processes is selected. What is the
probability that the sample mean will be less than 7.5 minutes?
A. 0.3944
B. 0.1056
C. 0.2114
D. 0.4013
E. 0.8944
Chapter 7: Use the 68‐95‐99.7 Rule to find probabilities and intervals of values.
15. Assume that a set of test scores in an Introduction to Finance class is normally
distributed with a mean of 72 and a standard deviation of 8. Use the 68-95-99.7 rule to
find the percentage of scores less than 56.
A. 0.15%
B. 0.3%
C. 2.5%
D. 5%
E. 95%
Chapter 7: Use the 68‐95‐99.7 Rule to find probabilities and intervals of values.
16. Assume that a set of test scores in an Introduction to Finance class is normally
distributed with a mean of 72 and a standard deviation of 8. Use the 68-95-99.7 rule to
find the percentage of scores between 64 and 88.
A. 95%
B. 68%
C. 99.7%
D. 81.5%
E. 49.85%
IIA-6 Part II: Modeling with Probability
Chapter 7: Assess Normality.
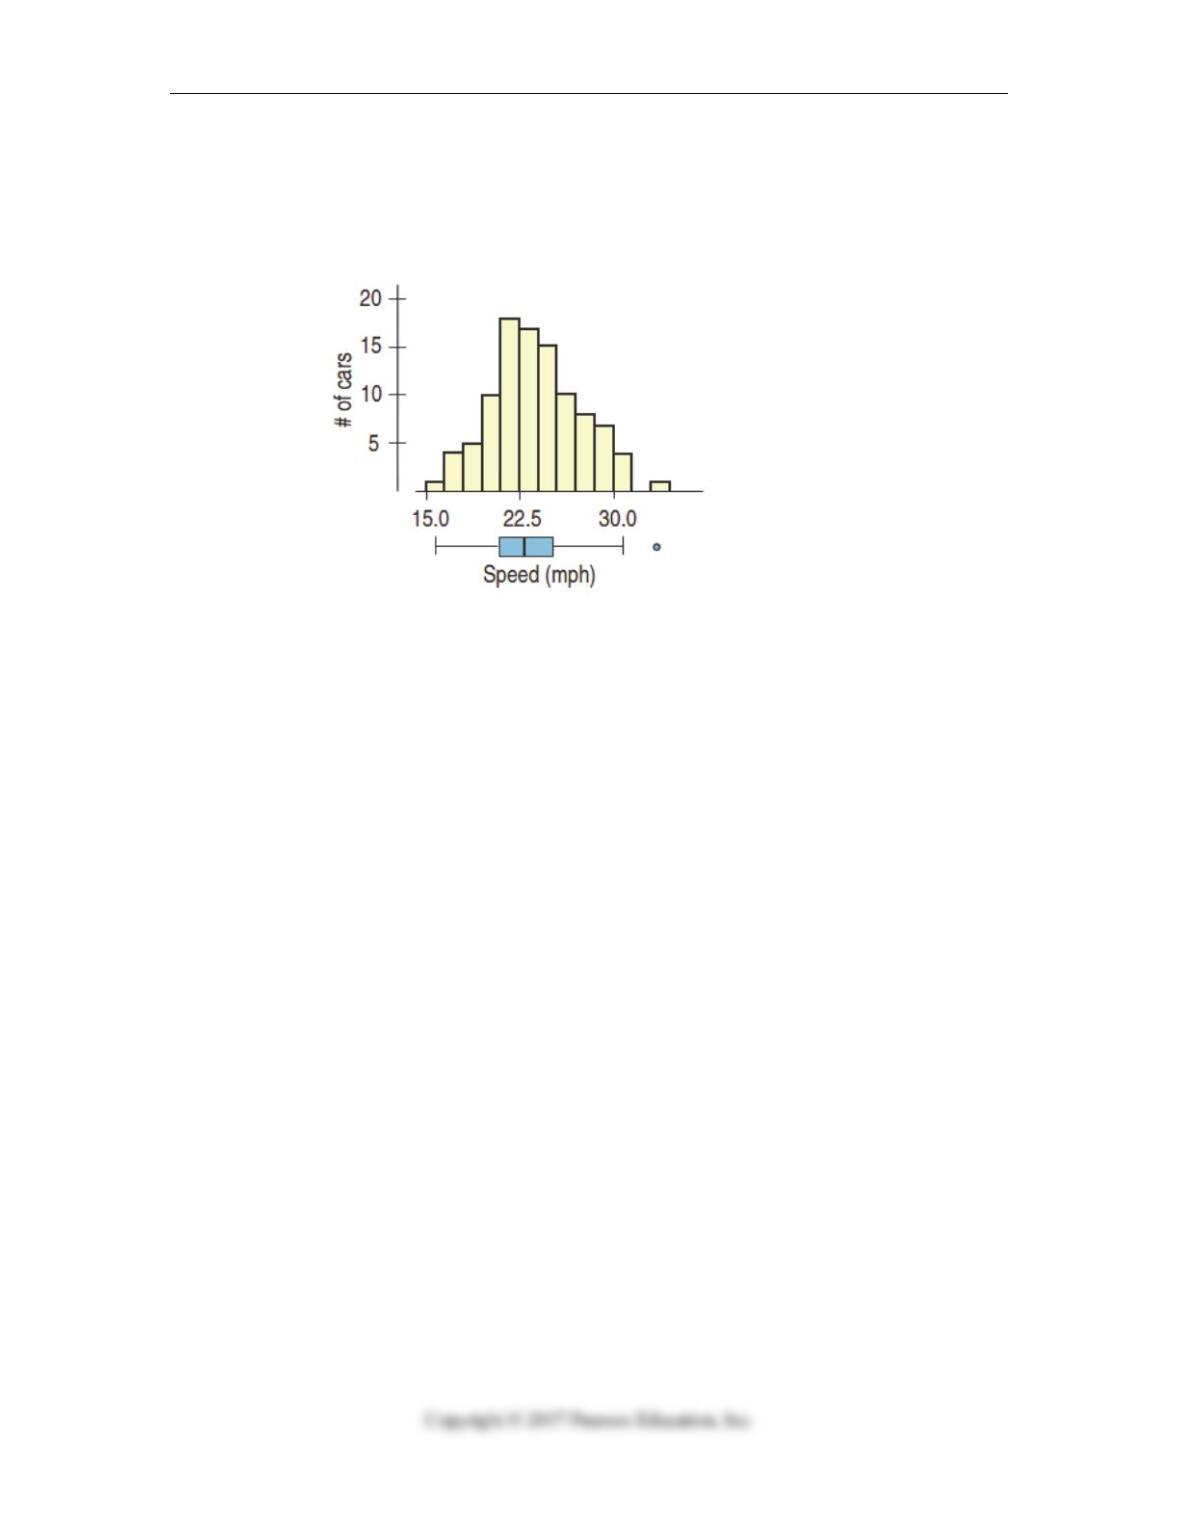
17. Speeds of cars were measured as they passed one point on a road to study whether
traffic speed controls were needed. Here’s a histogram and boxplot of the measured
speeds. Accurate statements about this distribution include.
A. The distribution is fairly symmetric.
B. The distribution is right skewed with a large outlier.
C. A normal probability plot would add information about the normality of the data
set.
D. Both A and C
E. Both B and C
Test A IIA-7
Chapter 7: Assess Normality.
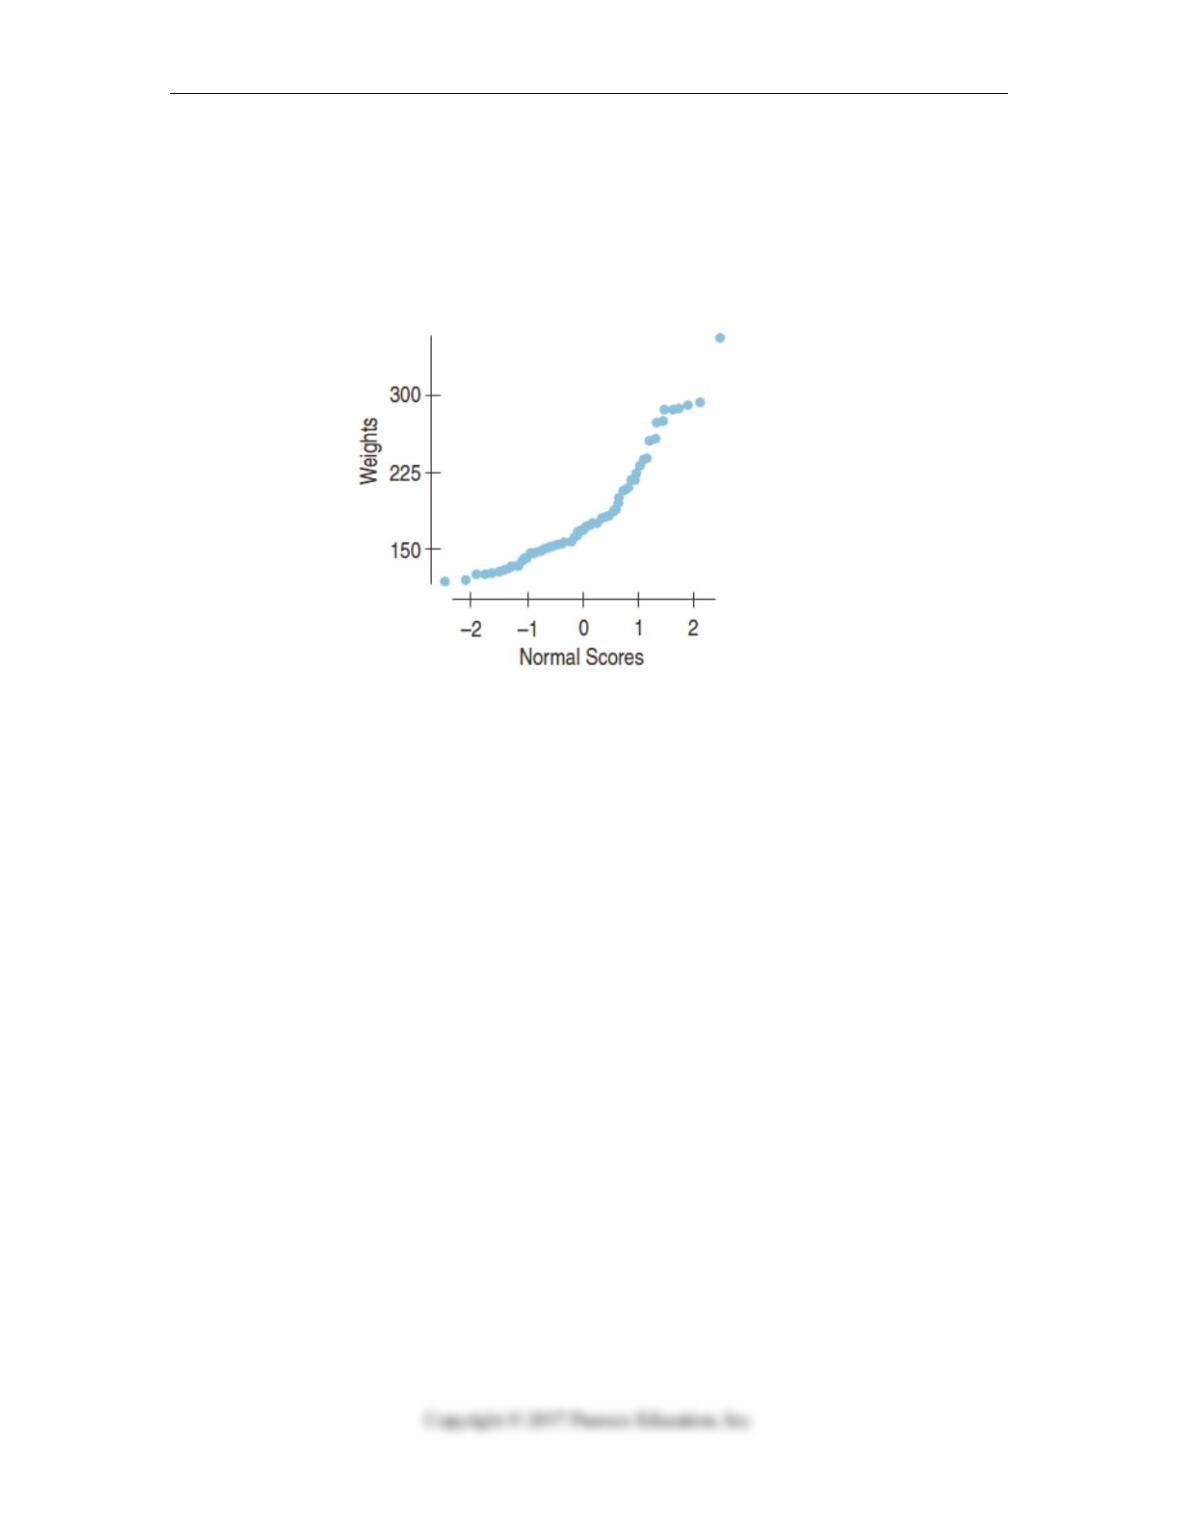
18. A Normal probability plot of the weights of individuals signed up for a popular diet
program is shown below. The best description of the plot is
A. The distribution is fairly symmetric.
B. The distribution is right skewed and nonlinear.
C. The distribution is left skewed and nonlinear.
D. Using a Normal model for analysis is OK.
E. None of the above, cannot be determined from the plot.
Chapter 7: Assess Normality.
19. A Normal model states that if we draw repeated random samples of the same size, n,
from some population and measure sample proportions, then the collection of these
proportions will pile up around the underlying population proportion, p. The requirement
for this to work is
A. np and nq must be at least equal to 10.
B. As n increases, a distribution of sample proportions becomes more Normal.
C. np and nq must be less than 10.
D. Both B and C.
E. Both A and B.

IIA-8 Part II: Modeling with Probability
Chapter 9: Find sample sizes.
20. In a recent poll of 200 households, it was found that 152 had at least one computer
and one television. A 95% confidence interval to estimate the population proportion was
calculated to be 0.701 to 0.819. What sample size would be needed to change the margin
of error to 0.030?
A. 1068
B. 779
C. 534
D. 390
E. Cannot be determined
Test A IIA-9
Business Statistics: Part II: Understanding Data and Distributions – Test A – Key