Application: The Costs of Taxation 2051
115.
Refer to Figure 8-4. The tax results in a loss of consumer surplus that amounts to
a. $105.
b. $140.
c. $170.
d. $210.
116.
Refer to Figure 8-4. The tax results in a loss of producer surplus that amounts to
a. $75.50.
b. $90.00.
c. $112.50.
d. $127.50.
2052 Application: The Costs of Taxation
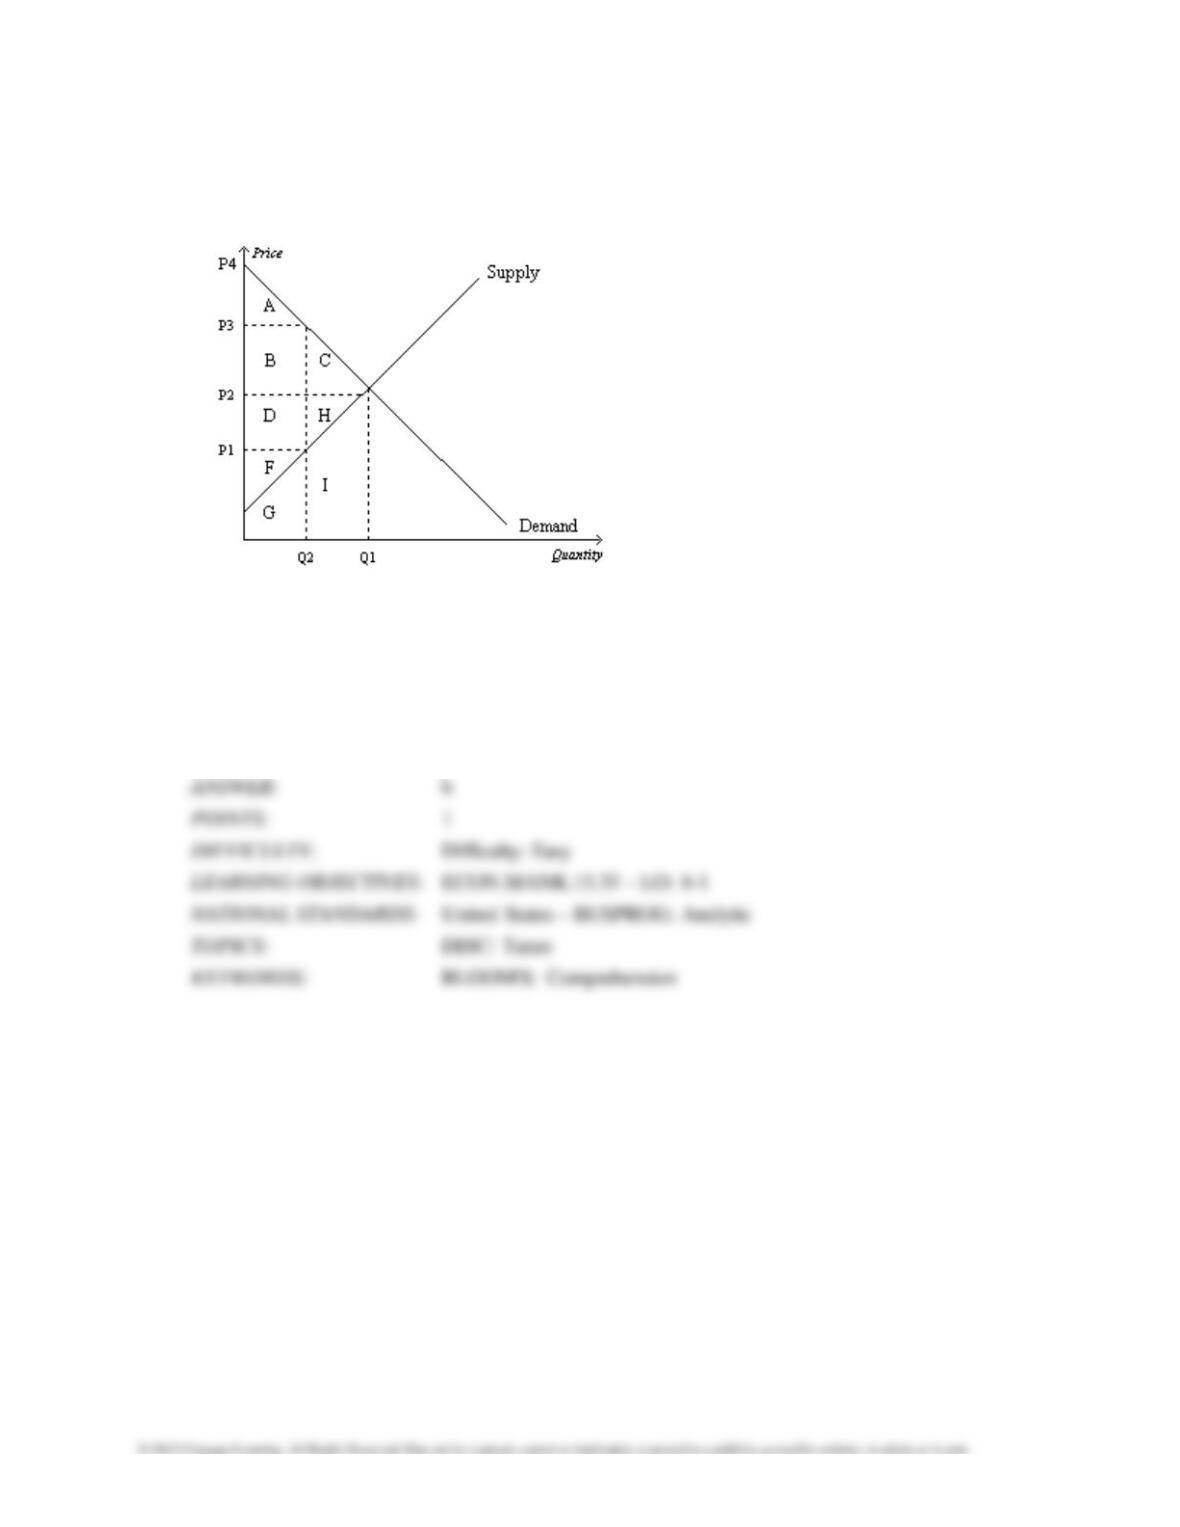
Figure 8-5
Suppose that the government imposes a tax of P3 – P1.
117.
Refer to Figure 8-5. The equilibrium price before the tax is imposed is
a.
P1.
b.
P2.
c.
P3.
d.
P4.
118.
Refer to Figure 8-5. The price that buyers effectively pay after the tax is imposed is
a.
P1.
b.
P2.
c.
P3.
d.
P4.
119.
Refer to Figure 8-5. The price that sellers effectively receive after the tax is imposed is
a.
P1.
b.
P2.
c.
P3.
d.
P4.
120.
Refer to Figure 8-5. The tax is levied on
a.
buyers only.
b.
sellers only.
c.
both buyers and sellers.
d.
This is impossible to determine from the figure.
121.
Refer to Figure 8-5. Consumer surplus before the tax was levied is represented by area
a.
A.
b.
A+B+C.
c.
D+H+F.
d.
F.
122.
Refer to Figure 8-5. Producer surplus before the tax was levied is represented by area
a.
A.
b.
A+B+C.
c.
D+H+F.
d.
F.
123.
Refer to Figure 8-5. After the tax is levied, consumer surplus is represented by area
a.
A.
b.
A+B+C.
c.
D+H+F.
d.
F.
124.
Refer to Figure 8-5. After the tax is levied, producer surplus is represented by area
a.
A.
b.
A+B+C.
c.
D+H+F.
d.
F.
125.
Refer to Figure 8-5. The tax causes a reduction in consumer surplus that is represented by
area
a.
A.
b.
B+C.
c.
C+H.
d.
F.
126.
Refer to Figure 8-5. The tax causes a reduction in producer surplus that is represented by area
a.
A.
b.
C+H.
c.
D+H.
d.
F.
127.
Refer to Figure 8-5. The benefit to the government is measured by
a.
tax revenue and is represented by area A+B.
b.
tax revenue and is represented by area B+D.
c.
the net gain in total surplus and is represented by area B+D.
d.
the net gain in total surplus and is represented by area C+H.
128.
Refer to Figure 8-5. The total surplus with the tax is represented by area
a.
C+H.
b.
A+B+C.
c.
D+H+F.
d.
A+B+D+F.
129.
Refer to Figure 8-5. The loss in total welfare that results from the tax is represented by area
a.
A+B+D+F.
b.
A+B+C.
c.
D+H+F.
d.
C+H.
Application: The Costs of Taxation 2057
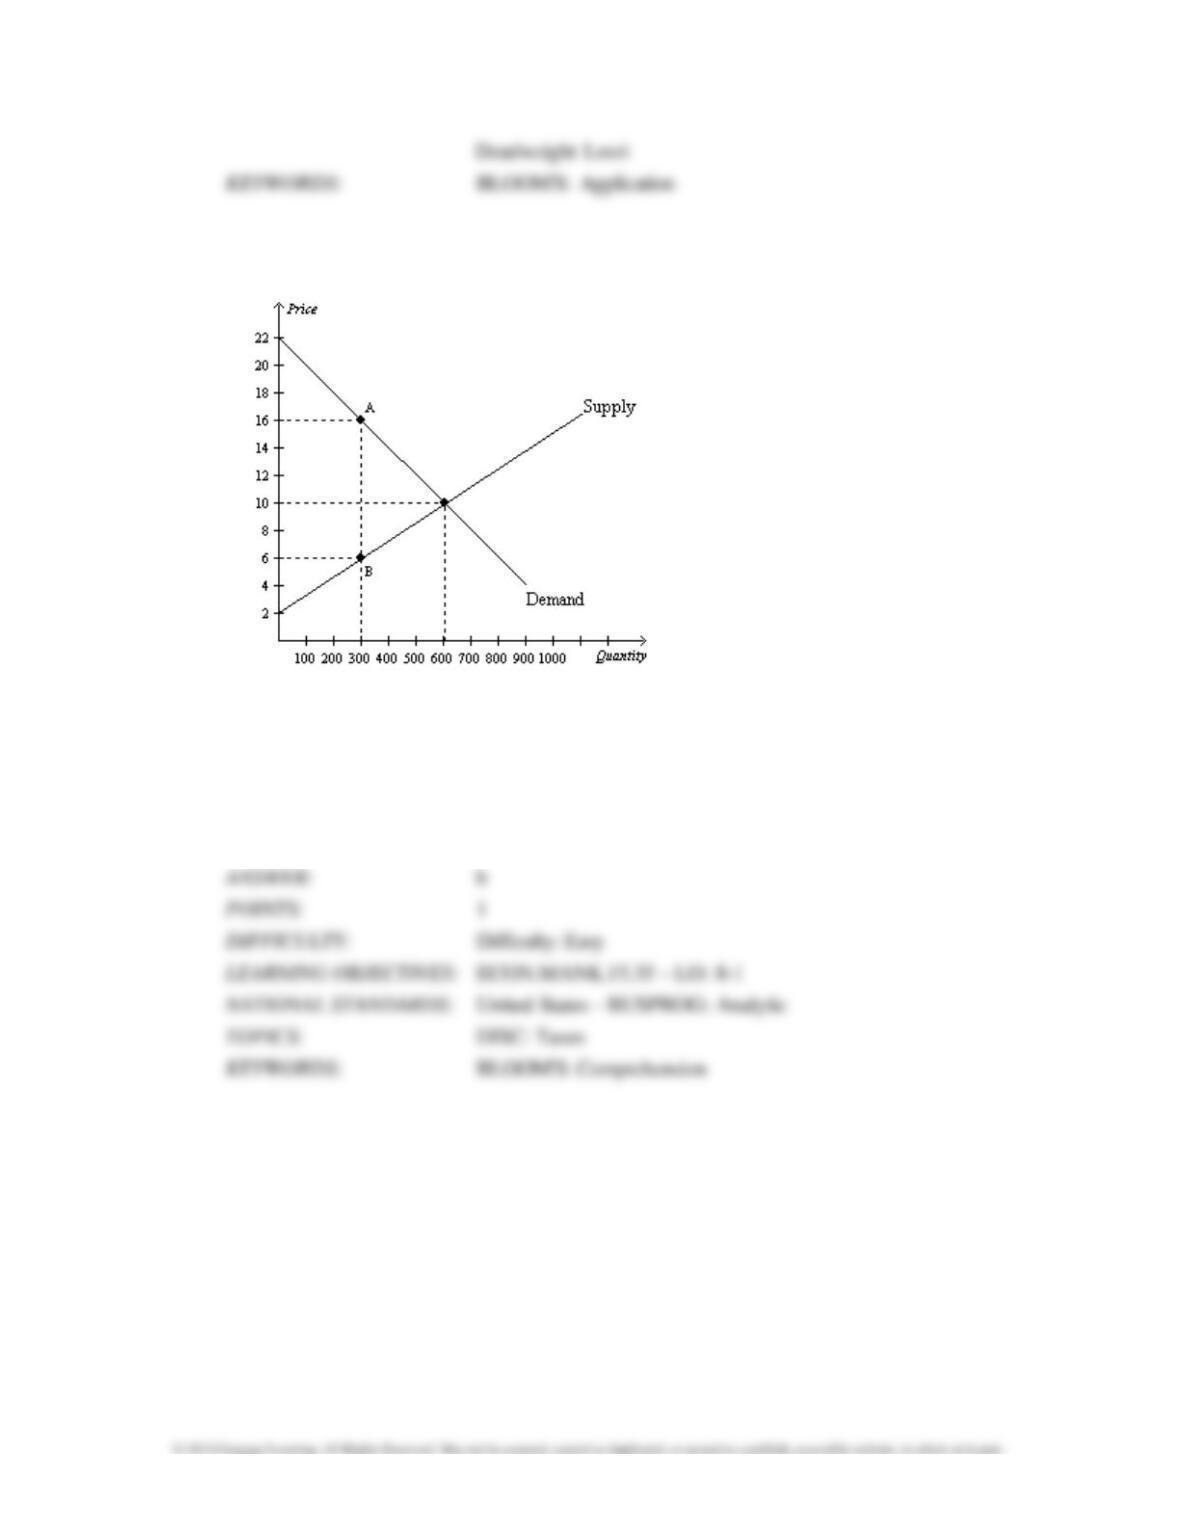
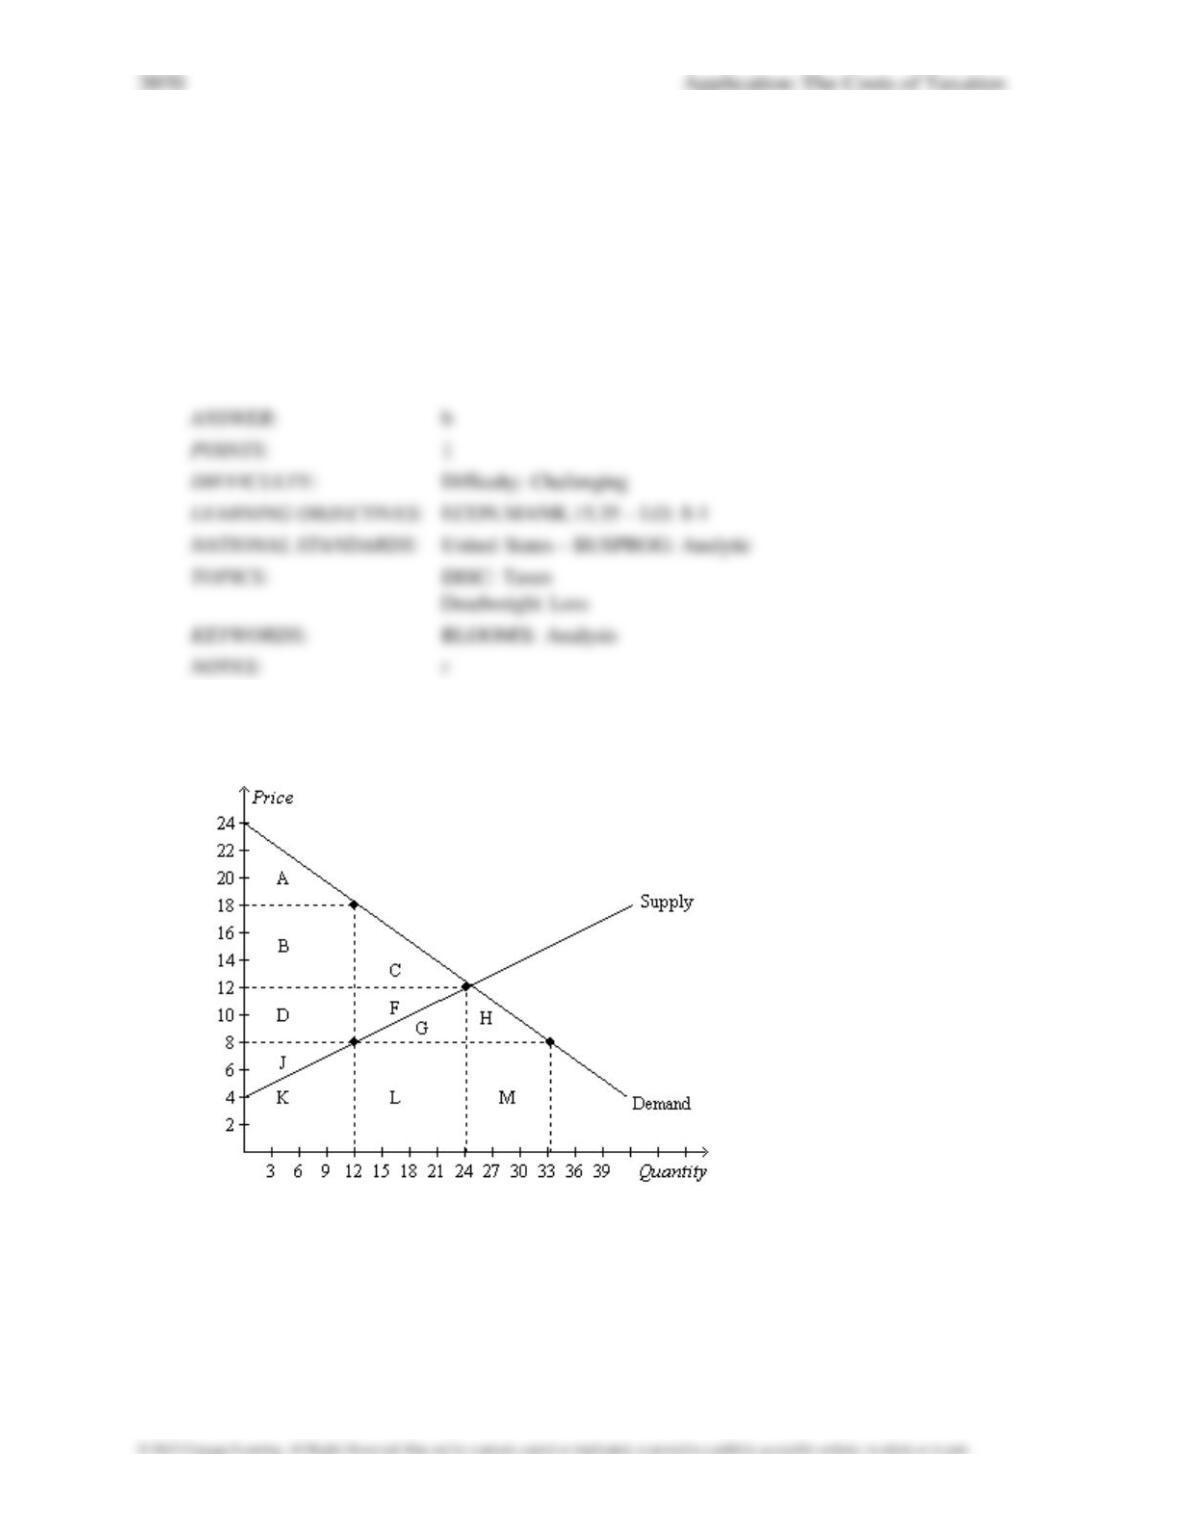
Figure 8-6
The vertical distance between points A and B represents a tax in the market.
130.
Refer to Figure 8-6. Without a tax, the equilibrium price and quantity are
a. $16 and 300.
b. $10 and 600.
c. $10 and 300.
d. $6 and 300.
131.
Refer to Figure 8-6. Without a tax, consumer surplus in this market is
a. $1,500.
b. $2,400.
c. $3,000.
d. $3,600.
132.
Refer to Figure 8-6. Without a tax, producer surplus in this market is
a. $1,500.
b. $2,400.
c. $3,000.
d. $3,600.
133.
Refer to Figure 8-6. Without a tax, total surplus in this market is
a. $3,000.
b. $4,800.
c. $6,000.
d. $7,200.
134.
Refer to Figure 8-6. When the tax is imposed in this market, the price buyers effectively pay is
a. $4.
b.
$6.
c.
$10.
d.
$16.
135.
Refer to Figure 8-6. When the tax is imposed in this market, buyers effectively pay what
amount of the $10 tax?
a.
$0
b.
$4
c.
$6
d.
$10
136.
Refer to Figure 8-6. When the tax is imposed in this market, sellers effectively pay what
amount of the $10 tax?
a.
$0
b.
$4
c.
$6
d.
$10
137.
Refer to Figure 8-6. When the tax is imposed in this market, the price sellers effectively
receive is
a. $4.
b.
$6.
c.
$10.
d.
$16.
138.
Refer to Figure 8-6. When the tax is imposed in this market, consumer surplus is
a. $600.
b. $900.
c. $1,500.
d. $3,000.
139.
Refer to Figure 8-6. When the tax is imposed in this market, producer surplus is
a. $450.
b. $600.
c. $900.
d. $1,500.
140.
Refer to Figure 8-6. When the tax is placed on this good, the quantity sold
a.
is 600, and buyers effectively pay $10.
b.
is 300, and buyers effectively pay $10.
c.
is 600, and buyers effectively pay $16.
d.
is 300, and buyers effectively pay $16.
141.
Refer to Figure 8-6. When the government imposes the tax in this market, tax revenue is
a. $600.
2062 Application: The Costs of Taxation
b. $900.
c. $1,500.
d. $3,000.
142.
Refer to Figure 8-6. The amount of the tax on each unit of the good is
a. $6.
b.
$8.
c.
$10.
d.
$12.
143.
Refer to Figure 8-6. Total surplus with the tax in place is
a. $1,500.
b. $3,600.
c. $4,500.
d. $6,000.
144.
Refer to Figure 8-6. What happens to consumer surplus when the tax is imposed in this
market?
a.
Consumer surplus falls by $3,600.
b.
Consumer surplus falls by $2,700.
c.
Consumer surplus falls by $1,800.
d.
Consumer surplus falls by $900.
145.
Refer to Figure 8-6. What happens to producer surplus when the tax is imposed in this
market?
a.
Producer surplus falls by $600.
b.
Producer surplus falls by $900.
c.
Producer surplus falls by $1,800.
d.
Producer surplus falls by $2,100.
146.
Refer to Figure 8-6. What happens to total surplus in this market when the tax is imposed?
a.
Total surplus increases by $1,500.
b.
Total surplus increases by $3,000.
c.
Total surplus decreases by $1,500.
d.
Total surplus decreases by $,3000.
147.
Refer to Figure 8-6. The tax results in a deadweight loss that amounts to
a. $600.
b. $900.
c. $1,500.
d. $1,800.
Application: The Costs of Taxation 2065
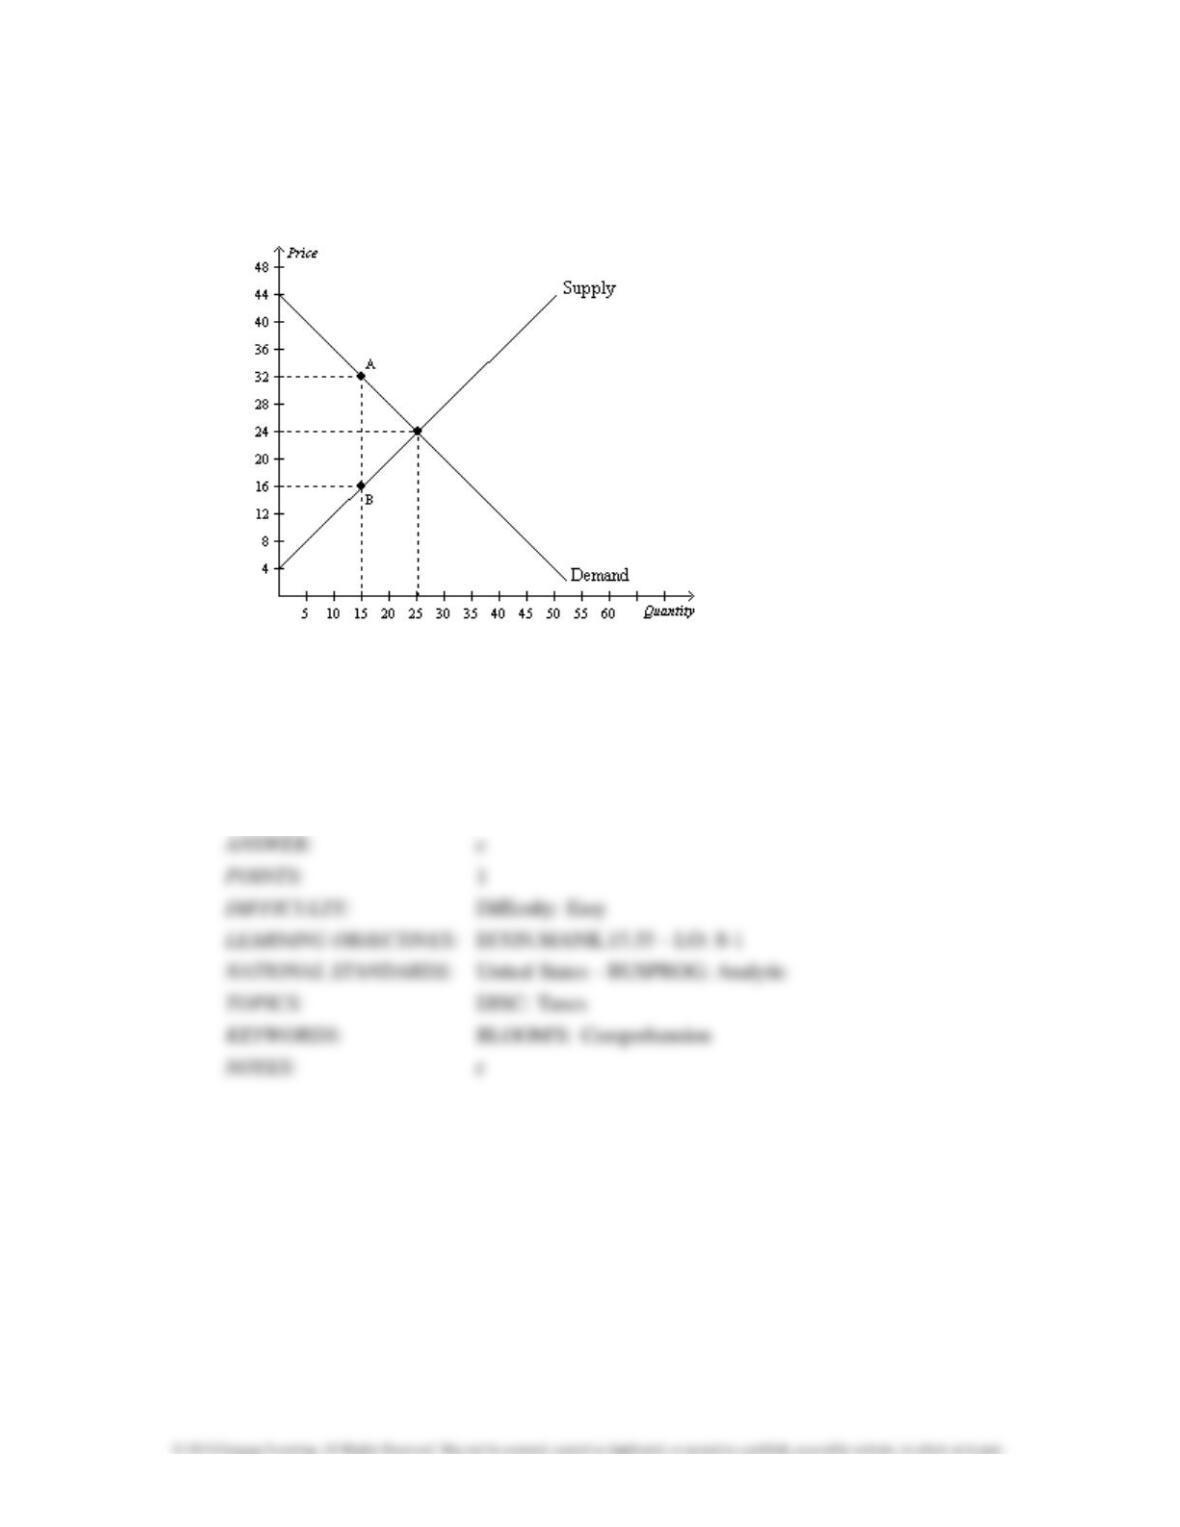
Figure 8-7
The vertical distance between points A and B represents a tax in the market.
148.
Refer to Figure 8-7. Before the tax is imposed, the equilibrium price is
a.
$32, and the equilibrium quantity is 15.
b.
$24, and the equilibrium quantity is 15.
c.
$24, and the equilibrium quantity is 25.
d.
$16, and the equilibrium quantity is 15.
149.
Refer to Figure 8-7. As a result of the tax, buyers effectively pay
a.
$32 for each unit of the good, and sellers effectively receive $24 for each unit of the good.
b.
$32 for each unit of the good, and sellers effectively receive $16 for each unit of the good.
c.
$24 for each unit of the good, and sellers effectively receive $16 for each unit of the good.
d.
$28 for each unit of the good, and sellers effectively receive $20 for each unit of the good.
150.
Refer to Figure 8-7. Suppose a 20th unit of the good were sold by a seller to a buyer. Which
of the following
statements is correct?
a.
For the 20th unit, the difference between the buyer’s value and the seller’s cost is less than
the tax per unit.
b.
For the 20th unit, the difference between the buyer’s value and the seller’s cost is greater
than the tax per unit.
c.
For the 20th unit, the difference between the buyer’s value and the seller’s cost is equal to the
tax per unit.
d.
It makes sense for the buyer to buy and for the seller to sell the 20th unit, with or without the
tax in place.
151.
Refer to Figure 8-7. Which of the following statements summarizes the incidence of the tax?
a.
For each unit of the good that is sold, buyers bear one-half of the tax burden, and sellers bear
one-half of the
tax burden.
b.
For each unit of the good that is sold, buyers bear one-third of the tax burden, and sellers bear
two-thirds of
the tax burden.
c.
For each unit of the good that is sold, buyers bear one-fourth of the tax burden, and sellers
bear three-fourths
of the tax burden.
d.
For each unit of the good that is sold, buyers bear three-fourths of the tax burden, and sellers
bear one-fourth
of the tax burden.
152.
Refer to Figure 8-7. Which of the following statements is correct?
a.
Total surplus before the tax is imposed is $500.
b.
After the tax is imposed, consumer surplus is 45 percent of its pre-tax value.
c.
After the tax is imposed, producer surplus is 45 percent of its pre-tax value.
d.
All of the above are correct.
153.
Refer to Figure 8-7. Which of the following statements is correct?
a.
Total surplus before the tax is imposed is $180.
b.
After the tax is imposed, consumer surplus is 25 percent of its pre-tax value.
c.
After the tax is imposed, producer surplus is 36 percent of its pre-tax value.
d.
All of the above are correct.
154.
Refer to Figure 8-7. As a result of the tax,
a.
consumer surplus decreases from $200 to $80.
b.
producer surplus decreases from $200 to $145.
c.
the market experiences a deadweight loss of $80.
d.
All of the above are correct.
155.
Refer to Figure 8-7. As a result of the tax, consumer surplus decreases by
a.
$130, producer surplus decreases by $170, tax revenue is $240, and deadweight loss is $60.
b.
$150, producer surplus decreases by $150, tax revenue is $240, and deadweight loss is $60.
c.
$160, producer surplus decreases by $160, tax revenue is $240, and deadweight loss is $80.
d.
$240, producer surplus decreases by $240, tax revenue is $400, and deadweight loss is $80.
156.
Refer to Figure 8-7. Which of the following statements is correct?
a.
The loss of producer surplus that is associated with some sellers dropping out of the market
as a result of the
tax is $60.
b.
The loss of consumer surplus for those buyers of the good who continue to buy it after the tax
is imposed is $120.
c.
The loss of consumer surplus caused by this tax exceeds the loss of producer surplus caused
by this tax.
d.
This tax produces $320 in tax revenue for the government.
157.
Refer to Figure 8-7. The deadweight loss associated with this tax amounts to
a.
$80, and this figure represents the amount by which tax revenue to the government exceeds
the combined
loss of producer and consumer surpluses.
b.
$80, and this figure represents the surplus that is lost because the tax discourages mutually
advantageous
trades between buyers and sellers.
c.
$60, and this figure represents the amount by which tax revenue to the government exceeds
the combined
loss of producer and consumer surpluses.
d.
$60, and this figure represents the surplus that is lost because the tax discourages mutually
advantageous
trades between buyers and sellers.
Figure 8-8
Suppose the government imposes a $10 per unit tax on a good.