Application: The Costs of Taxation 2171
35. The Laffer curve relates
a. the tax rate to tax revenue raised by the tax.
b. the tax rate to the deadweight loss of the tax.
c. the price elasticity of supply to the deadweight loss of the tax.
d. government welfare payments to the birth rate.
36. Ronald Reagan believed that reducing income tax rates would
a. do little, if anything, to encourage hard work.
b. result in large increases in deadweight losses.
c. raise economic well-being and perhaps even tax revenue.
d. lower economic well-being, even though tax revenue could possibly increase.
2172 Application: The Costs of Taxation
37. The view held by Arthur Laffer and Ronald Reagan that cuts in tax rates would encourage
people to increase the quantity of labor they supplied became known as
a. California economics.
b. welfare economics.
c. supply-side economics.
d. elasticity economics.
38. Which of the following scenarios is consistent with the Laffer curve?
a. The tax rate is 1 percent, and tax revenue is very low.
b. The tax rate is 1 percent, and tax revenue is very high.
c. The tax rate is 99 percent, and tax revenue is very high.
d. The tax rate is moderate (between very high and very low), and tax revenue is very low.
Application: The Costs of Taxation 2173
39. Which of the following scenarios is not consistent with the Laffer curve?
a. The tax rate is very low, and tax revenue is very low.
b. The tax rate is very high, and tax revenue is very low.
c. The tax rate is very high, and tax revenue is very high.
d. The tax rate is moderate (between very high and very low), and tax revenue is relatively high.
40. When a country is on the downward-sloping side of the Laffer curves, a cut in the tax rate will
a. decrease tax revenue and decrease the deadweight loss.
b. decrease tax revenue and increase the deadweight loss.
c. increase tax revenue and decrease the deadweight loss.
d. increase tax revenue and increase the deadweight loss.
2174 Application: The Costs of Taxation
41. In the early 1980s, which of the following countries had a marginal tax rate of about 80 percent?
a. United States
b. Canada
c. Japan
d. Sweden
42. Which of the following ideas is the most plausible?
a. Reducing a high tax rate is less likely to increase tax revenue than is reducing a low tax rate.
b. Reducing a high tax rate is more likely to increase tax revenue than is reducing a low tax rate.
c. Reducing a high tax rate will have the same effect on tax revenue as reducing a low tax rate.
d. Reducing a tax rate can never increase tax revenue.
Application: The Costs of Taxation 2175
43. Which of the following would likely have the smallest deadweight loss relative to the tax revenue?
a. a head tax (that is, a tax everyone must pay regardless of what one does or buys)
b. an income tax
c. a tax on compact discs
d. a tax on caviar
2176 Application: The Costs of Taxation
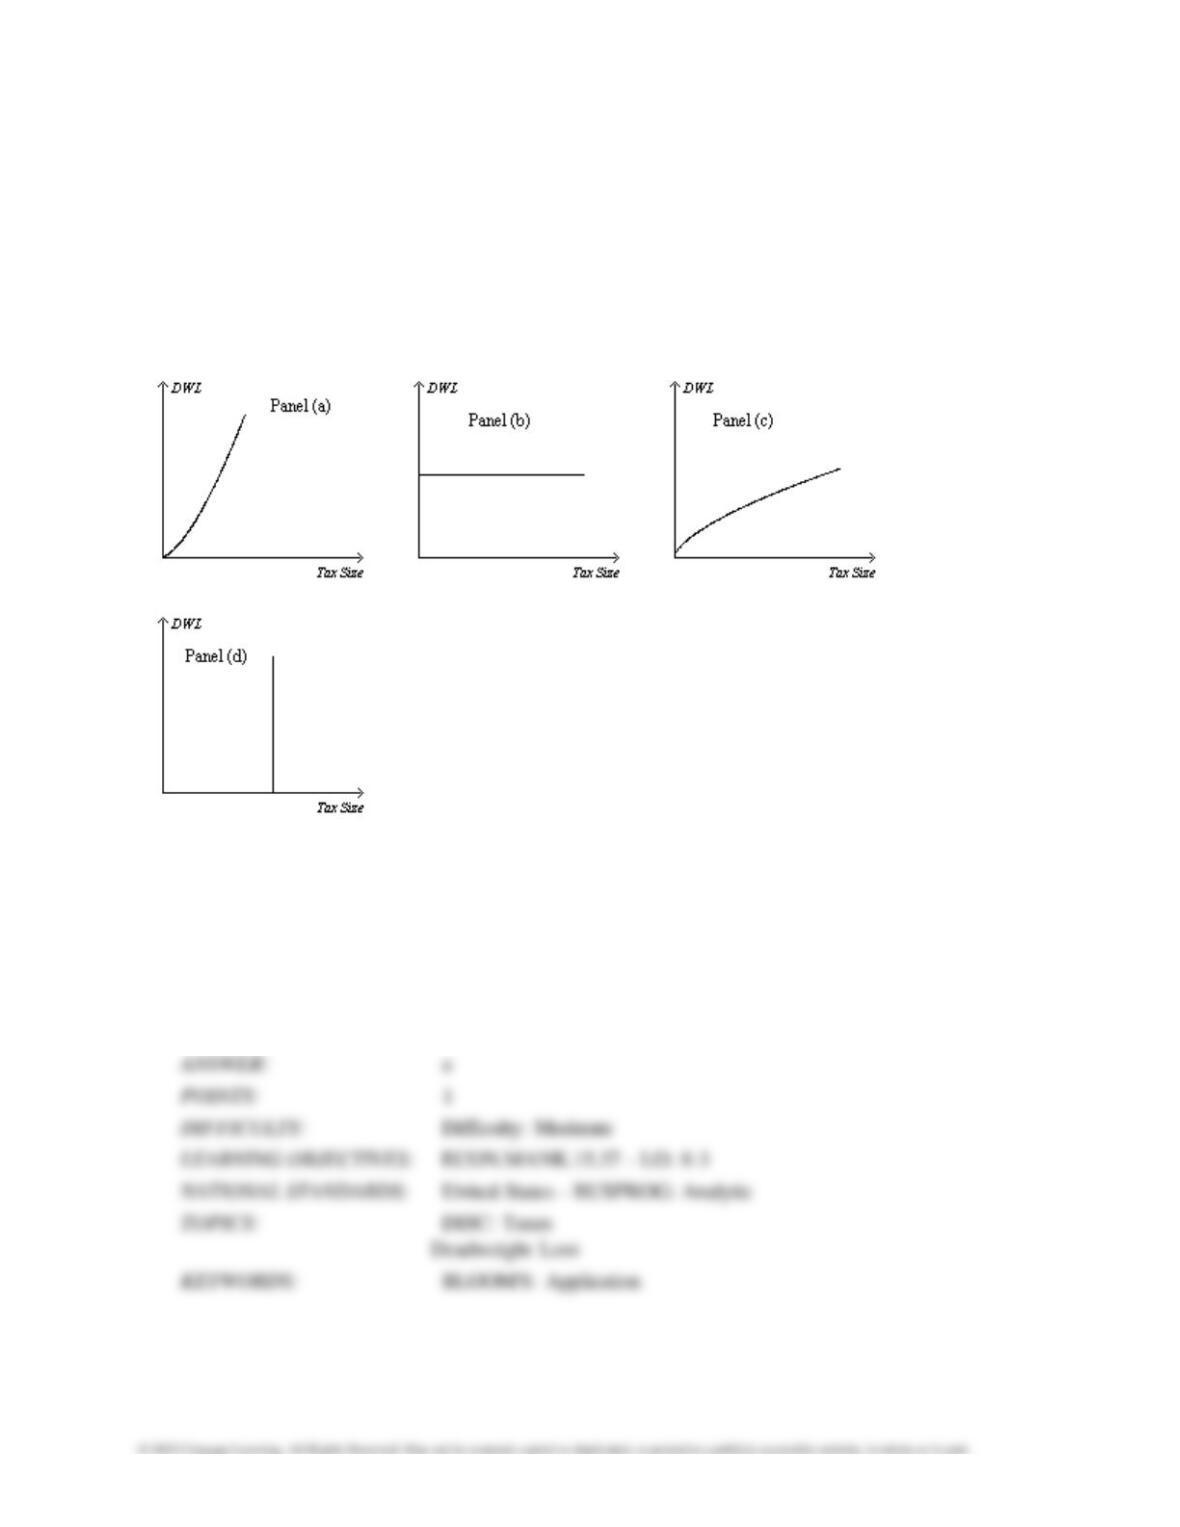
Figure 8-20
On the vertical axis of each graph, DWL is deadweight loss.
44. Refer to Figure 8-20. Which graph correctly illustrates the relationship between the size of a tax
and the size of the deadweight loss associated with the tax?
a. Panel (a)
b. Panel (b)
c. Panel (c)
d. Panel (d)
Application: The Costs of Taxation 2177
45. If the tax on gasoline increases from $2 to $4 per gallon, the deadweight loss from the tax
increases by a factor of
a. one–half.
b. two.
c. four.
d. six.
46. As the size of a tax rises, the deadweight loss
a. rises, and tax revenue first rises, then falls.
b. rises as does tax revenue.
c. falls, and tax revenue first rises, then falls.
d. falls as does tax revenue.
2178 Application: The Costs of Taxation
47. Suppose the federal government doubles the gasoline tax. The deadweight loss associated with
the tax
a. also doubles.
b. triples.
c. quadruples.
d. rises by a factor of 8.
48. The Laffer curve illustrates that
a. deadweight loss rises by the square of the increase in a tax.
b. deadweight loss rises exponentially as a tax increases.
c. tax revenue first rises, then falls as a tax increases.
d. Both a) and b) are correct.
Application: The Costs of Taxation 2179
49. Which of the following statements is correct?
a. A decrease in the size of a tax always decreases the tax revenue raised by that tax.
b. A decrease in the size of a tax always decreases the deadweight loss of that tax.
c. Tax revenue decreases when there is a small decrease in the tax rate and the economy is on
the downward- sloping part of the Laffer curve.
d. An increase in the size of a tax leads to an increase in the deadweight loss of the tax only if the
economy is on the upward-sloping part of the Laffer curve.
Figure 8-21
2180 Application: The Costs of Taxation
50. Refer to Figure 8-21. Suppose the government places a $3 per-unit tax on this good. The
largest deadweight loss from the tax would occur in a market where demand is represented by
a. Demand 1, and supply is represented by Supply 1.
b. Demand 1, and supply is represented by Supply 2.
c. Demand 2, and supply is represented by Supply 1.
d. Demand 2, and supply is represented by Supply 2.
51. Refer to Figure 8-21. Suppose the government places a $3 per-unit tax on this good. The
smallest deadweight loss from the tax would occur in a market where demand is represented by
a. Demand 1, and supply is represented by Supply 1.
b. Demand 1, and supply is represented by Supply 2.
c. Demand 2, and supply is represented by Supply 1.
d. Demand 2, and supply is represented by Supply 2.
Application: The Costs of Taxation 2181
52. Refer to Figure 8-21. Suppose the market is represented by Demand 1 and Supply 1. At first
the government places a $3 per-unit tax on this good. Then the government decides to raise the
tax to $6 per unit. Compared to the original tax rate, the higher tax will
a. increase tax revenue and increase the deadweight loss from the tax.
b. not change tax revenue and increase the deadweight loss from the tax.
c. decrease tax revenue and increase the deadweight loss from the tax.
d. decrease tax revenue and decrease the deadweight loss from the tax.
53. Refer to Figure 8-21. Suppose the market is represented by Demand 1 and Supply 1. At first
the government places a $3 per-unit tax on this good. Then the government decides to raise the
tax to $6 per unit. How would you characterize the decision to raise the tax rate from $3 to $6 per
unit? The decision is
a. a good one because it increases tax revenue while decreasing the deadweight loss from the
tax.
b. a bad one because it does not increase tax revenue yet increases the deadweight loss from the
tax.
c. a bad one because it decreases tax revenue while increasing the deadweight loss from the tax.
d. unclear because it increases tax revenue yet also increases the deadweight loss from the tax.
2182 Application: The Costs of Taxation
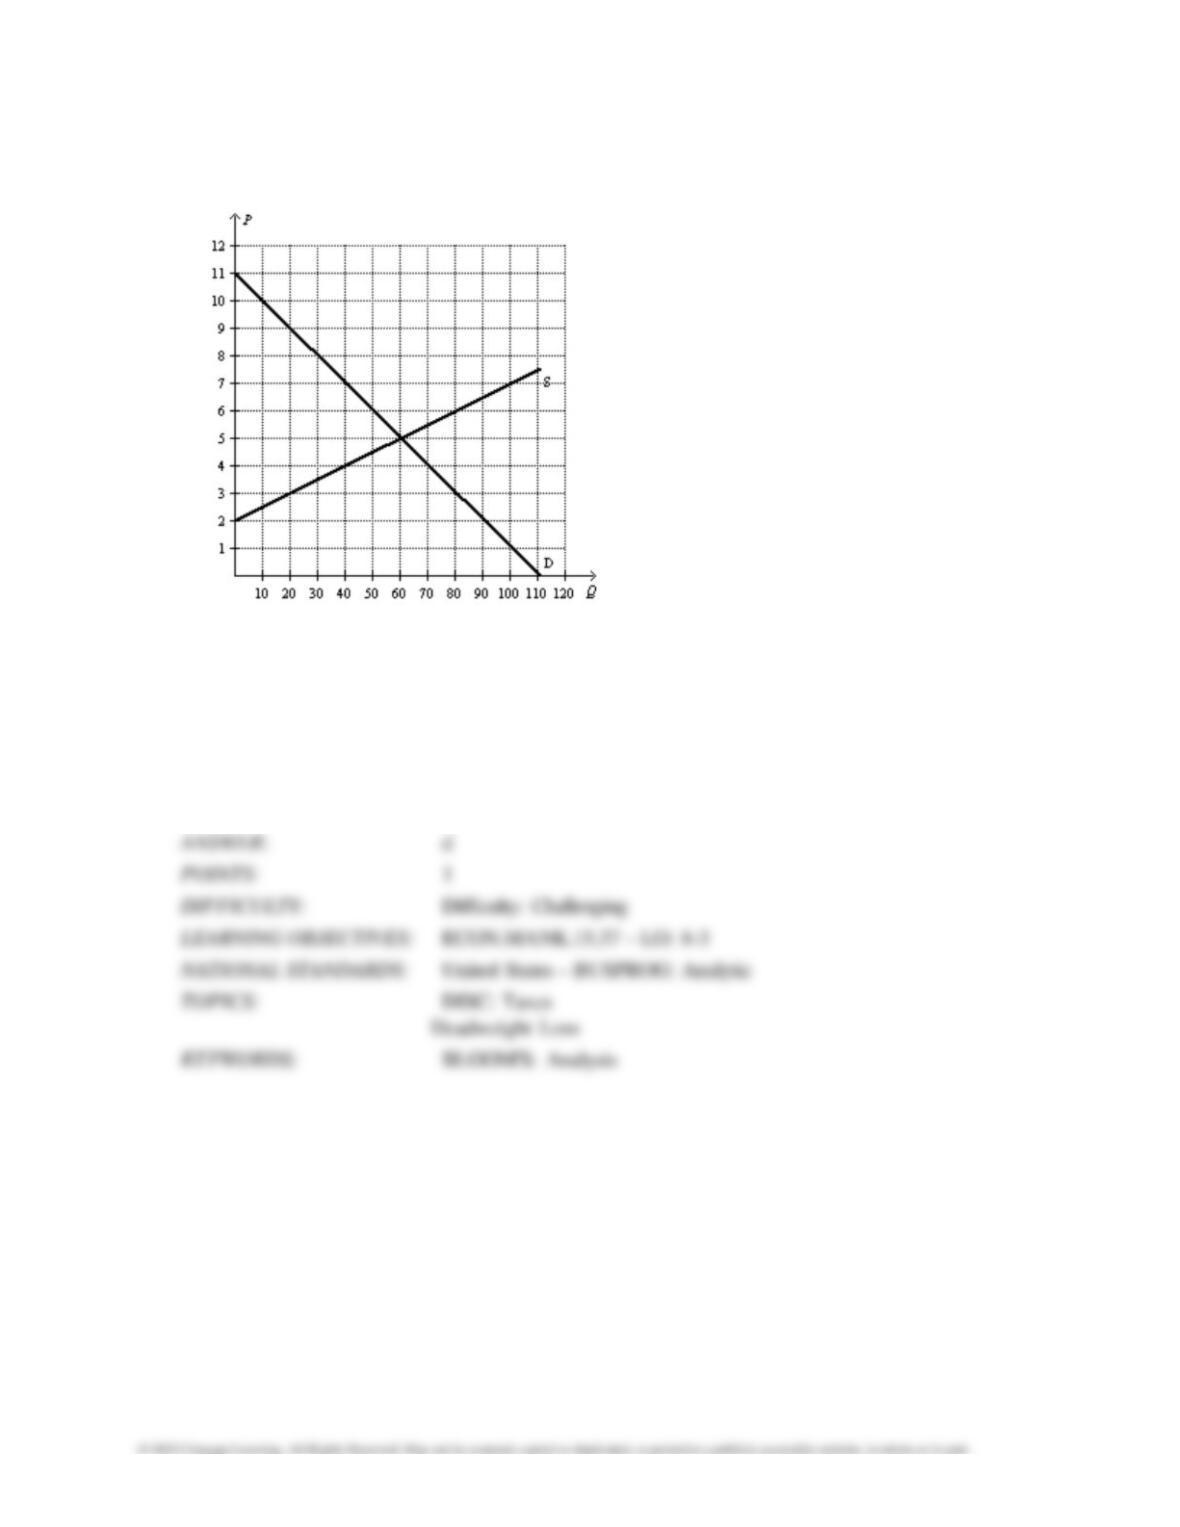
Figure 8-22
54. Refer to Figure 8-22. Suppose the government changed the per-unit tax on this good from
$3.00 to $1.50. Compared to the original tax rate, this lower tax rate would
a. increase tax revenue and increase the deadweight loss from the tax.
b. increase tax revenue and decrease the deadweight loss from the tax.
c. decrease tax revenue and increase the deadweight loss from the tax.
d. decrease tax revenue and decrease the deadweight loss from the tax.
Application: The Costs of Taxation 2183
55. Refer to Figure 8-22. Suppose the government changed the per-unit tax from $3.00 to $4.50.
Compared to the original tax rate, this higher tax rate would
a. increase tax revenue and increase the deadweight loss from the tax.
b. increase tax revenue and decrease the deadweight loss from the tax.
c. decrease tax revenue and increase the deadweight loss from the tax.
d. decrease tax revenue and decrease the deadweight loss from the tax.
56. Refer to Figure 8-22. Suppose the government initially imposes a $3 per-unit tax on this good.
Now suppose the government is deciding whether to lower the tax to $1.50 or raise it to $4.50.
Which of the following statements is correct?
a. Compared to the original tax, the smaller tax will decrease both tax revenue and deadweight
loss.
b. Compared to the original tax, the larger tax will increase both tax revenue and deadweight loss.
c. Compared to the original tax, the larger tax will decrease tax revenue and increase deadweight
loss.
d. Both a and b are correct.
2184 Application: The Costs of Taxation
57. Refer to Figure 8-22. Suppose the government initially imposes a $3 per-unit tax on this good.
Now suppose the government is deciding whether to lower the tax to $1.50 or raise it to $4.50.
Which of the following statements is not correct?
a. Compared to the original tax, the larger tax will decrease tax revenue.
b. Compared to the original tax, the smaller tax will decrease deadweight loss.
c. Compared to the original tax, the smaller tax will decrease tax revenue.
d. Compared to the original tax, the larger tax will increase deadweight loss.
58. Refer to Figure 8-22. Suppose the government initially imposes a $3 per-unit tax on this good.
Now suppose the government is deciding whether to lower the tax to $1.50 or raise it to $4.50.
Which of the following statements is not correct?
a. Compared to the original tax, the larger tax will decrease tax revenue.
b. Compared to the original tax, the smaller tax will decrease deadweight loss.
c. Compared to the original tax, the smaller tax will decrease tax revenue.
d. Compared to the original tax, the larger tax will increase deadweight loss.
Application: The Costs of Taxation 2185
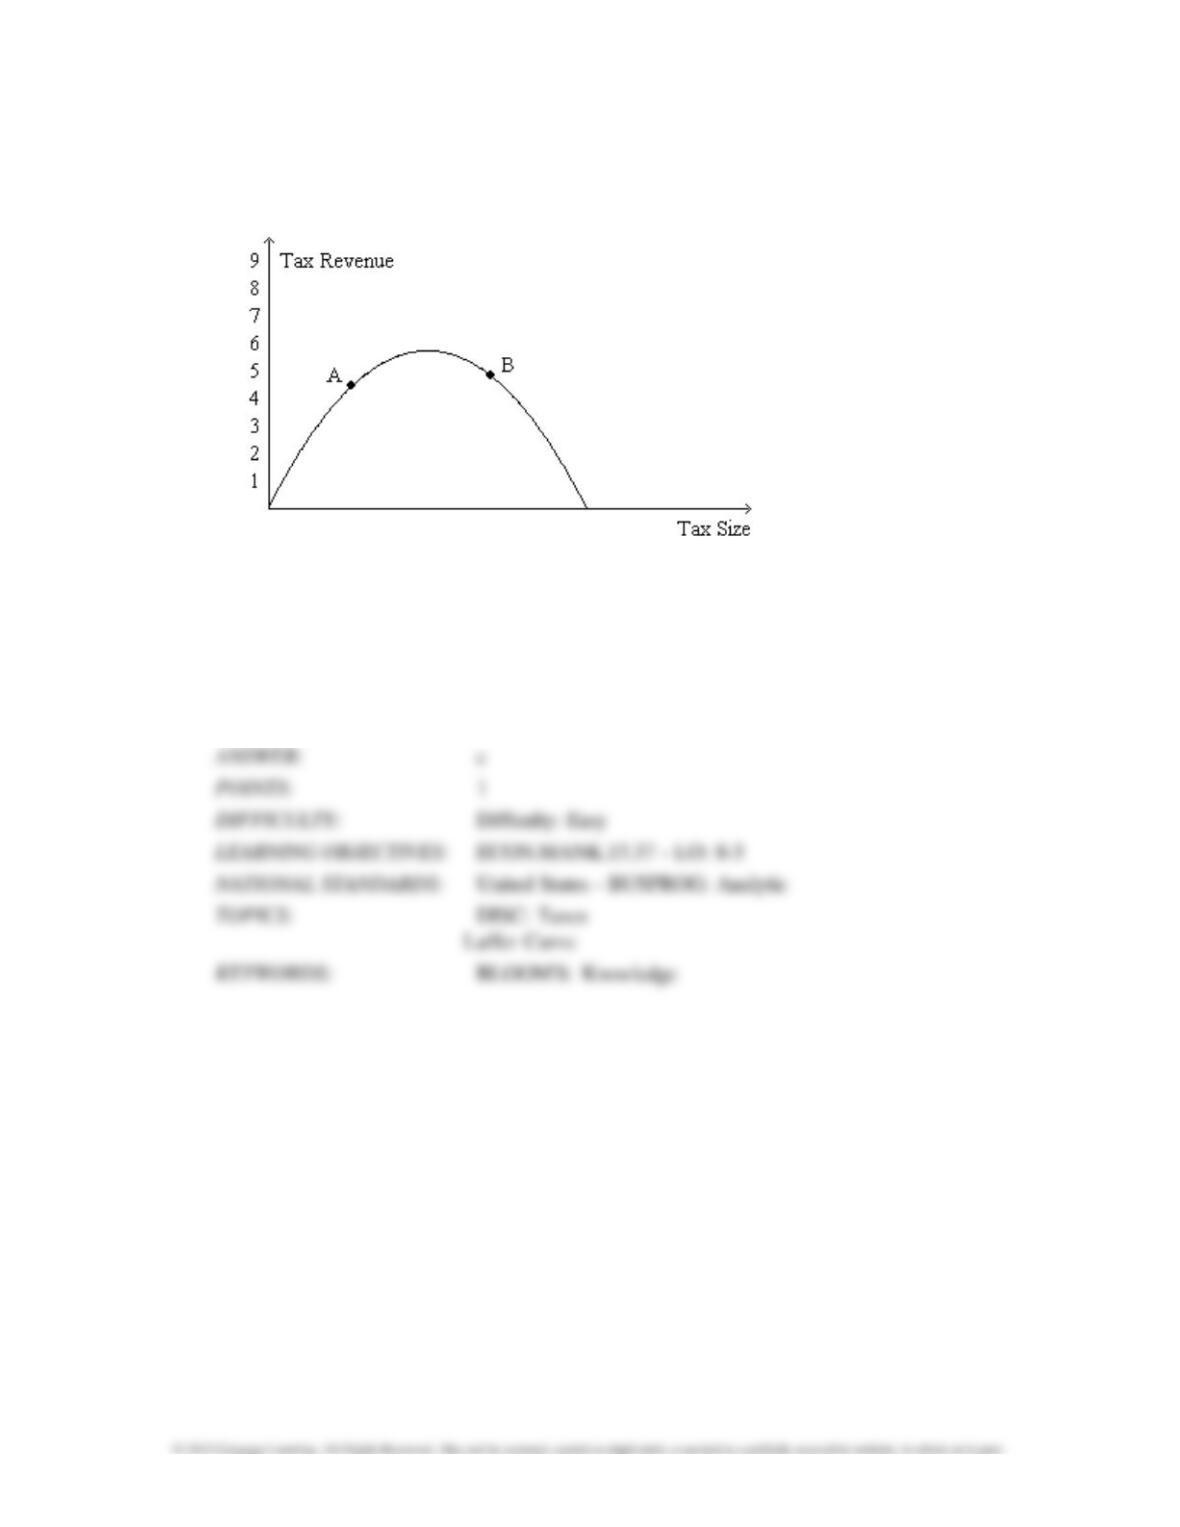
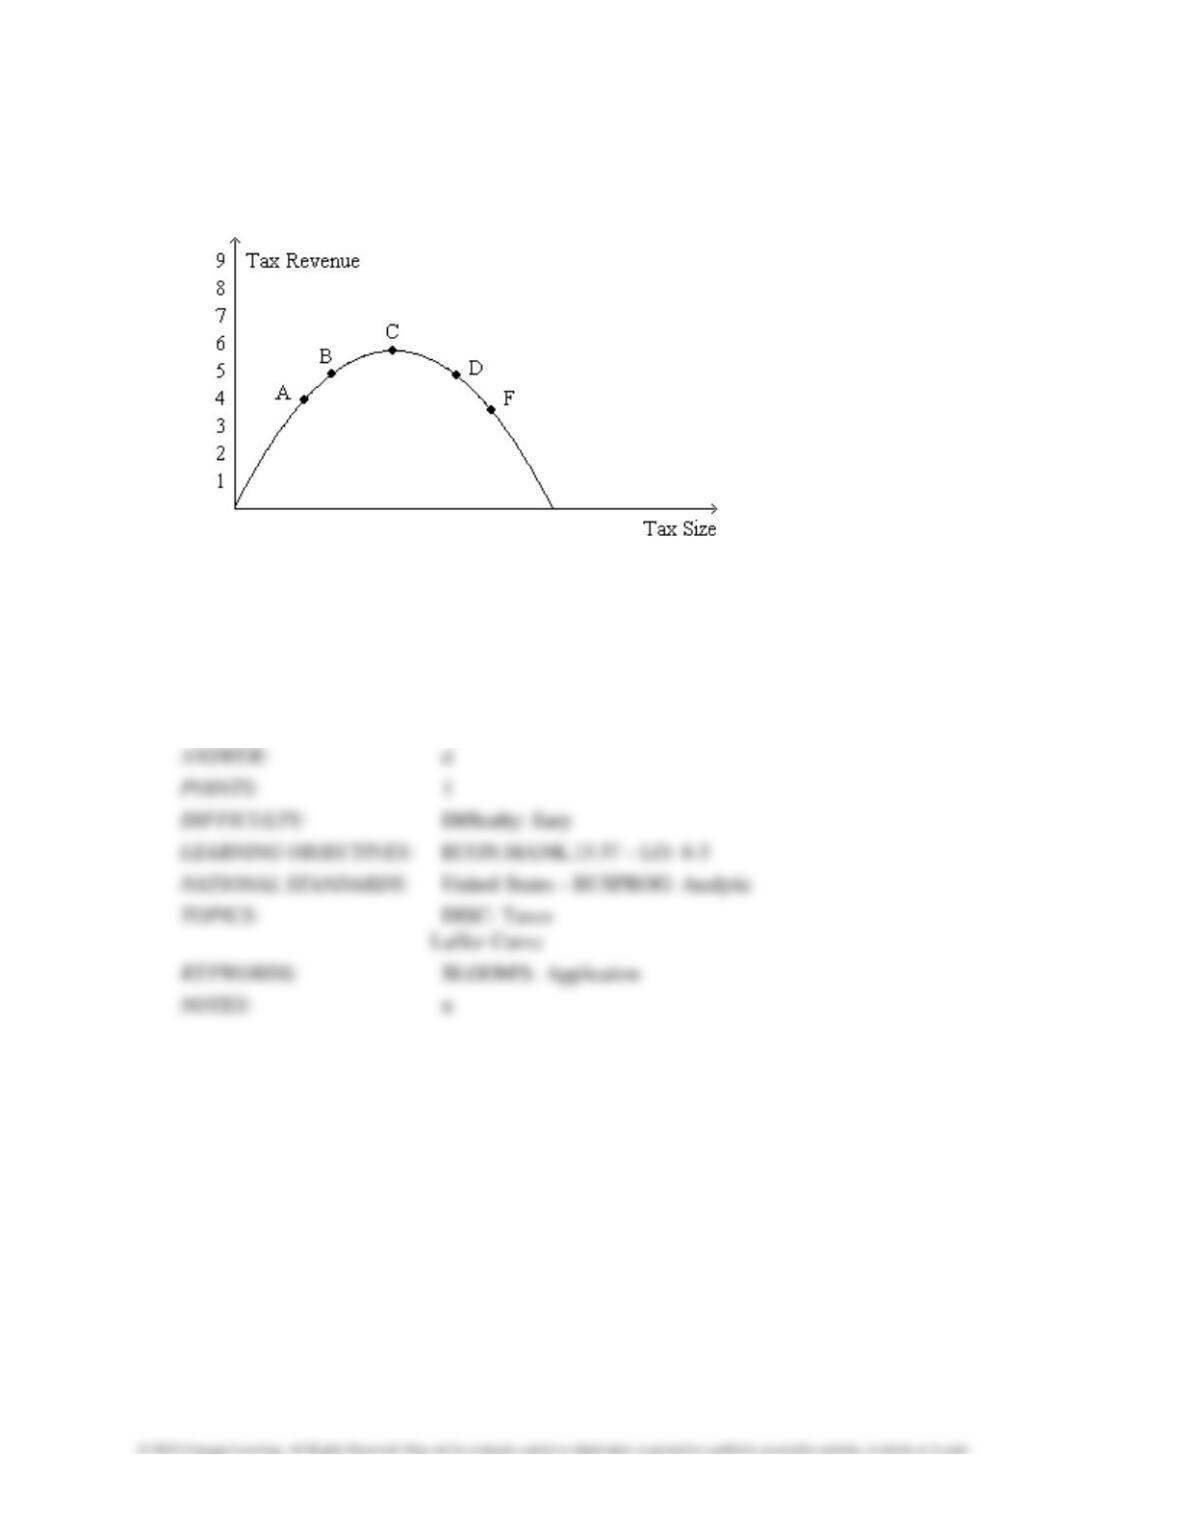
Figure 8-23. The figure represents the relationship between the size of a tax and the tax revenue
raised by that tax.
59. Refer to Figure 8-23. The curve that is shown on the figure is called the
a. deadweight-loss curve.
b. tax-incidence curve.
c. Laffer curve.
d. Lorenz curve.
2186 Application: The Costs of Taxation
60. Refer to Figure 8-23. If the economy is at point A on the curve, then a small increase in the tax
rate will
a. increase the deadweight loss of the tax and increase tax revenue.
b. increase the deadweight loss of the tax and decrease tax revenue.
c. decrease the deadweight loss of the tax and increase tax revenue.
d. decrease the deadweight loss of the tax and decrease tax revenue.
61. Refer to Figure 8-23. If the economy is at point A on the curve, then a decrease in the tax rate
will
a. increase the deadweight loss of the tax and increase tax revenue.
b. increase the deadweight loss of the tax and decrease tax revenue.
c. decrease the deadweight loss of the tax and increase tax revenue.
d. decrease the deadweight loss of the tax and decrease tax revenue.
Application: The Costs of Taxation 2187
62. Refer to Figure 8-23. If the economy is at point B on the curve, then an increase in the tax rate
will
a. increase the deadweight loss of the tax and increase tax revenue.
b. increase the deadweight loss of the tax and decrease tax revenue.
c. decrease the deadweight loss of the tax and increase tax revenue.
d. decrease the deadweight loss of the tax and decrease tax revenue.
63. Refer to Figure 8-23. If the economy is at point B on the curve, then a small decrease in the tax
rate will
a. increase the deadweight loss of the tax and increase tax revenue.
b. increase the deadweight loss of the tax and decrease tax revenue.
c. decrease the deadweight loss of the tax and increase tax revenue.
d. decrease the deadweight loss of the tax and decrease tax revenue.
2188 Application: The Costs of Taxation
Figure 8-24. The figure represents the relationship between the size of a tax and the tax revenue
raised by that tax.
64. Refer to Figure 8-24. Tax revenue would
a. decrease if the economy began at point B and then the tax rate was decreased.
b. increase if the economy began at point F and then the tax rate was decreased.
c. decrease if the economy began at point C and then the tax rate was increased.
d. All of the above are correct.
Application: The Costs of Taxation 2189
65. Refer to Figure 8-24. For an economy that is currently at point D on the curve, a decrease in
the tax rate would
a. decrease consumer surplus.
b. decrease producer surplus.
c. increase tax revenue.
d. increase the deadweight loss of the tax.
66. In 2012, in The Wall Street Journal, economists Peter Diamond and Emmanuel Saez wrote that,
according to their analysis, the federal government’s tax revenue would be maximized if the
marginal income tax rate on individuals with the highest earnings were in or near the range of
a. 10 percent to 30 percent.
b. 30 percent to 50 percent.
c. 50 percent to 70 percent.
d. 70 percent to 90 percent.
2190 Application: The Costs of Taxation
67. In 2012, in The Wall Street Journal, economists Peter Diamond and Emmanuel Saez asserted the
following:
a. Since World War II, higher tax rates on individuals with the highest incomes tend to be
associated with higher
rates of economic growth — not with lower rates of economic growth.
b. The average federal income tax rate on the top 1 percent of income-earners in the United
States more than doubled between 1970 and 2010.
c. A “reasonable” increase in the tax rate on top income earners is all that is needed to solve
long-term fiscal problems faced by the United States.
d. All of the above are correct.
68. In 2012, in The Wall Street Journal, economists Edward Prescott and Lee Ohanian asserted that
a. in the United States, when the average worker earns $100 from additional work, he or she will
be able to consume an additional $85 worth of goods and services.
b. the typical American has always worked more hours per year than the typical Frenchman and
the typical German, despite vastly different tax rates in those countries.
c. raising tax rates from their 2012 levels would significantly reduce U.S. economic activity.
d. raising tax rates from their 2012 levels would significantly increase the federal government’s
tax revenue.