Application: The Costs of Taxation 2091
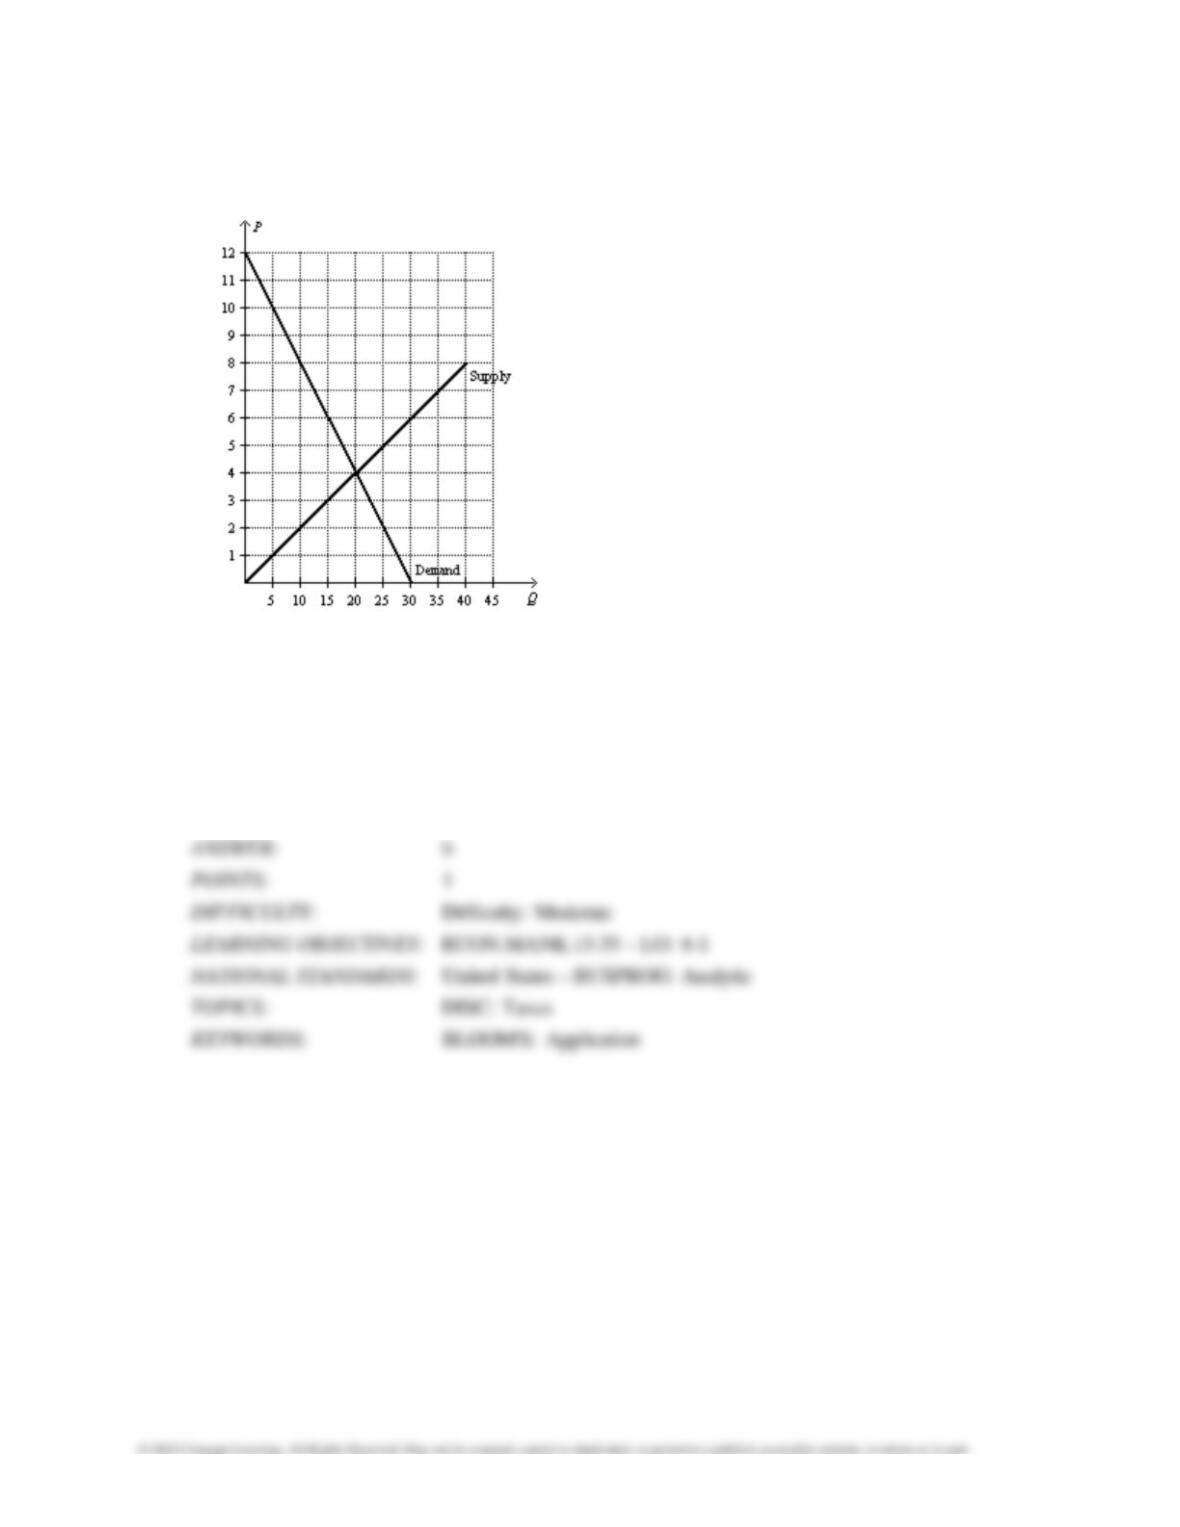
199. Refer to Figure 8-9. The per-unit burden of the tax on sellers is
a. $20.
b. $200.
c. $300.
d. $500.
200. Refer to Figure 8-9. The amount of tax revenue received by the government is
a. $4,000.
b. $6,000.
c. $10,000.
d. $24,000.
201. Refer to Figure 8-9. The consumer surplus without the tax is
a. $2,000.
b. $5,000.
c. $8,000.
d. $16,000.
2092 Application: The Costs of Taxation
202. Refer to Figure 8-9. The consumer surplus with the tax is
a. $2,000.
b. $4,000.
c. $6,000.
d. $8,000.
203. Refer to Figure 8-9. The loss of consumer surplus as a result of the tax is
a. $2,000.
b. $4,000.
c. $6,000.
d. $8,000.
Application: The Costs of Taxation 2093
204. Refer to Figure 8-9. The producer surplus without the tax is
a. $3,000.
b. $8,000.
c. $12,000.
d. $24,000.
205. Refer to Figure 8-9. The producer surplus with the tax is
a. $3,000.
b. $6,000.
c. $9,000.
d. $12,000.
206. Refer to Figure 8-9. The loss of producer surplus as a result of the tax is
a. $3,000.
b. $6,000.
c. $9,000.
d. $12,000.
2094 Application: The Costs of Taxation
207. Refer to Figure 8-9. The total surplus without the tax is
a. $8,000.
b. $12,000.
c. $20,000.
d. $40,000.
208. Refer to Figure 8-9. The total surplus with the tax is
a. $2,000.
b. $3,000.
c. $15,000.
d. $20,000.
Application: The Costs of Taxation 2095
209. Refer to Figure 8-9. The amount of amount of deadweight loss as a result of the tax is
a. $4,000.
b. $5,000.
c. $6,000.
d. $10,000.
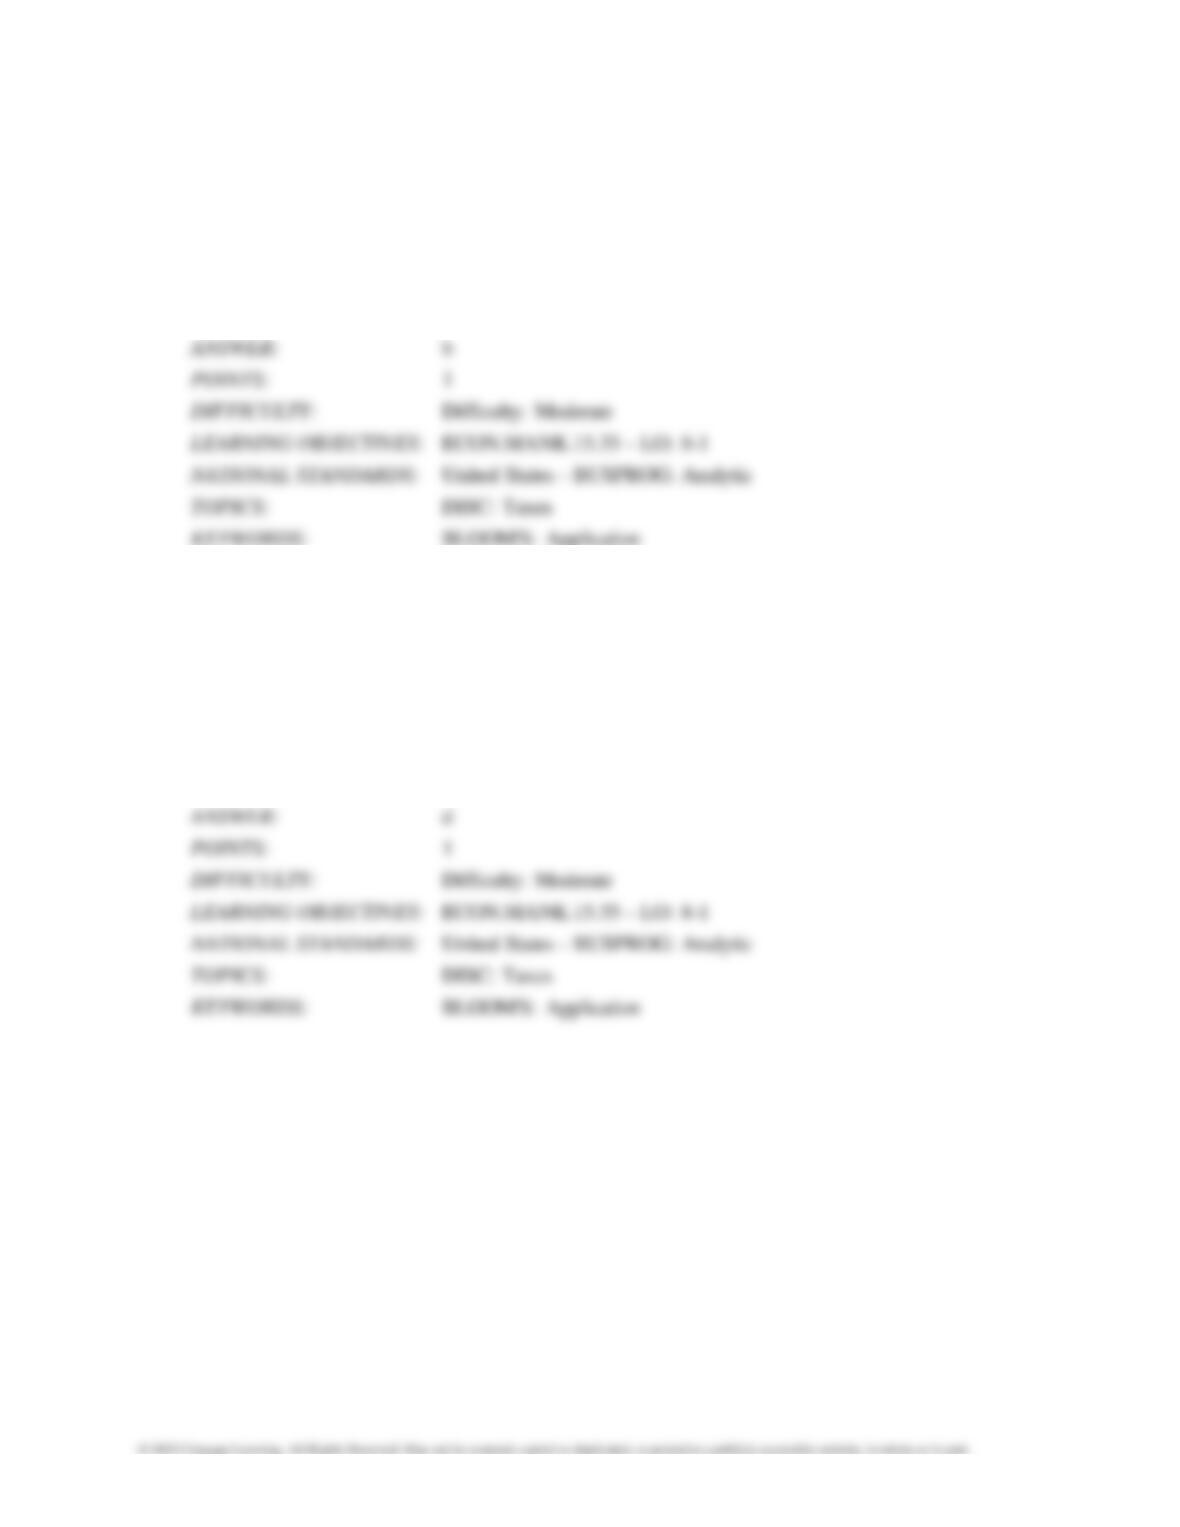
Figure 8-10
2096 Application: The Costs of Taxation
210. Refer to Figure 8-10. Suppose the government imposes a tax that reduces the quantity sold in
the market after the tax to Q2. The price that buyers pay is
a. P0.
b. P2.
c. P5.
d. P8.
211. Refer to Figure 8-10. Suppose the government imposes a tax that reduces the quantity sold in
the market after the tax to Q2. The price that sellers receive is
a. P0.
b. P2.
c. P5.
d. P8.

Application: The Costs of Taxation 2097
212. Refer to Figure 8-10. Suppose the government imposes a tax that reduces the quantity sold in
the market after the tax to Q2. The size of the tax is
a. P0–P2.
b. P2-P8.
c. P2–P5.
d. P5-P8.
213. Refer to Figure 8-10. Suppose the government imposes a tax that reduces the quantity sold in
the market after the tax to Q2. The tax revenue is
a. (P0-P2) x Q2.
b. (P2-P8) x Q2.
c. (P2-P5) x Q5.
d. (P5-P8) x Q5.
2098 Application: The Costs of Taxation
214. Refer to Figure 8-10. Suppose the government imposes a tax that reduces the quantity sold in
the market after the tax to Q2. Without the tax, the consumer surplus is
a. (P0-P2) x Q2.
b. 1/2 x (P0-P2) x Q2.
c. (P0-P5) x Q5.
d. 1/2 x (P0-P5) x Q5.
215. Refer to Figure 8-10. Suppose the government imposes a tax that reduces the quantity sold in
the market after the tax to Q2. With the tax, the consumer surplus is
a. (P0-P2) x Q2.
b. 1/2 x (P0-P2) x Q2.
c. (P0-P5) x Q5.
d. 1/2 x (P0-P5) x Q5.
Application: The Costs of Taxation 2099
216. Refer to Figure 8-10. Suppose the government imposes a tax that reduces the quantity sold in
the market after the tax to Q2. Without the tax, the producer surplus is
a. (P5-0) x Q5.
b. 1/2 x (P5-0) x Q5.
c. (P8-0) x Q2.
d. 1/2 x (P8-0) x Q2.
217. Refer to Figure 8-10. Suppose the government imposes a tax that reduces the quantity sold in
the market after the tax to Q2. With the tax, the producer surplus is
a. (P5-0) x Q5.
b. 1/2 x (P5-0) x Q5.
c. (P8-0) x Q2.
d. 1/2 x (P8-0) x Q2.
2100 Application: The Costs of Taxation
218. Refer to Figure 8-10. Suppose the government imposes a tax that reduces the quantity sold in
the market after the tax to Q2. Without the tax, the total surplus is
a. [1/2 x (P0-P5) x Q5] + [1/2 x (P5-0) x Q5].
b. [1/2 x (P0-P2) x Q2] +[(P2-P8) x Q2] + [1/2 x (P8-0) x Q2].
c. (P2-P8) x Q2.
d. 1/2 x (P2-P8) x (Q5-Q2).
219. Refer to Figure 8-10. Suppose the government imposes a tax that reduces the quantity sold in
the market after the tax to Q2. With the tax, the total surplus is
a. [1/2 x (P0-P5) x Q5] + [1/2 x (P5-0) x Q5].
b. [1/2 x (P0-P2) x Q2] +[(P2-P8) x Q2] + [1/2 x (P8-0) x Q2].
c. (P2-P8) x Q2.
d. 1/2 x (P2-P8) x (Q5-Q2).
Application: The Costs of Taxation 2101
220. Refer to Figure 8-10. Suppose the government imposes a tax that reduces the quantity sold in
the market after the tax to Q2. The deadweight loss of the tax is
a. [1/2 x (P0-P5) x Q5] + [1/2 x (P5-0) x Q5].
b. [1/2 x (P0-P2) x Q2] +[(P2-P8) x Q2] + [1/2 x (P8-0) x Q2].
c. (P2-P8) x Q2.
d. 1/2 x (P2-P8) x (Q5-Q2).
Figure 8-11
2102 Application: The Costs of Taxation
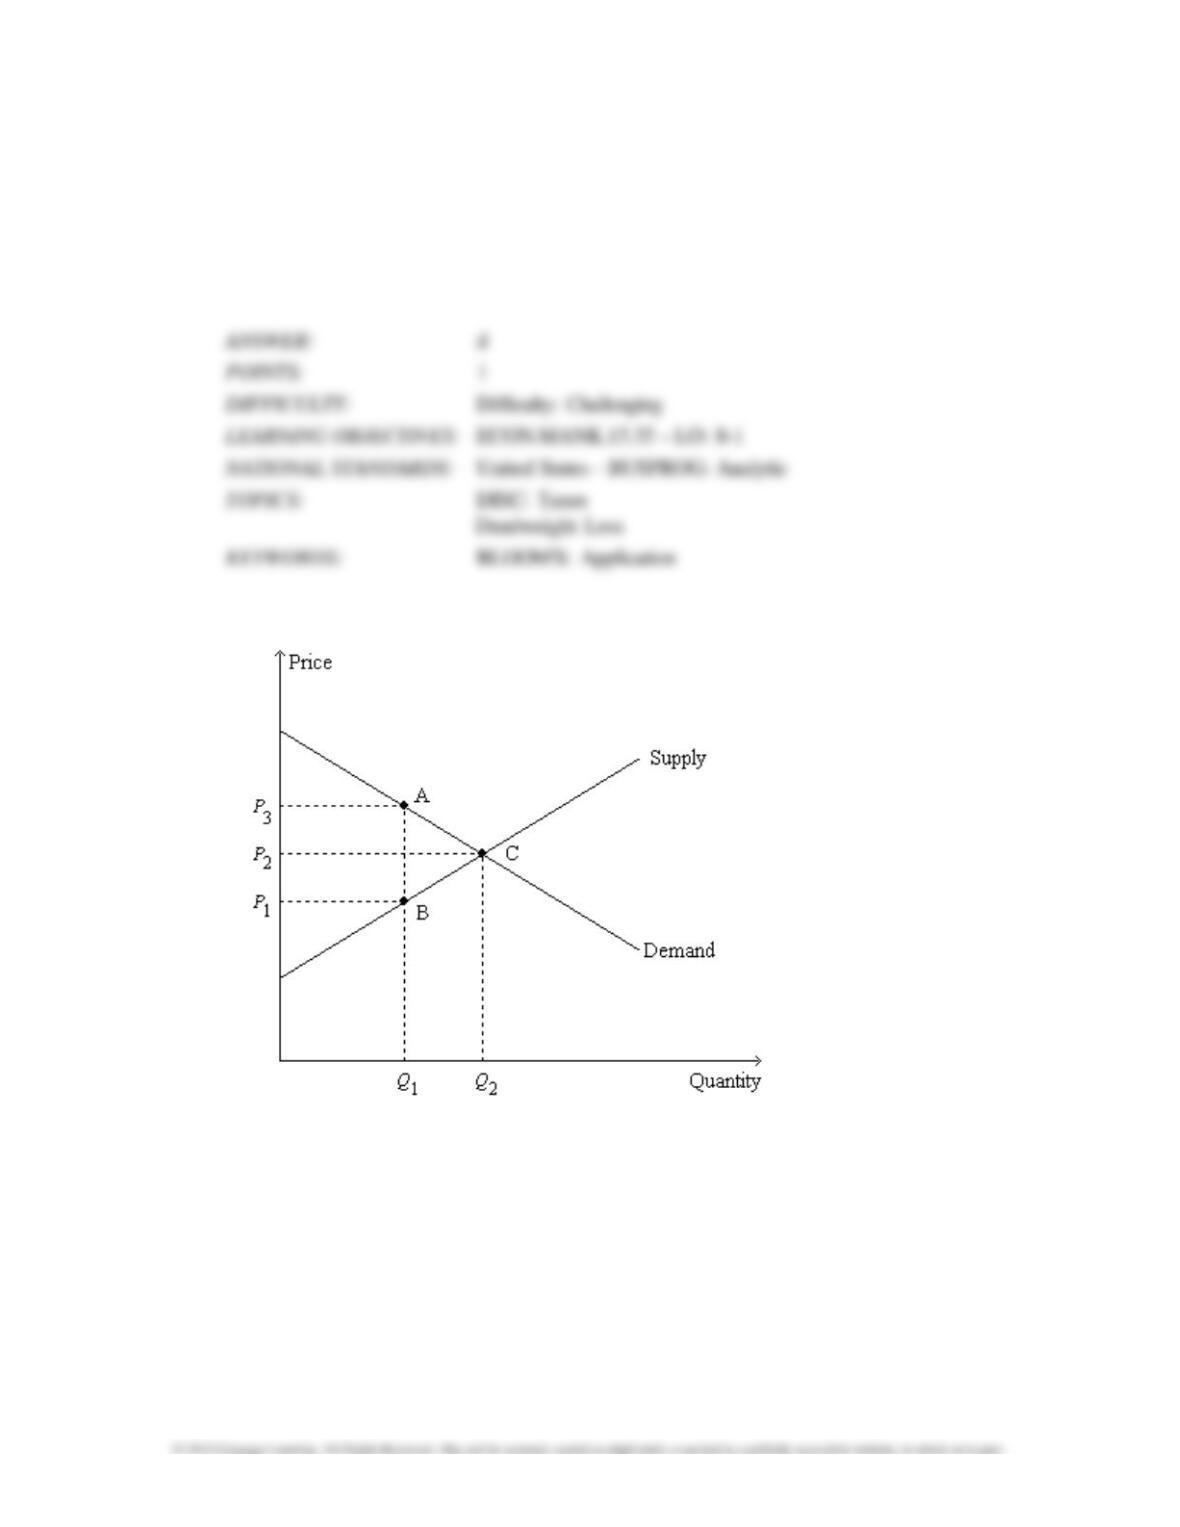
221. Refer to Figure 8-11. The size of the tax is represented by the
a. length of the line segment connecting points A and B.
b. length of the line segment connecting points A and C.
c. length of the line segment connecting points B and C.
d. area of the triangle bounded by the points A, B, and C.
222. Refer to Figure 8-11. The length of the line segment connecting points A and B represents
a. the difference between the price paid by buyers after the tax is imposed and the price
received by sellers after the tax is imposed.
b. the size of the tax.
c. the “tax wedge.”
d. All of the above are correct.
Application: The Costs of Taxation 2103
223. Refer to Figure 8-11. The deadweight loss of the tax is represented by the
a. length of the line segment connecting points A and B.
b. length of the line segment connecting points A and C.
c. length of the line segment connecting points B and C.
d. area of the triangle bounded by the points A, B, and C.
224. Refer to Figure 8–11. The price labeled as P1 on the vertical axis represents the price
a. received by sellers before the tax is imposed.
b. received by sellers after the tax is imposed.
c. paid by buyers before the tax is imposed.
d. paid by buyers after the tax is imposed.
2104 Application: The Costs of Taxation
225. Refer to Figure 8–11. The price labeled as P2 on the vertical axis represents the
a. difference between the price paid by buyers after the tax is imposed and the price paid by
buyers before the tax is imposed.
b. difference between the price received by sellers before the tax is imposed and the price
received by sellers after the tax is imposed.
c. price of the good before the tax is imposed.
d. price of the good after the tax is imposed.
226. Refer to Figure 8–11. The price labeled as P3 on the vertical axis represents the price
a. received by sellers before the tax is imposed.
b. received by sellers after the tax is imposed.
c. paid by buyers before the tax is imposed.
d. paid by buyers after the tax is imposed.
Application: The Costs of Taxation 2105
227. Refer to Figure 8-11. Neither a shift of the demand curve nor a shift of the supply curve is
shown on the figure. However, we know that, when the tax is imposed,
a. the demand curve will shift.
b. the supply curve will shift.
c. either the demand curve or the supply curve will shift.
d. None of the above are correct; the tax causes neither the demand curve nor the supply curve
to shift.
228. Refer to Figure 8-11. The tax revenue that the government collects equals
a. .
b. .
c. .
d. .
2106 Application: The Costs of Taxation
229. Refer to Figure 8-11. Suppose Q1 = 4; Q2 = 7; P1 = $6; P2 = $8; and P3 = $10. Then the
deadweight loss of the tax is
a. $6.
b. $8.
c. $9.
d. $12.
230. Refer to Figure 8-11. Suppose Q1 = 4; Q2 = 7; P1 = $6; P2 = $8; and P3 = $10. Then, when
the tax is imposed,
a. consumer surplus decreases by $13.
b. producer surplus decreases by $13.
c. the deadweight loss amounts to $6.
d. the amount of the good that is sold remains unchanged.
Application: The Costs of Taxation 2107
231. Refer to Figure 8-11. Suppose Q1 = 4; Q2 = 7; P1 = $6; P2 = $8; and P3 = $10. Then, when
the tax is imposed,
a. the government collects $28 in tax revenue.
b. producer surplus decreases by $13.
c. consumer surplus decreases by $11.
d. the deadweight loss amounts to $9.
232. Refer to Figure 8-11. Suppose Q1 = 4; Q2 = 7; P1 = $6; P2 = $8; and P3 = $10. Then, when
the tax is imposed,
a. consumer surplus decreases by $11.
b. producer surplus decreases by $11.
c. the deadweight loss amounts to $6.
d. All of the above are correct.
2108 Application: The Costs of Taxation
Figure 8-12
233. Refer to Figure 8-12. Suppose a $3 per-unit tax is placed on this good. The tax causes the
price paid by buyers to
a. decrease by $3.
b. increase by $2.
c. decrease by $1.
d. increase by $6.
Application: The Costs of Taxation 2109
234. Refer to Figure 8-12. Suppose a $3 per-unit tax is placed on this good. The tax causes the
price received by sellers to
a. decrease by $3.
b. increase by $2.
c. decrease by $1.
d. increase by $6.
235. Refer to Figure 8-12. Suppose a $3 per-unit tax is placed on this good. The per-unit burden of
the tax on buyers is
a. $1.
b. $2.
c. $3.
d. $4.

2110 Application: The Costs of Taxation
236. Refer to Figure 8-12. Suppose a $3 per-unit tax is placed on this good. The per-unit burden of
the tax on sellers is
a. $1.
b. $2.
c. $3.
d. $4.
237. Refer to Figure 8–12. Suppose a $3 per-unit tax is placed on this good. The amount of tax
revenue collected by the government is
a. $7.50.
b. $15.00.
c. $22.50.
d. $45.00.