103. The marginal propensity to save (MPS) is computed as the change in:
a.
savings divided by the change in saving.
b.
savings divided by the change in disposable personal income.
c.
saving divided by the change in GDP.
d.
None of these.
104. If your disposable personal income increases from $30,000 to $40,000 and your savings increases
from $2,000 to $4,000, your marginal propensity to save (MPS) is:
a.
0.2.
b.
0.4.
c.
0.5.
d.
0.8.
e.
1.0.
105. The sum of the marginal propensity to consume (MPC) and the marginal propensity to save (MPS)
always equals:
a.
1.
c.
the interest rate.
b.
0.
d.
the marginal propensity to invest (MPI).
106. The marginal propensity to save is:
a.
the change in saving induced by a change in consumption.
b.
(change in S) / (change in Y).
c.
1 − MPC / MPC.
d.
(change in Y − bY) / (change in Y).
e.
1 − MPC.
107. The change in saving divided by the change in disposable income is the:
a.
propensity to save.
b.
saving function.
c.
average propensity to save.
d.
extra propensity to save.
e.
marginal propensity to save.
108. The marginal propensity to save is:
a.
the change in saving divided by the change in disposable income.
b.
the change in disposable income divided by the change in saving.
c.
saving divided by disposable income.
d.
disposable income divided by saving.
e.
saving divided by consumption.
109. The relationship between MPC and MPS is:
a.
1 + MPC = MPS.
c.
1 + MPS = MPC.
b.
1 − MPC = MPS.
d.
MPC − MPS = 1.
110. If the marginal propensity to consume = 0.75, then:
a.
the marginal propensity to save = 0.75.
b.
the marginal propensity to save = 1.33.
c.
the marginal propensity to save = 0.20.
d.
the marginal propensity to save = 0.25.
e.
since the marginal propensity to save and the marginal propensity to consume are
unrelated, we cannot determine the marginal propensity to save from the information
given.
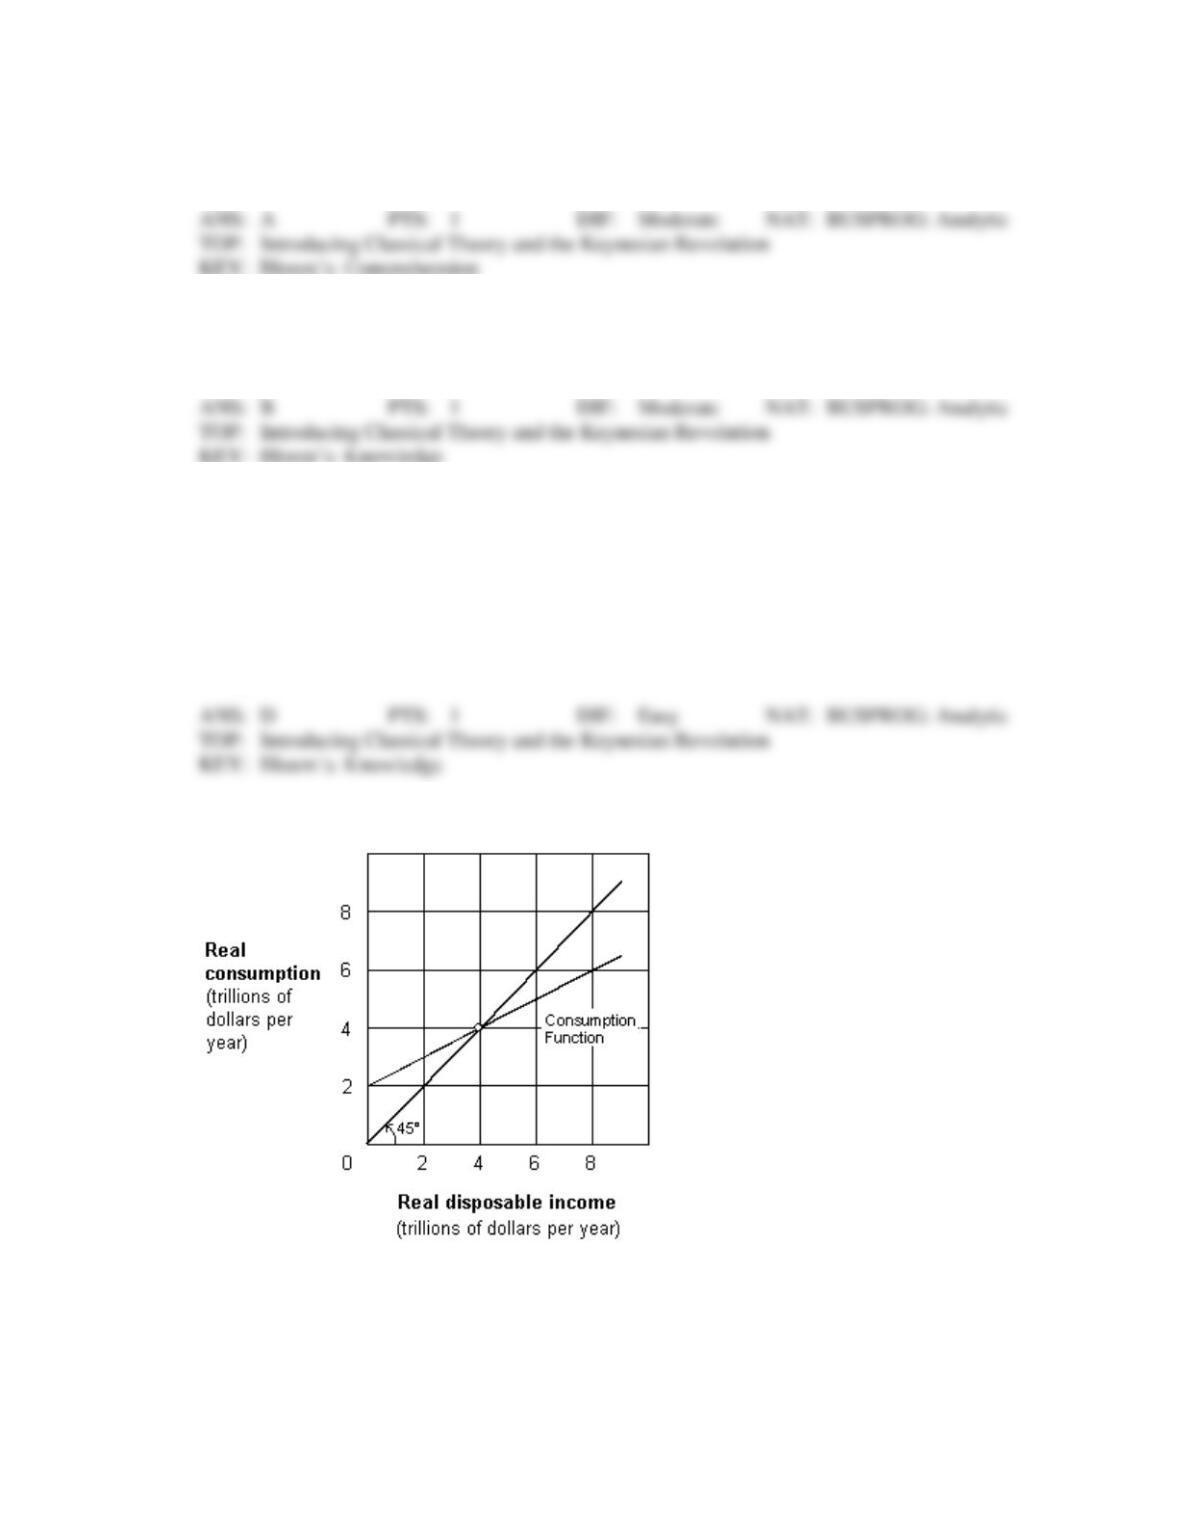
Exhibit 8-2 Consumption function
111. As shown in Exhibit 8-2, autonomous consumption is:
a.
0.
b.
$2 trillion.
c.
$4 trillion.

d.
$6 trillion.
e.
$8 trillion.
112. As shown in Exhibit 8-2, saving occurs:
a.
at 0 disposable income.
b.
between $0 and $4 trillion disposable income.
c.
at $4 trillion disposable income.
d.
at a disposable income greater than $4 trillion.
113. As shown in Exhibit 8-2, the marginal propensity to consume (MPC) is:
a.
0.25.
c.
0.75.
b.
0.50.
d.
0.90.
114. As shown in Exhibit 8-2, the marginal propensity to save (MPS) is:
a.
0.25.
c.
0.75.
b.
0.50.
d.
0.90.
Exhibit 8-3 Disposable income and consumption data
Disposable
income
Consumption
Saving
Marginal propensity to
consume (MPC)
Marginal propensity to
save (MPS)
0
$100
100
175
200
250
300
325
400
400
500
475
600
550
Note: All amounts are in billions of dollars per year.
115. As shown in Exhibit 8-3, autonomous consumption is:
a.
$75 billion.
c.
$175 billion.
b.
$100 billion.
d.
$275 billion.
116. As shown in Exhibit 8-3, if disposable income is $100 billion, saving is:
a.
$100 billion.
c.
−$75 billion.
b.
$75 billion.
d.
−$175 billion.
117. As shown in Exhibit 8-3, if disposable income is $600, saving is:
a.
zero.
b.
−$100 billion.
c.
$100 billion.
d.
−$50 billion.
e.
$50 billion.
118. As shown in Exhibit 8-3, if disposable income is $100 billion, the marginal propensity to consume
(MPC) is:
a.
0.00.
c.
0.75.
b.
0.25.
d.
1.00.
119. As shown in Exhibit 8-3, if disposable income is $400 billion, the marginal propensity to consume
(MPC) is:
a.
0.00.
c.
0.75.
b.
0.25.
d.
1.00.
120. As shown in Exhibit 8-3, if disposable income is $100 billion, the marginal propensity to save (MPS)
is:
a.
0.00.
c.
0.75.
b.
0.25.
d.
1.00.
121. As shown in Exhibit 8-3, if disposable income is $500 billion, the marginal propensity to save (MPS)
is:
a.
0.00.
c.
0.75.
b.
0.25.
d.
1.00.
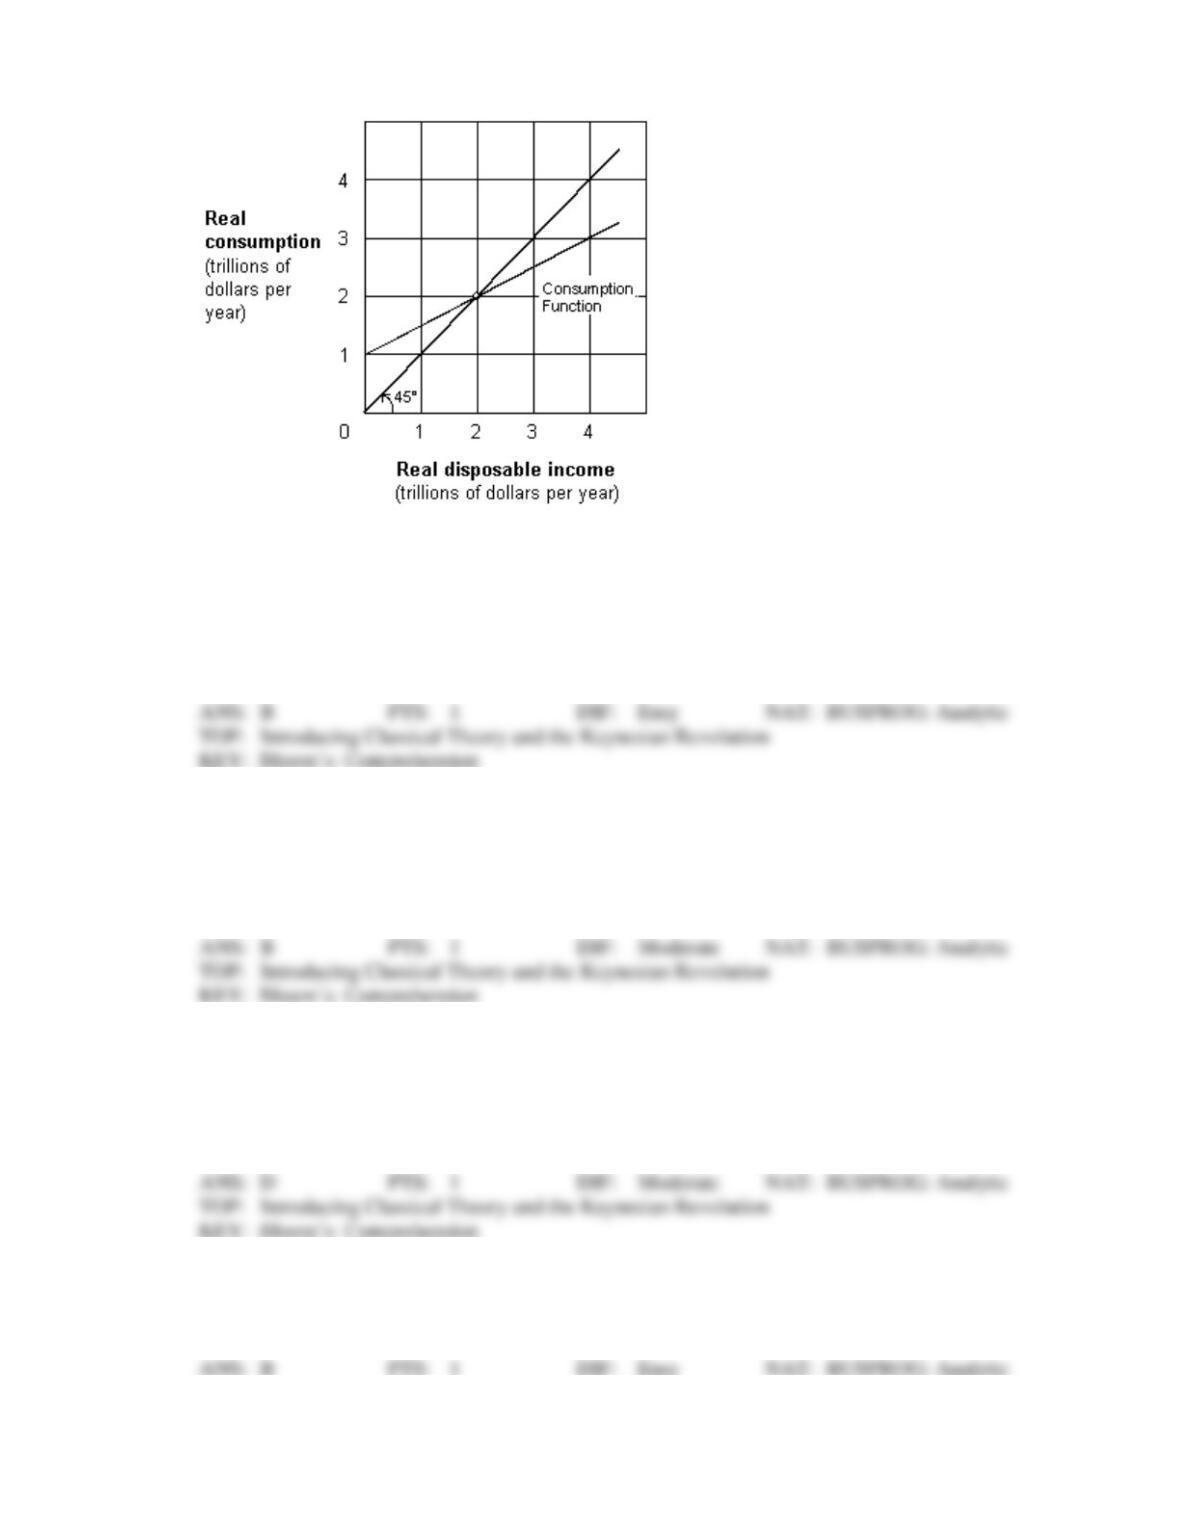
Exhibit 8-4 Consumption function
122. As shown in Exhibit 8-4, autonomous consumption is:
a.
0.
b.
$1 trillion.
c.
$2 trillion.
d.
$3 trillion.
e.
$4 trillion.
123. As shown in Exhibit 8-4, dissaving occurs:
a.
at 0 disposable income.
b.
between $0 and $2 trillion disposable income.
c.
at $2 trillion disposable income.
d.
at a disposable income greater than $2 trillion.
124. As shown in Exhibit 8-4, saving occurs:
a.
at 0 disposable income.
b.
between $0 and $2 trillion disposable income.
c.
at $2 trillion disposable income.
d.
at a disposable income greater than $2 trillion.
125. As shown in Exhibit 8-4, the marginal propensity to consume (MPC) is:
a.
0.25.
c.
0.75.
b.
0.50.
d.
0.90.
126. As shown in Exhibit 8-4, the marginal propensity to save (MPS) is:
a.
0.25.
c.
0.75.
b.
0.50.
d.
0.90.
127. An upward shift in the consumption function, other things being equal, could be caused by households:
a.
becoming optimistic about the state of the economy.
b.
becoming pessimistic about the state of the economy.
c.
expecting future income and wealth to decline.
d.
None of these.
128. A downward shift in the consumption function can be caused by:
a.
expectations of higher inflation.
c.
a lower price level.
b.
an increase in wealth.
d.
none of these.
129. Which of the following events would produce an upward shift in the consumption function, other
things being equal?
a.
An increase in consumer wealth.
c.
A decrease in autonomous consumption.
b.
A decrease in consumer wealth.
d.
None of these.
130. An increase in the wealth of households, other things remaining the same, can result in ____ the
consumption function.
a.
no effect on
c.
a movement to the left along
b.
an upward shift in
d.
a downward shift of
131. A shift in the consumption function:
a.
is based on the marginal propensity to consume.
b.
can be caused by a change in the price level.
c.
can be caused by a change in GDP.
d.
None of these.
132. Which of the following would shift the investment demand curve rightward?
a.
Firms are operating their plants at less than full capacity.
b.
A decrease in the interest rate.
c.
A decrease in business taxes.
d.
All of the above.
e.
None of the above.
133. An increase in the price level, other things remaining the same, may be expected to result in ____ the
consumption function.
a.
a downward shift of
c.
an upward shift in
b.
a movement along
d.
no effect on
134. The investment demand curve shows the amount businesses spend for investment goods at different
possible:
a.
price levels.
c.
rates of interest.
b.
levels of GDP.
d.
levels of taxation.
135. Real investment spending is ____ real personal consumption.
a.
equal to
c.
stable compared to
b.
greater than
d.
highly volatile compared to
136. Which of the following would cause the investment demand curve to shift?
a.
Animal spirits (expectations).
c.
Change in business taxes.
b.
Technological change.
d.
All of these.
137. Which of the following would shift the investment demand curve leftward?
a.
An increase in business taxes.
b.
A decrease in business taxes.
c.
A tax credit for new investment.
d.
Firms are operating their plants at full capacity.
138. Which of the following would shift the investment demand curve rightward?
a.
A decrease in business taxes.
b.
A tax credit for new investment.
c.
Firms move from unused capacity to full capacity.
d.
All of these.
139. In the short-run Keynesian model, investment is:
a.
autonomous in relation to the interest rate.
b.
upward sloping in relation to the price level.
c.
downward sloping in relation to disposable income.
d.
autonomous in relation to real GDP.
140. If the interest rate rises, then firms’ investment spending:
a.
falls.
c.
remains unchanged
b.
also rises.
d.
reacts unpredictably.
141. A downward movement along the investment demand curve would be caused by a(n):
a.
increase in the expected rate of return on investment caused by an increase in business
confidence.
b.
decrease in the expected rate of return on investment caused by a decrease in business
confidence.
c.
increase in the rate of interest.
d.
decrease in the rate of interest.
142. The investment demand curve as a function of various possible interest rates for the entire economy is
assumed to be:
a.
positively sloped.
c.
rising, then falling.
b.
negatively sloped.
d.
falling, then rising.
143. An increase in the rate of interest, other things being equal, will cause a(n):
a.
downward shift in the investment demand curve.
b.
movement downward along the investment demand curve.
c.
movement upward along the investment demand curve.
d.
upward shift in the investment demand curve.
144. A decrease in the rate of interest, other things being equal, will cause a:
a.
rightward shift of the investment demand curve.
b.
movement upward along the investment demand curve.
c.
movement downward along the investment demand curve.
d.
leftward shift of the investment demand curve.
145. A rightward shift of the investment demand curve would be caused by a(n):
a.
increase in the expected rate of return on investment caused by an increase in business
confidence.
b.
decrease in the expected rate of return on investment caused by a decrease in business
confidence.
c.
increase in the rate of interest.
d.
decrease in the rate of interest.
146. A rightward shift of the investment demand curve could be caused by:
a.
a technological advance.
b.
optimism about long-term growth.
c.
forecasts of favorable business conditions.
d.
an increase in confidence in short-run economic conditions.
e.
any of these.
147. Which of the following would cause a rightward shift in the investment demand curve?
a.
An increase in the interest rate.
b.
An increase in the rate of capacity utilization.
c.
An increase in households’ disposable income;
d.
An increase in business taxes.
148. When sketched as a function of disposable income, the investment demand curve is:
a.
always horizontal.
c.
upward sloping.
b.
always vertical.
d.
parabolic.
149. If Y = $100 billion, then C = $50 billion, and I = $60 billion. What will autonomous investment be
when Y = $200 billion and C = $100 billion?
a.
$50 billion
b.
$60 billion
c.
$100 billion
d.
$120 billion
e.
$200 billion
150. Michelle Martelle, CEO of Michelle Enterprises, has five projects in hand and is considering which, if
any, to undertake. Their expected returns are: project A = 12 percent, project B = 7 percent, project C
= 10 percent, project D = 9 percent, and project E = 8 percent. If the interest rate is 8.5 percent, which,
if any, investment projects will she accept?
a.
Only project A.
b.
Projects A and C.
c.
Projects A, C and D.
d.
Projects A, C, D and E.
e.
Projects A, B, C, D and E.
151. A lower interest rate makes more investment projects profitable, meaning that:
a.
there is a direct relationship between the rate of interest and the quantity of investment
spending.
b.
there is an inverse relationship between the rate of interest and the quantity of investment
spending.
c.
there is no relationship between the rate of interest and the quantity of investment
spending.
d.
the demand curve for investment spending is horizontal.
e.
the demand curve for investment spending is vertical.
152. The demand curve for investment in the economy as a function of interest rates is:
a.
vertical.
b.
horizontal.
c.
upward sloping.
d.
downward sloping.
e.
elliptical.
153. When one observes consumption and investment patterns over time, one finds that:
a.
like consumption, investment is fairly stable over time.
b.
like consumption, investment is fairly erratic over time.
c.
unlike consumption, which is fairly stable over time, investment is subject to erratic
fluctuations.
d.
unlike consumption, which is subject to erratic fluctuations, investment is fairly stable
over time.
e.
investment is rarely affected by technological and economic factors.
154. If a major technological breakthrough occurs, then the:
a.
investment demand curve will shift downward.
b.
investment demand curve will shift upward.
c.
consumption function will shift downward.
d.
consumption function will shift upward.
e.
economy will move to a new point along the existing investment demand curve.
155. If the interest rate increases, then the:
a.
economy will move to a new point along the existing consumption function.
b.
consumption function will shift upward.
c.
investment demand curve will shift downward.
d.
investment demand curve will shift upward.
e.
economy will move to a new point along the existing investment demand curve.
156. If there are strong expectations of future economic growth, then the:
a.
economy will move to the right along the existing consumption function.
b.
economy will move to the left along the existing consumption function.
c.
consumption function will shift downward.
d.
consumption function will shift upward.
e.
investment demand curve will shift upward.
157. Which one of the following will shift the investment demand curve leftward?
a.
A technological breakthrough.
b.
Lower tax rates.
c.
Optimistic business expectations.
d.
A lower rate of capacity utilization.
e.
None of these.
158. Which of the following will increase investment spending?
a.
More optimistic business expectations.
b.
An increase in interest rates.
c.
An increase in business taxes.
d.
A decrease in capacity utilization.
e.
All of these.
159. The aggregate expenditures function (AE) is the total spending in an economy at a given:
a.
rate of interest.
c.
level of autonomous investment.
b.
level of disposable income.
d.
price level.
160. The relationship between aggregate expenditures and disposable income is shown by the:
a.
aggregate expenditures curve.
c.
investment curve.
b.
consumption function.
d.
saving-disposable personal income curve.
161. The consumption function is drawn on a graph with disposable income on the horizontal axis without
including investment. Assume investment is autonomous and is added to the consumption function.
The effect is:
a.
an upward adjustment in the vertical intercept.
b.
no change in the adjustment in the vertical intercept.
c.
an increase in the slope of the consumption schedule.
d.
a decrease in the slope of the planned expenditure schedule.
162. The sum of consumption and investment is:
a.
total production.
c.
aggregate disposable demand.
b.
aggregate supply.
d.
aggregate expenditures.
163. In the aggregate expenditures model, equilibrium occurs if:
a.
consumption equals investment.
b.
inventory equals investment.
c.
aggregate expenditures equal consumption.
d.
aggregate expenditures equal disposable income.
164. In the simple Keynesian Cross model, the equilibrium level of real disposable income is determined
by:
a.
the real interest rate.
c.
aggregate expenditures.
b.
prices.
d.
aggregate supply.
165. In the simple Keynesian aggregate expenditure model, the equilibrium level of disposable income is
achieved when:
a.
the employment rate is equal to the labor force participation rate.
b.
saving equals investment.
c.
aggregate expenditures exceed output.
d.
aggregate expenditures are equal to real disposable income.
166. Within the simple Keynesian Cross model, equilibrium takes place:
a.
at full employment.
b.
when aggregate spending equals real disposable income.
c.
when the money interest rate and real interest rate are equal.
d.
when actual and expected rates of inflation are equal.
Exhibit 8-5 Aggregate expenditures function
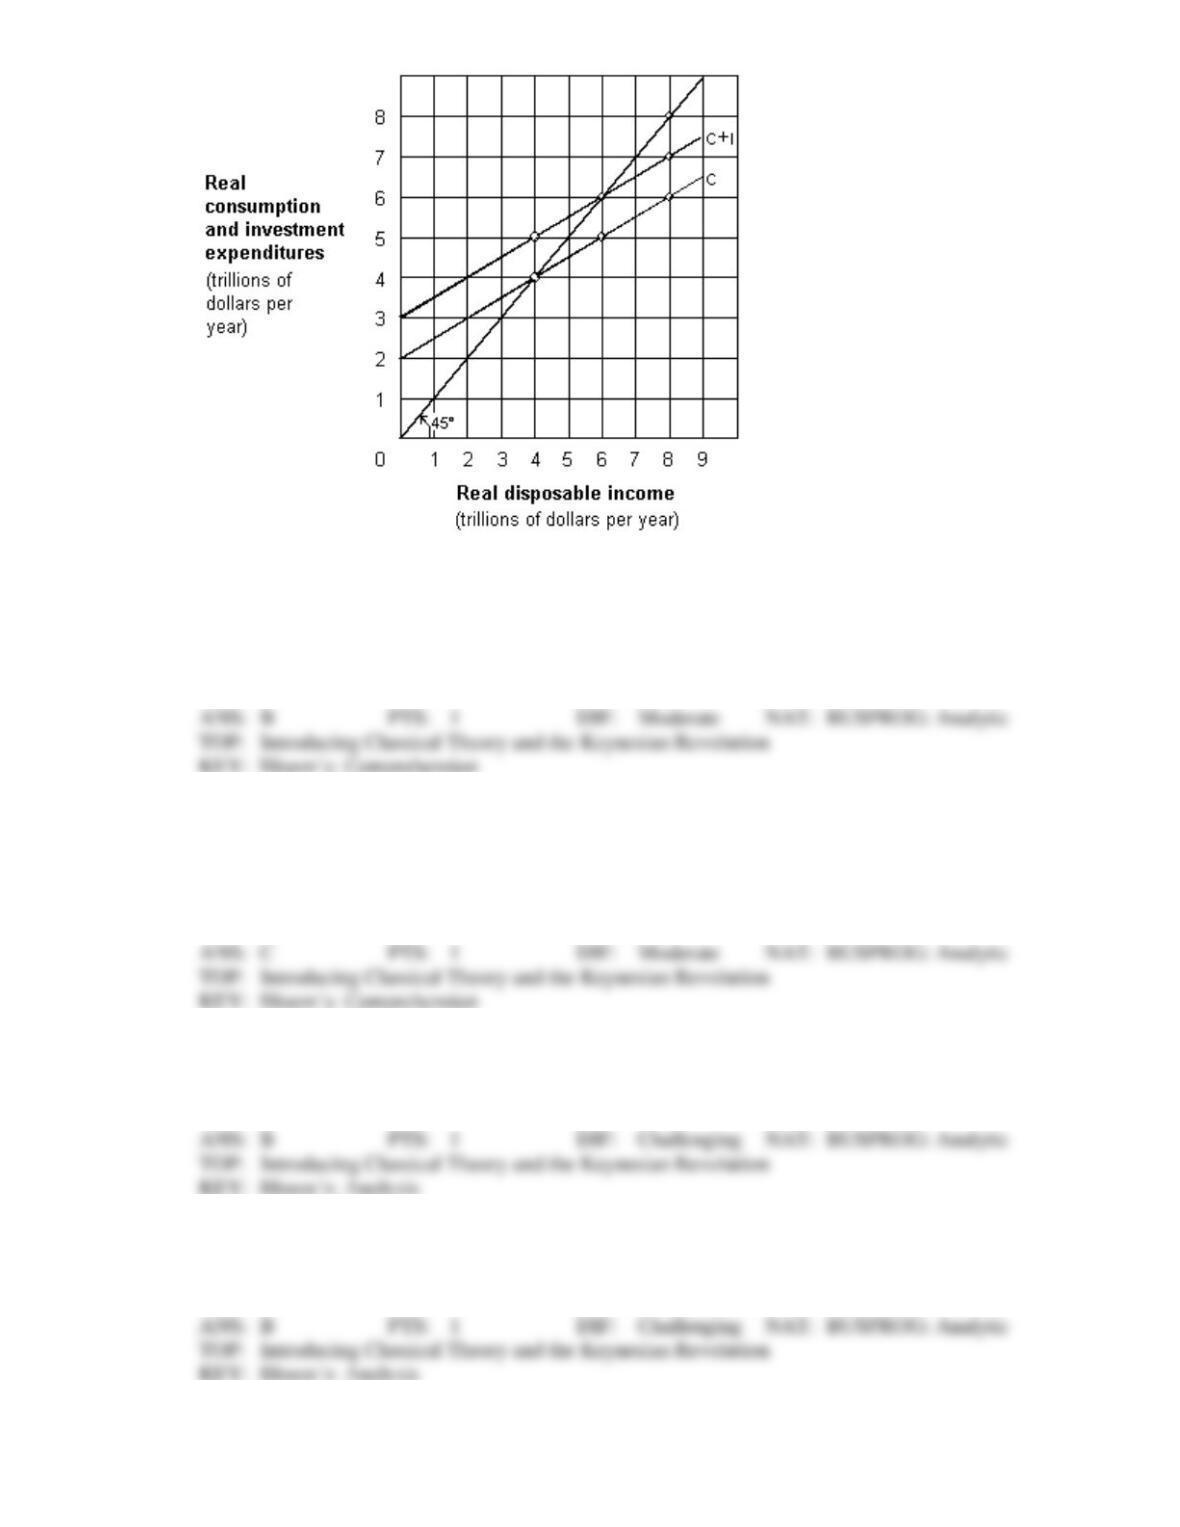
167. As shown in Exhibit 8-5, dissaving occurs:
a.
at $5 trillion.
b.
between 0 and $4 trillion.
c.
where disposable income is greater than $4 trillion.
d.
at $8 trillion.
168. As shown in Exhibit 8-5, saving occurs:
a.
at 0.
b.
between 0 and $4 trillion.
c.
where disposable income is greater than $4 trillion.
d.
at $2 trillion.
169. As shown in Exhibit 8-5, the marginal propensity to consume (MPC) is:
a.
0.33.
c.
0.67.
b.
0.50.
d.
0.75.
170. As shown in Exhibit 8-5, the marginal propensity to save (MPS) is:
a.
0.33.
c.
0.67.
b.
0.50.
d.
0.75.