171. As shown in Exhibit 8-5, autonomous consumption is:
a.
0.
b.
$1 trillion.
c.
$2 trillion.
d.
$3 trillion.
e.
$6 trillion.
172. As shown in Exhibit 8-5, this economy is in macro equilibrium at:
a.
$2 trillion.
c.
$6 trillion.
b.
$4 trillion.
d.
$8 trillion.
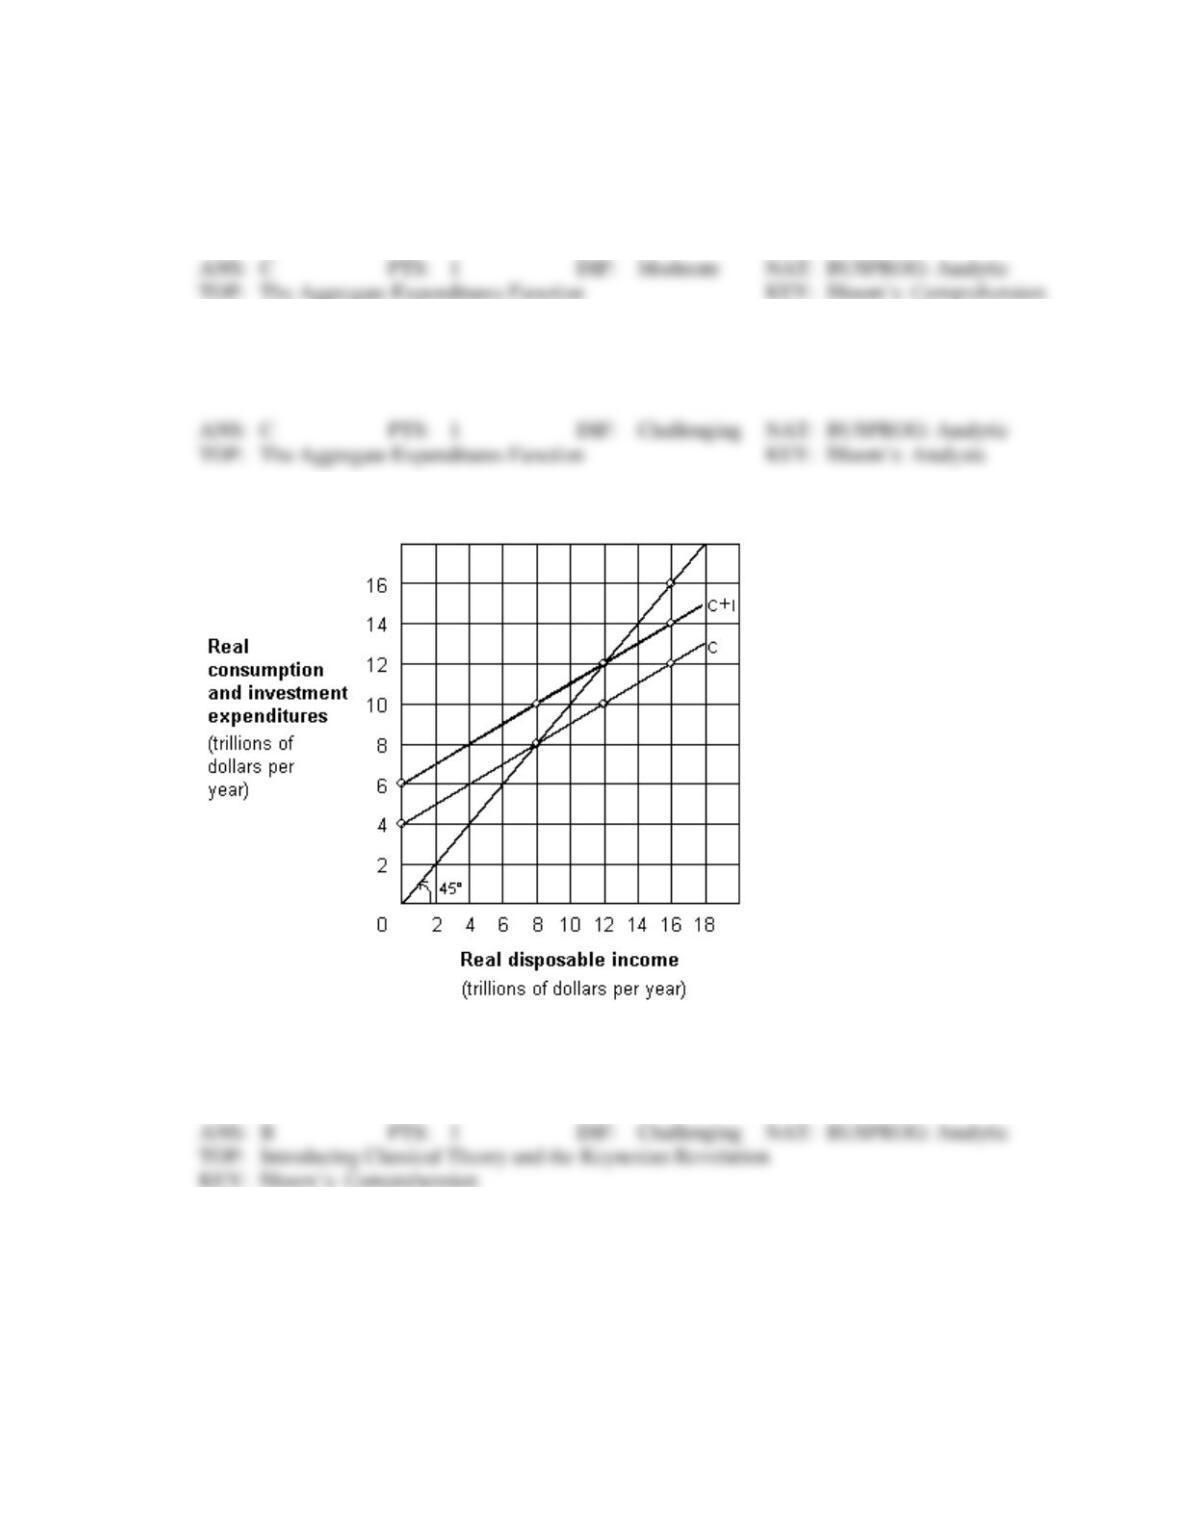
Exhibit 8-6 Aggregate expenditures function
173. As shown in Exhibit 8-6, the marginal propensity to consume (MPC) is:
a.
0.33.
c.
0.67.
b.
0.50.
d.
0.75.
174. As shown in Exhibit 8-6, autonomous consumption is:
a.
0.
b.
$2 trillion.
c.
$4 trillion.
d.
$6 trillion.
e.
$8 trillion.
175. As shown in Exhibit 8-6, this economy is in macro equilibrium at:
a.
$8 trillion.
c.
$16 trillion.
b.
$12 trillion.
d.
None of these.
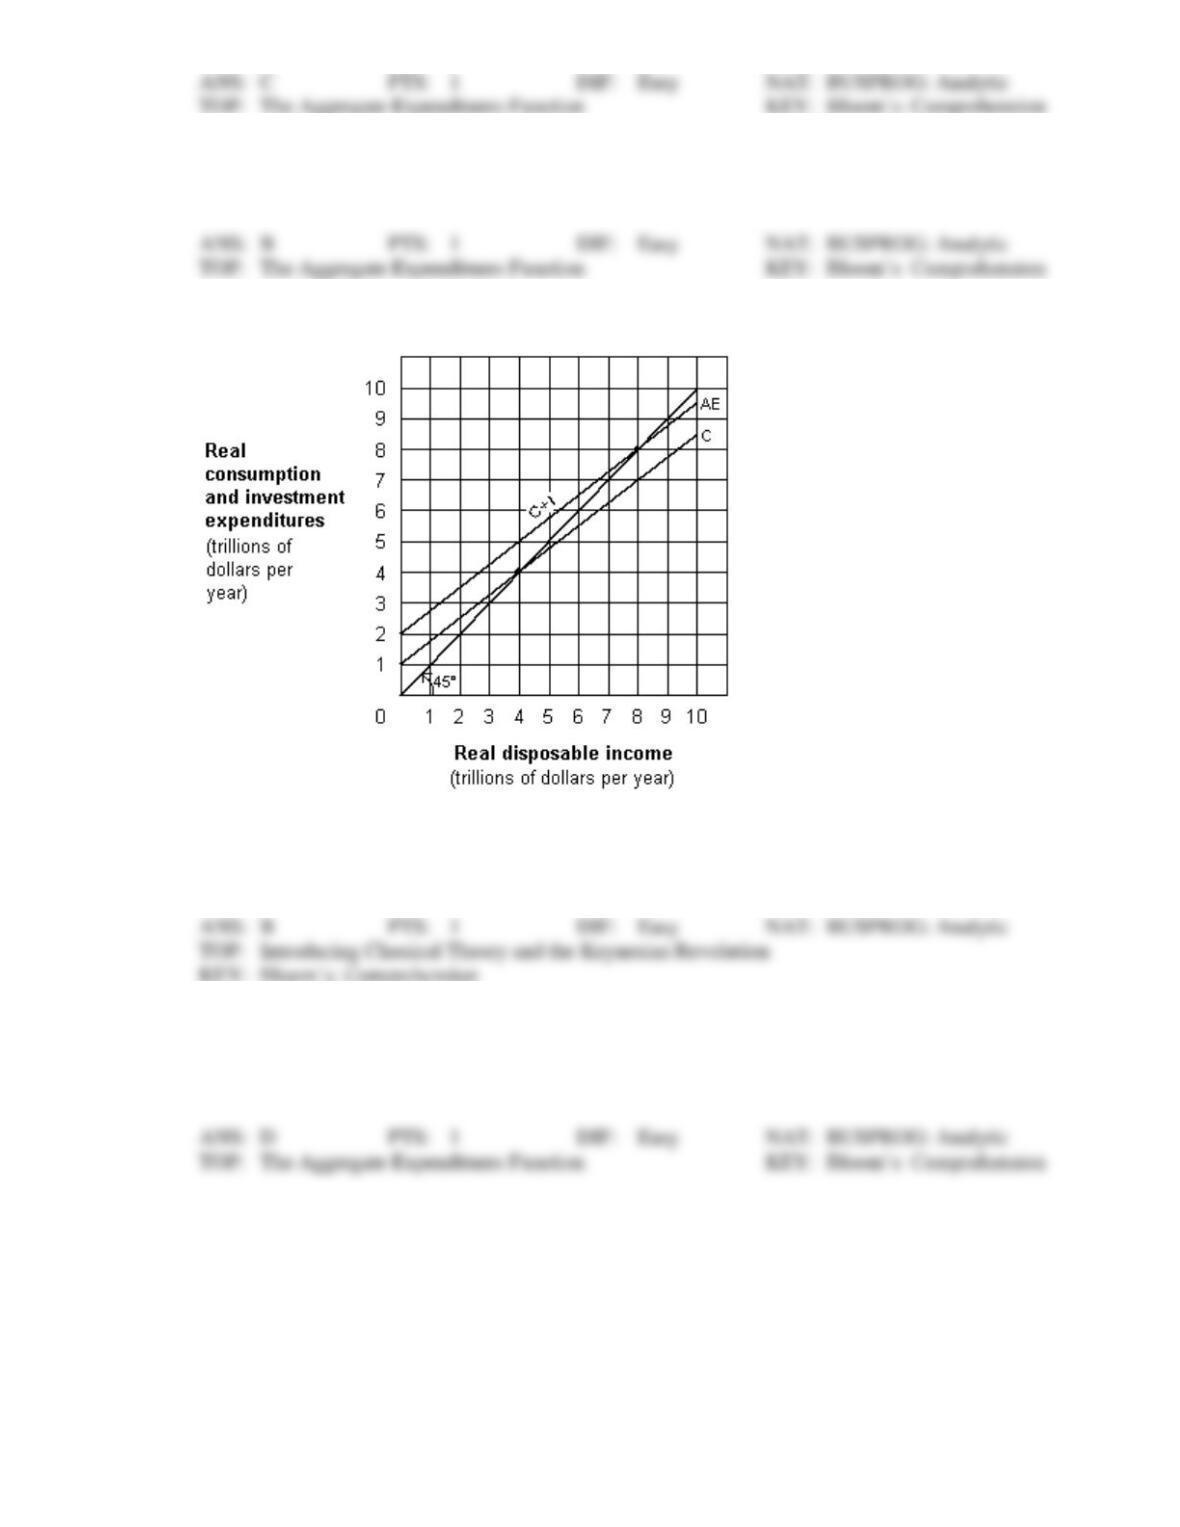
Exhibit 8-7 Aggregate expenditures function
176. In Exhibit 8-7, what is the households’ marginal propensity to consume (MPC)?
a.
0.5.
c.
0.8.
b.
0.75.
d.
1.
177. In Exhibit 8-7, aggregate income will equal consumption plus investment and the economy will be in
equilibrium when real disposable income is:
a.
$2 trillion.
c.
$6 trillion.
b.
$4 trillion
d.
$8 trillion.
Exhibit 8-8 Aggregate expenditures function
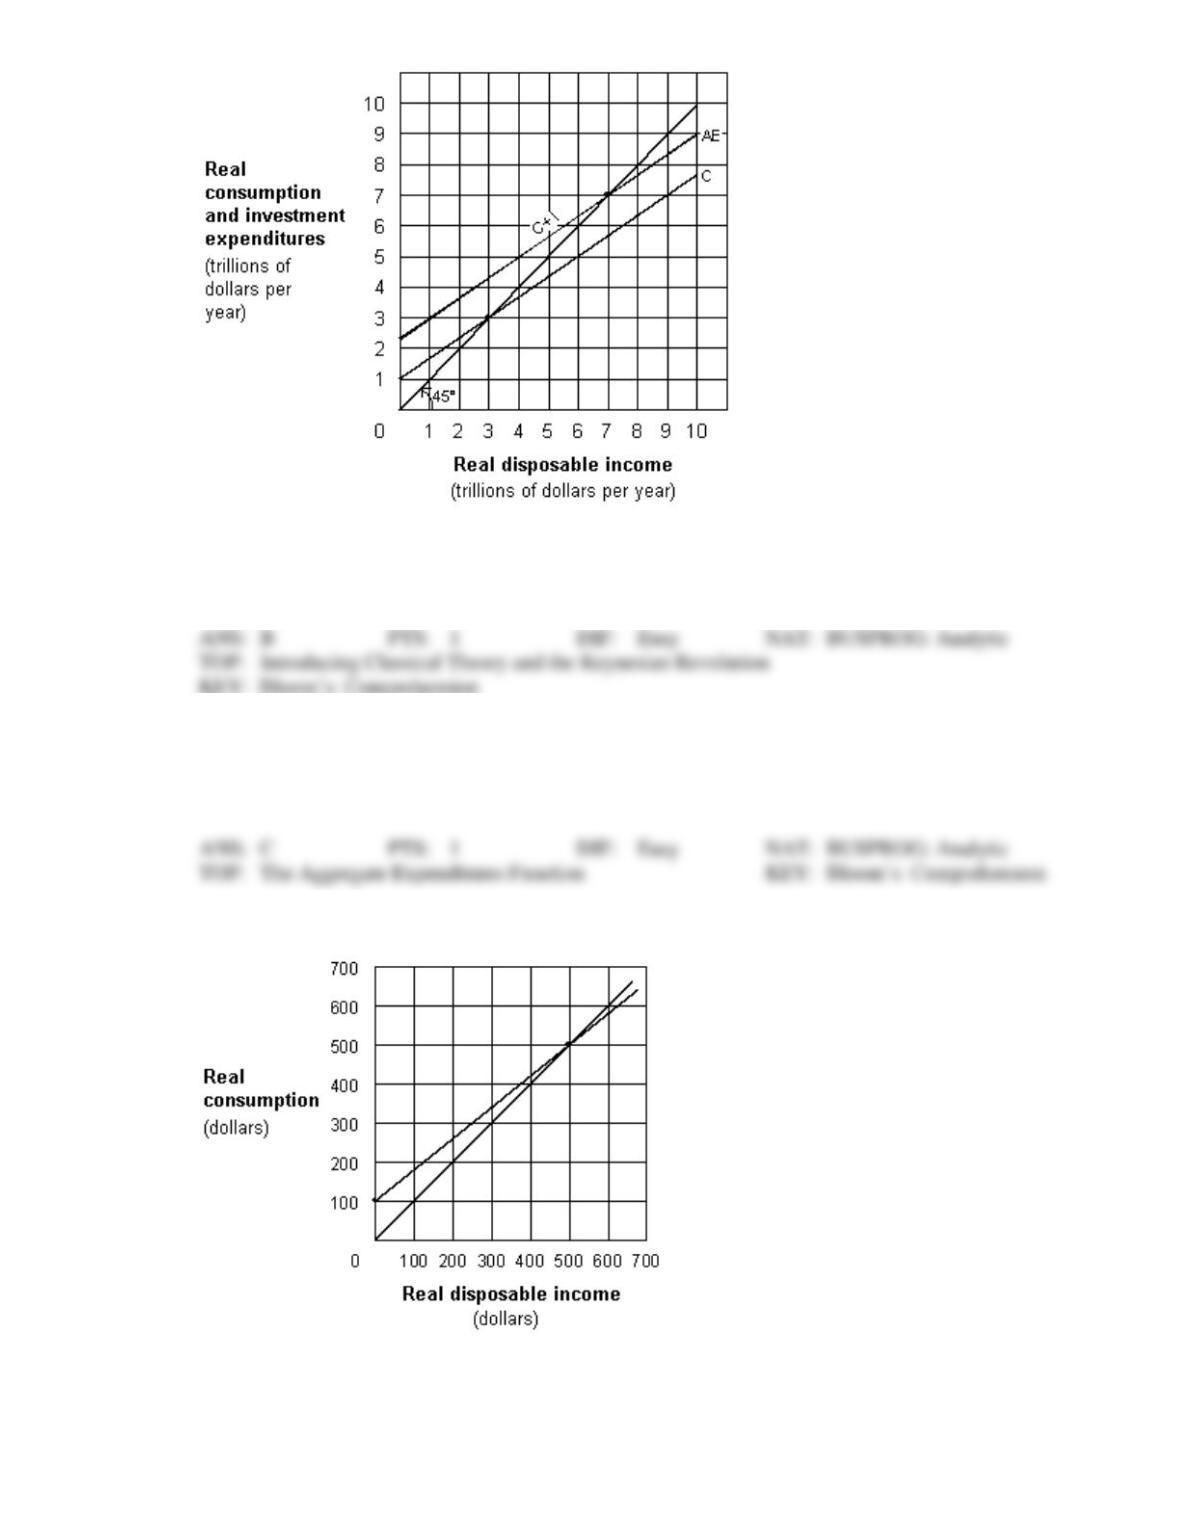
178. In Exhibit 8-8, what is the households’ marginal propensity to consume (MPC)?
a.
0.5.
c.
0.75.
b.
0.67.
d.
0.80.
179. In Exhibit 8-8, aggregate income will equal consumption plus investment and the economy will be in
equilibrium when real disposable income is:
a.
$2.33 trillion.
c.
$7 trillion.
b.
$3 trillion.
d.
$10 trillion.
Exhibit 8-9 Consumption function
180. In Exhibit 8-9, consumption and real disposable income are equal at:

a.
500.
b.
100.
c.
400.
d.
200.
e.
600.
181. In Exhibit 8-9, the level of autonomous consumption for consumption function C is:
a.
$100.
b.
$150.
c.
$50.
d.
$0.
e.
$200.
182. In Exhibit 8-9, the level of autonomous consumption is:
a.
0.
b.
$25.
c.
$50.
d.
$75.
e.
$100.
183. In Exhibit 8-9, when disposable income is equal to zero, saving is equal to:
a.
$0.
b.
$100.
c.
−$50.
d.
−$100.
e.
$50.
184. In Exhibit 8-9, when disposable income is equal to $600, saving equals:
a.
$0.
b.
$100.
c.
−$100.
d.
$50.
e.
$20.
185. In Exhibit 8-9, the value of the marginal propensity to consume is:
a.
.75.
b.
.80.
c.
.50.
d.
.25.
e.
.20.
186. In Exhibit 8-9, the value of the marginal propensity to save is:
a.
.50.
b.
.25.
c.
.20.
d.
.80.
e.
.75.
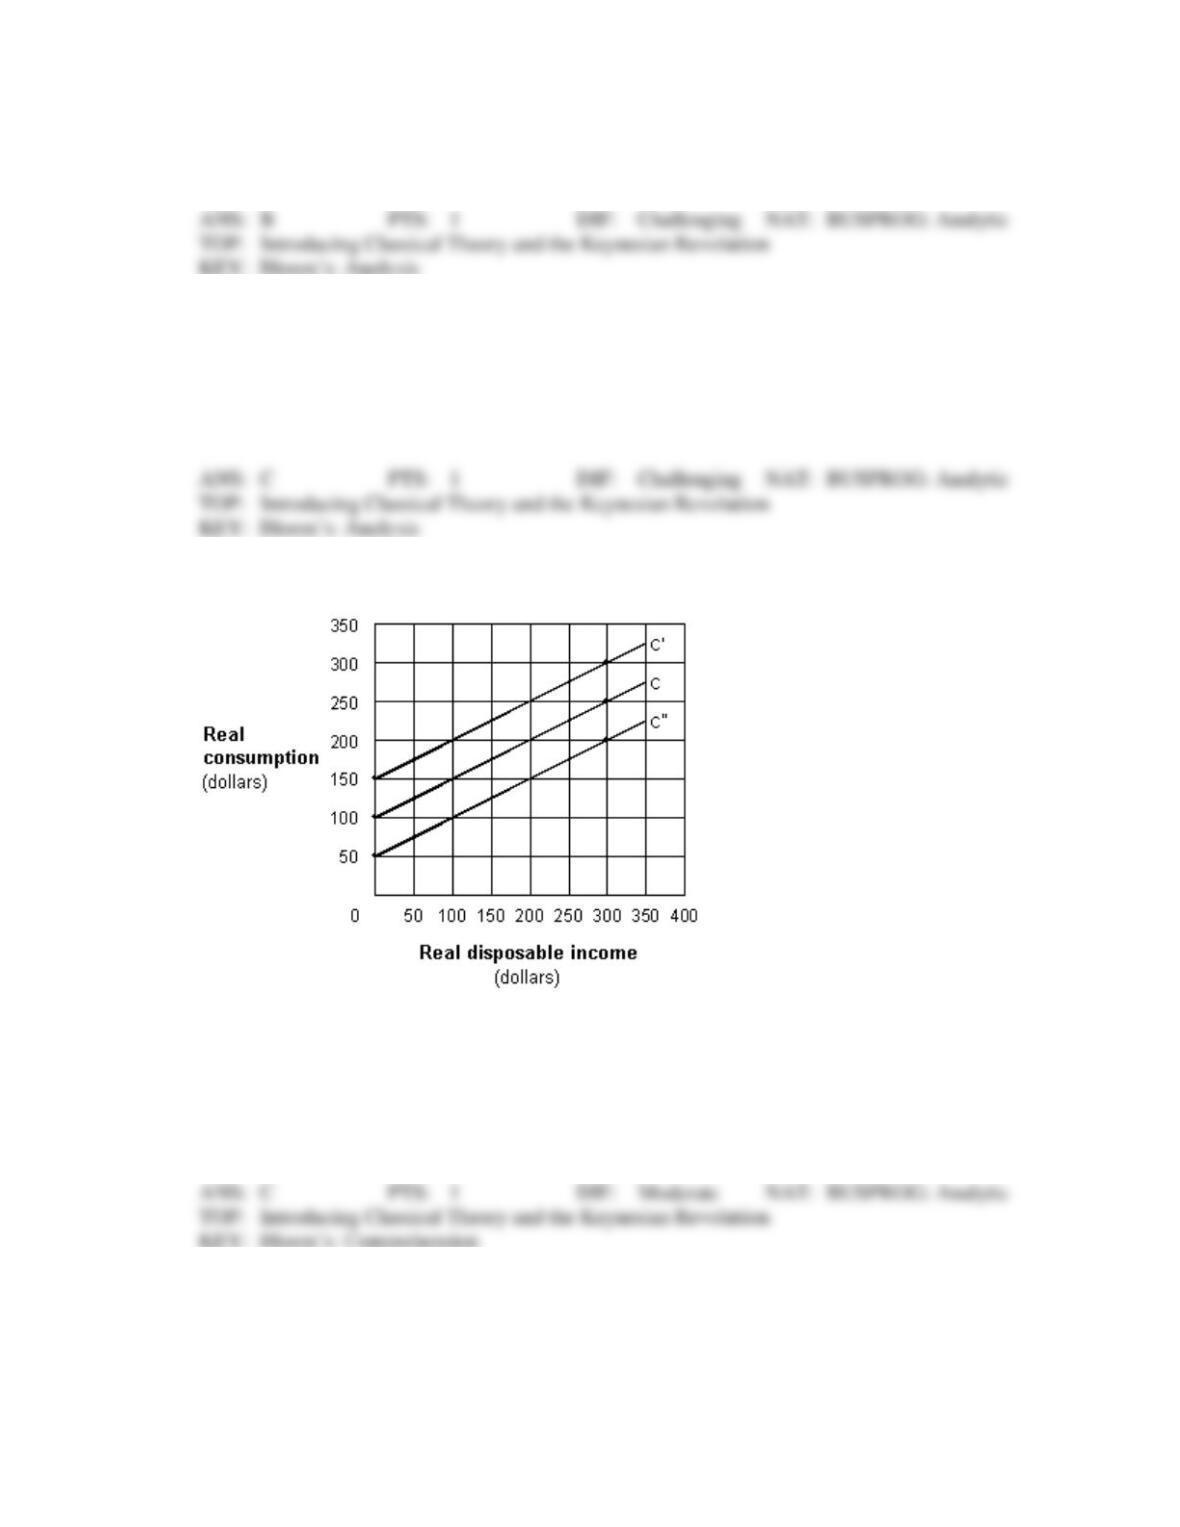
Exhibit 8-10 Consumption function
187. In Exhibit 8-10, the level of autonomous consumption for C’ is:
a.
$50.
b.
$100.
c.
$150.
d.
$200.
e.
$0.
188. In Exhibit 8-10, the value of the marginal propensity to consume is:
a.
high for C’ than for C.
c.
lower for C” than for C’.
b.
lower for C” than for C.
d.
the same for C, C’, and C”.
189. In Exhibit 8-10, the shift from C to C‘ could be caused by a(n):
a.
increase in disposable income.
b.
expectation of inflation.
c.
increase in interest rates.
d.
increase in the level of saving.
e.
decrease in household wealth.
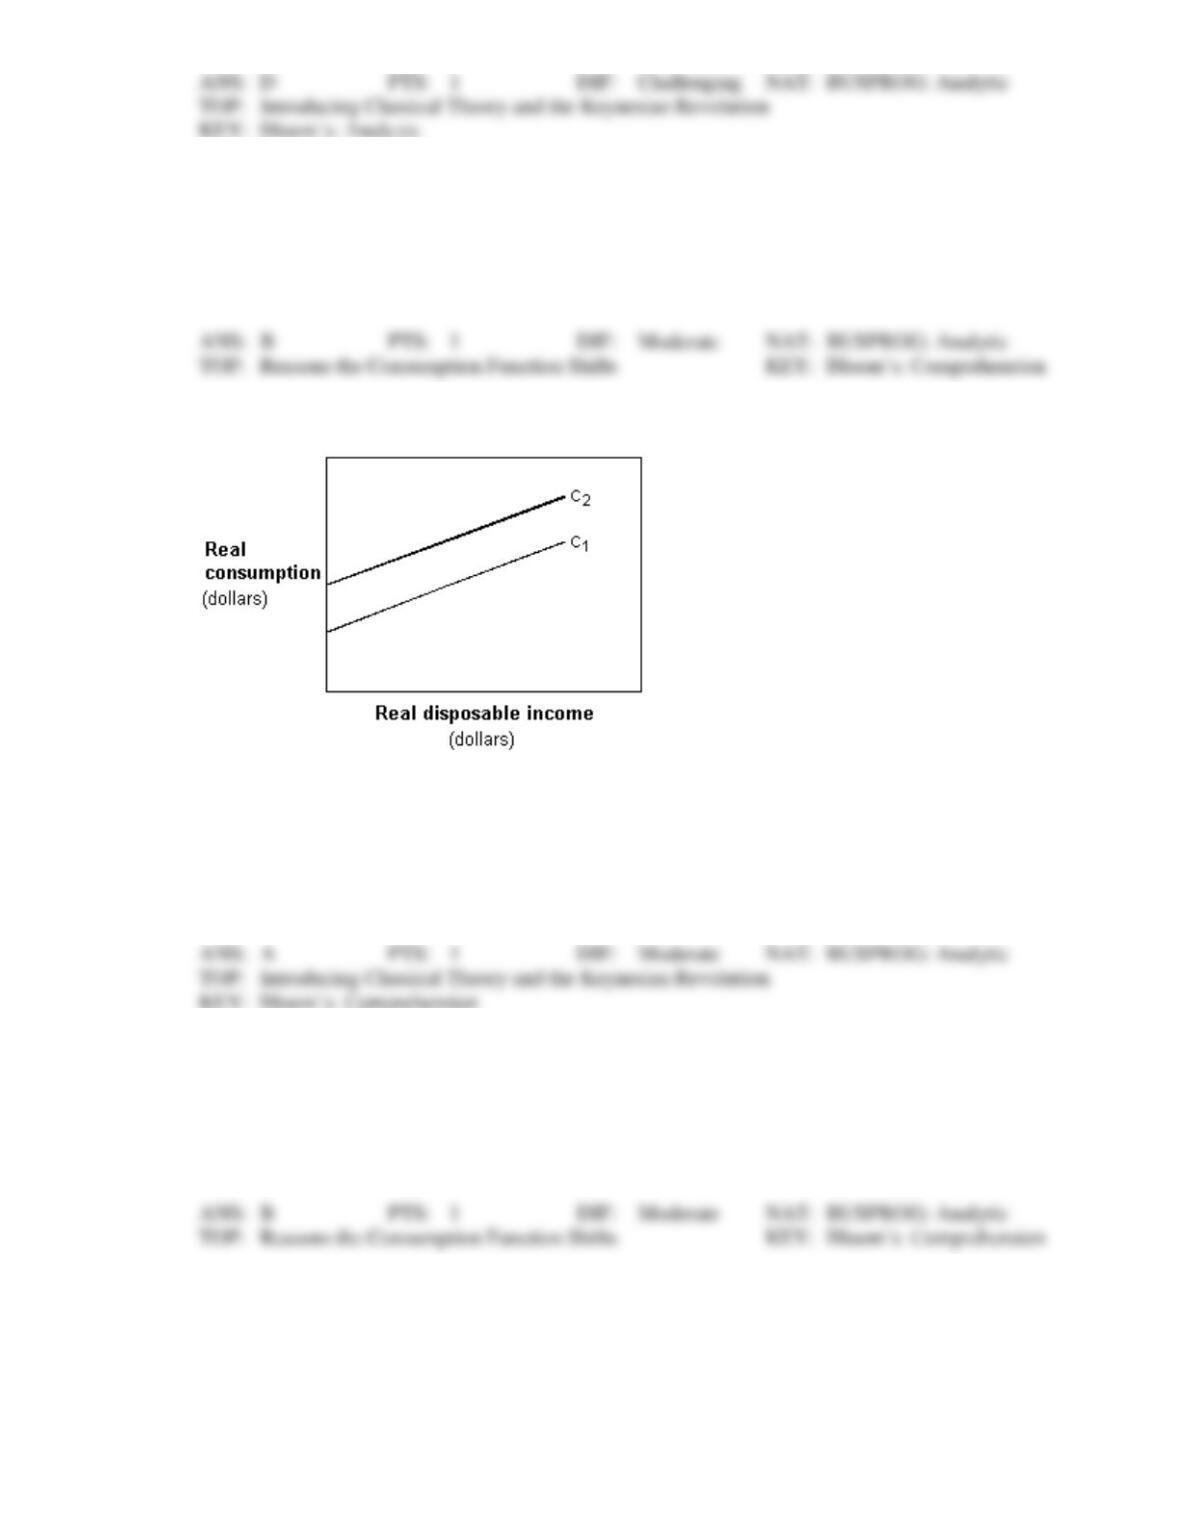
Exhibit 8-11 Consumption function
190. In Exhibit 8-11, which of the following could cause the movement from C1 to C2?
a.
Higher wealth.
b.
Higher interest rates.
c.
Higher taxes.
d.
A technological breakthrough.
e.
Expectations of future economic growth.
191. In Exhibit 8-11, which of the following could cause the movement from C1 to C2?
a.
A decrease in real asset holdings.
b.
Lower interest rates.
c.
Expectations that the economy will grow.
d.
Expectations of lower future prices.
e.
Lower money holdings.
Exhibit 8-12 Investment expenditures
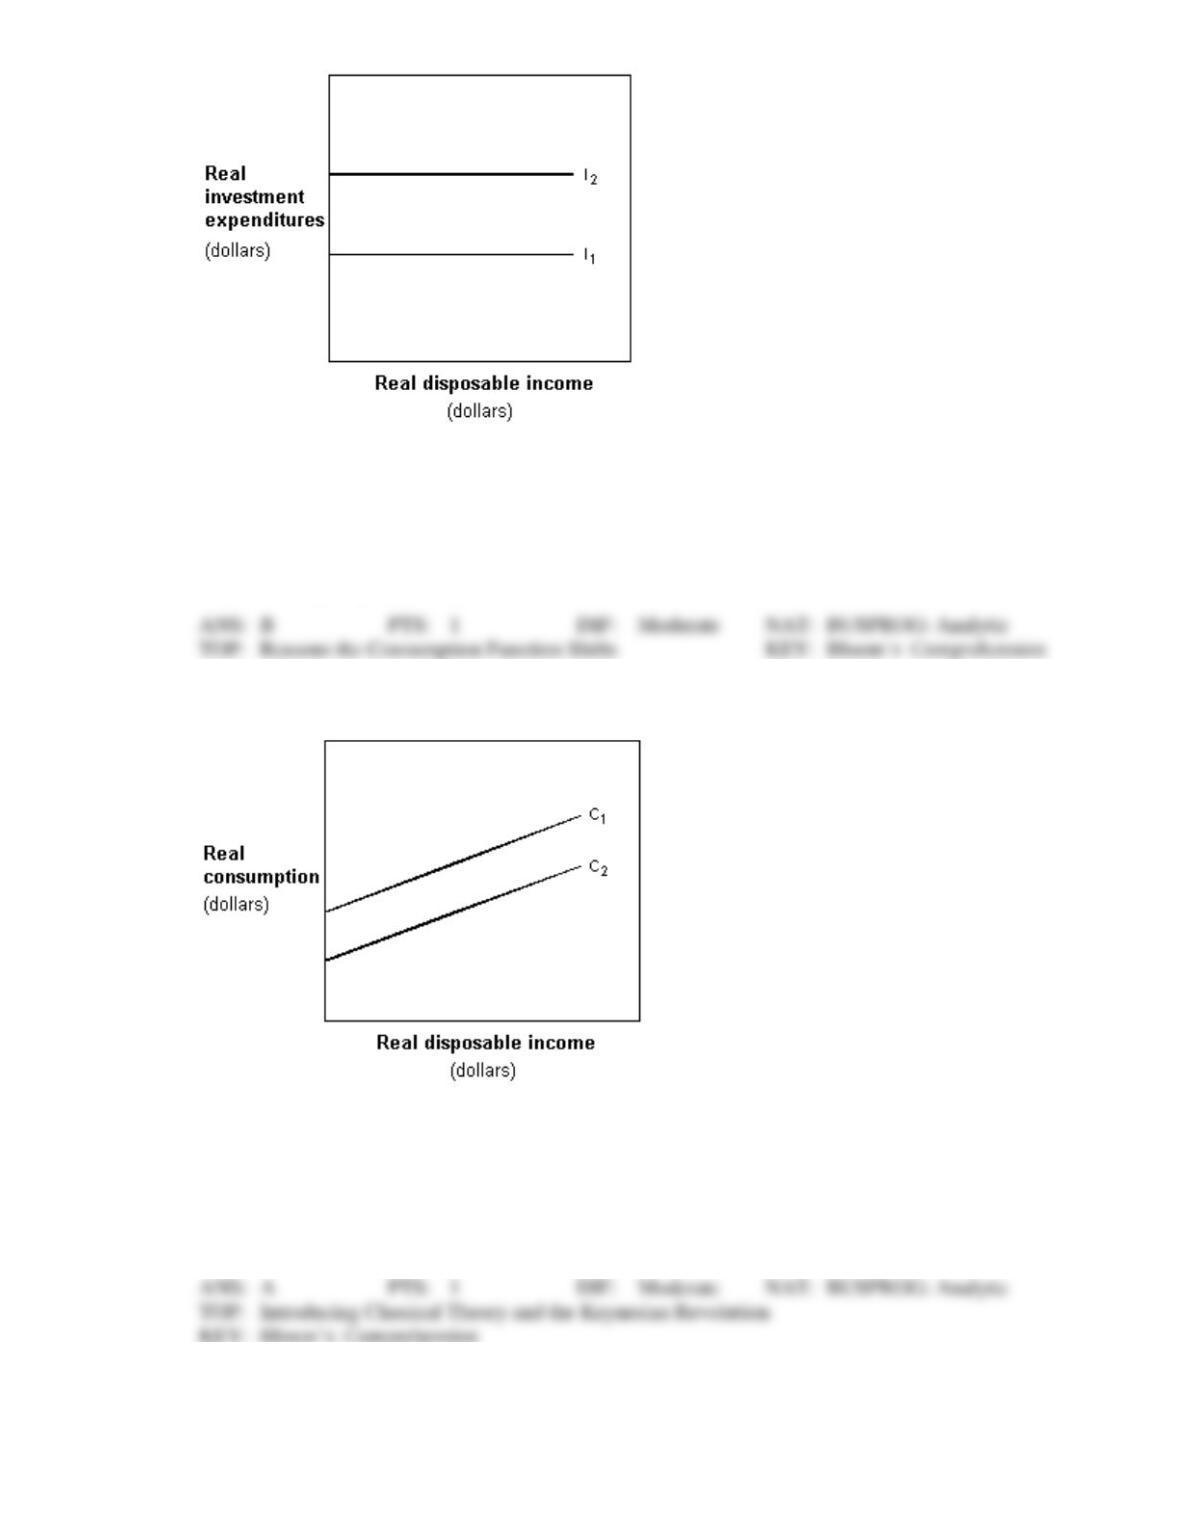
192. In Exhibit 8-12, which of the following could cause the shift from I1 to I2?
a.
Lower money holdings.
b.
Lower interest rates.
c.
Expectations of a future economic slow-down.
d.
Lower disposable income.
e.
Lower capacity utilization.
Exhibit 8-13 Consumption function
193. In Exhibit 8-13, which of the following could cause the shift from C1 to C2?
a.
Higher interest rates.
b.
An increase in disposable income.
c.
A decrease in disposable income.
d.
Lower tax rates.
e.
Expectations of future economic growth.
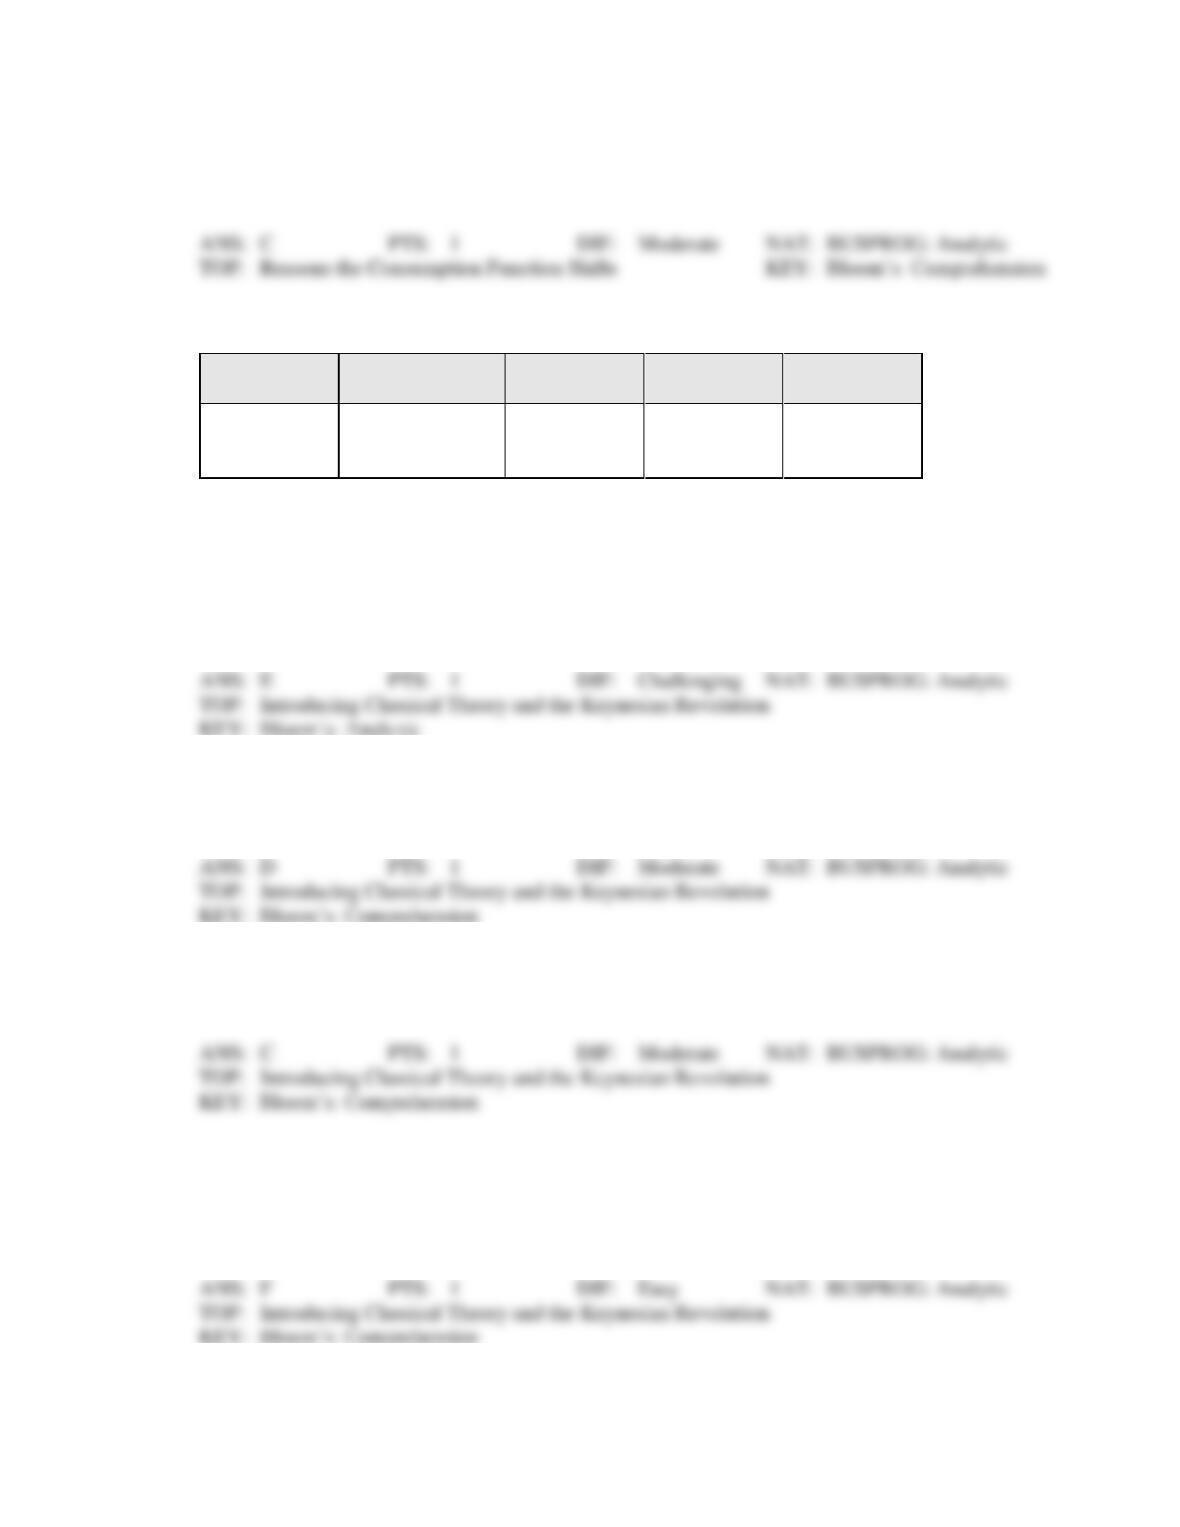
194. In Exhibit 8-13, which of the following could cause the shift from C1 to C2?
a.
An increase in disposable income.
b.
A decrease in disposable income.
c.
Legislation tightening credit availability.
d.
Legislation lowering tax rates.
e.
Lower capacity utilization rates.
Exhibit 8-14 Disposable income and consumption data
Disposable
income (Y)
Consumption
(C)
MPC
MPS
Saving
$5,000
$4,750
$6,000
$5,500
$7,000
195. In Exhibit 8-14, when disposable income is $7,000, then saving will equal:
a.
$2,500.00.
b.
$1,750.00.
c.
$1,562.50.
d.
$1,250.00.
e.
$750.00.
196. In Exhibit 8-14, the MPC when Y increases from $5,000 to $6,000 is:
a.
0.20.
c.
0.25.
b.
0.80.
d.
0.75.
197. In Exhibit 8-14, the MPS when Y increases from $5,000 to $6,000 is:
a.
0.20.
c.
0.25.
b.
0.80.
d.
0.75.
TRUE/FALSE
1. Keynes argued that the economy naturally achieves full employment because supply creates its own
demand.
2. The Keynesian theory focuses on aggregate supply, while the classical theory focused on aggregate
demand.
3. The consumption function has a negative slope.
4. If autonomous consumption is greater than zero and the marginal propensity to consume is greater than
zero, but less than one, the consumption function will first be above and then below the 45 degree line.
5. The consumption function has a positive slope.
6. If autonomous consumption is greater than zero and the marginal propensity to consume is greater than
zero, but less than one, the consumption function will first be below and then above the 45 degree line.
7. Real disposable income is held constant when constructing a consumption function.
8. The vertical intercept of the consumption function is used to determine the break-even level of real
disposable income.
9. In the Keynesian model, investment spending is an autonomous expenditure.
10. Saving is disposable personal income not spent on consumption.
11. Saving is disposable personal income spent on investment.
12. The marginal propensity to consume (MPC) is the change in consumption divided by the change in
disposable personal income.
13. The marginal propensity to consume (MPC) is the change in consumption divided by the change in
saving.
14. If consumption is $800 when disposable income is $1,000, the marginal propensity to consume (MPC)
must be 0.80.
15. The marginal propensity to save plus the marginal propensity to consume always equals 1.
16. If people become pessimistic about the state of the economy, the consumption function shifts
downward.
17. An increase in consumer wealth shifts the consumption function downward.
18. If people become pessimistic about the state of the economy, the consumption function shifts upward.
19. An increase in consumer wealth shifts the consumption function upward.
20. Real investment spending for the past 35 years is less volatile than real personal consumption.
21. An increase in the interest rate will stimulate firms’ investment spending.
22. Real investment spending for the past 35 years is more volatile than real personal consumption.
23. A shift in the investment demand curve can be caused by a change in the expectations of profits by
businessmen.
24. If firms increase investment, the aggregate expenditures function will shift upward, other things being
equal.
ESSAY
1. Explain why the marginal propensity to save and the marginal propensity to consume sum to 1.
2. \What are the marginal propensity to consume (MPC) and the marginal propensity to save (MPS)?
How is the MPC related to the consumption function?
3. Explain how changes in wealth, the price level, interest rates, and expectations alter the consumption
curve.
4. Explain how a decrease in the interest rate will affect investment.
5. Describe the relationship between investment and the level of disposable income.