Application: The Costs of Taxation 2011
38. If T represents the size of the tax on a good and Q represents the quantity of the good that is
sold, total tax revenue received by government can be expressed as
a. T/Q.
b. T+Q.
c. TxQ.
d. (TxQ)/Q.
39. When a tax is levied on buyers, the
a. supply curves shifts upward by the amount of the tax.
b. tax creates a wedge between the price buyers effectively pay and the price sellers receive.
c. tax has no effect on the well-being of sellers.
d. All of the above are correct.
2012 Application: The Costs of Taxation
40. For the purpose of analyzing the gains and losses from a tax on a good, we use tax revenue as a
direct measure of the
a. government‘s benefit from the tax.
b. government’s loss from the tax.
c. deadweight loss of the tax.
d. overall net gain to society of the tax.
41. The decrease in total surplus that results from a market distortion, such as a tax, is called a
a. wedge loss.
b. revenue loss.
c. deadweight loss.
d. consumer surplus loss.
Application: The Costs of Taxation 2013
42. A tax on a good
a. gives buyers an incentive to buy less of the good than they otherwise would buy.
b. gives sellers an incentive to produce more of the good than they otherwise would produce.
c. creates a benefit to the government, the size of which exceeds the loss in surplus to buyers and
sellers.
d. All of the above are correct.
43. When the price of a good is measured in dollars, then the size of the deadweight loss that results
from taxing that good is measured in
a. units of the good that is being taxed.
b. units of a related good that is not being taxed.
c. dollars.
d. percentage change.
2014 Application: The Costs of Taxation
44. When the government places a tax on a product, the cost of the tax to buyers and sellers
a. is less than the revenue raised from the tax by the government.
b. is equal to the revenue raised from the tax by the government.
c. exceeds the revenue raised from the tax by the government.
d. Without additional information, such as the elasticity of demand for this product, it is impossible
to compare the cost of a tax to buyers and sellers with tax revenue.
45. Relative to a situation in which gasoline is not taxed, the imposition of a tax on gasoline causes the
quantity of gasoline demanded to
a. decrease and the quantity of gasoline supplied to decrease.
b. decrease and the quantity of gasoline supplied to increase.
c. increase and the quantity of gasoline supplied to decrease.
d. increase and the quantity of gasoline supplied to increase.
Application: The Costs of Taxation 2015
46. Which of the following quantities decrease in response to a tax on a good?
a. the equilibrium quantity in the market for the good, the effective price of the good paid by
buyers, and consumer surplus
b. the equilibrium quantity in the market for the good, producer surplus, and the well-being of
buyers of the good
c. the effective price received by sellers of the good, the wedge between the effective price paid
by buyers and the effective price received by sellers, and consumer surplus
d. None of the above is necessarily correct unless we know whether the tax is levied on buyers
or on sellers.
47. For a good that is taxed, the area on the relevant supply-and-demand graph that represents
government’s tax revenue is a
a. triangle.
b. rectangle.
c. trapezoid.
d. None of the above is correct; government’s tax revenue is the area between the supply and
demand curves, above the horizontal axis, and below the effective price to buyers
2016 Application: The Costs of Taxation
48. For a good that is taxed, the area on the relevant supply-and-demand graph that represents
government’s tax revenue is
a. smaller than the area that represents the loss of consumer surplus and producer surplus caused
by the tax.
b. bounded by the supply curve, the demand curve, the effective price paid by buyers, and the
effective price received by sellers.
c. a right triangle.
d. a triangle, but not necessarily a right triangle.
49. Total surplus with a tax is equal to
a. consumer surplus plus producer surplus.
b. consumer surplus minus producer surplus.
c. consumer surplus plus producer surplus minus tax revenue.
d. consumer surplus plus producer surplus plus tax revenue.
Application: The Costs of Taxation 2017
50. Taxes cause deadweight losses because they
a. lead to losses in surplus for consumers and for producers that, when taken together, exceed tax
revenue collected by the government.
b. distort incentives to both buyers and sellers.
c. prevent buyers and sellers from realizing some of the gains from trade.
d. All of the above are correct.
51. Taxes cause deadweight losses because taxes
a. reduce the sum of producer and consumer surpluses by more than the amount of tax revenue.
b. prevent buyers and sellers from realizing some of the gains from trade.
c. cause marginal buyers and marginal sellers to leave the market, causing the quantity sold to
fall.
d. All of the above are correct.
2018 Application: The Costs of Taxation
52. Deadweight loss measures the loss
a. in a market to buyers and sellers that is not offset by an increase in government revenue.
b. in revenue to the government when buyers choose to buy less of the product because of the
tax.
c. of equality in a market due to government intervention.
d. of total revenue to business firms due to the price wedge caused by the tax.
53. The loss in total surplus resulting from a tax is called
a. a deficit.
b. economic loss.
c. deadweight loss.
d. inefficiency.
Application: The Costs of Taxation 2019
54. Deadweight loss is the
a. decline in total surplus that results from a tax.
b. decline in government revenue when taxes are reduced in a market.
c. decline in consumer surplus when a tax is placed on buyers.
d. loss of profits to business firms when a tax is imposed.
55. A deadweight loss is a consequence of a tax on a good because the tax
a. induces the government to increase its expenditures.
b. induces buyers to consume less, and sellers to produce less.
c. increases the equilibrium price in the market.
d. imposes a loss on buyers that is greater than the loss to sellers.
2020 Application: The Costs of Taxation
56. The supply curve for motor oil is the typical upward-sloping straight line, and the demand curve for
motor oil is the typical downward-sloping straight line. When motor oil is taxed, the area on the
relevant supply–and-demand graph that represents the deadweight loss is
a. larger than the area that represents consumer surplus in the absence of the tax.
b. larger than the area that represents government’s tax revenue.
c. a triangle.
d. All of the above are correct.
57. The supply curve for whiskey is the typical upward–sloping straight line, and the demand curve for
whiskey is the typical downward–sloping straight line. When whiskey is taxed, the area on the
relevant supply–and-demand graph that represents
a. government’s tax revenue is a rectangle.
b. the deadweight loss of the tax is a triangle.
c. the loss of consumer surplus caused by the tax is neither a rectangle nor a triangle.
d. All of the above are correct.
Application: The Costs of Taxation 2021
58. For widgets, the supply curve is the typical upward-sloping straight line, and the demand curve is
the typical downward-sloping straight line. A tax of $15 per unit is imposed on widgets. The tax
reduces the equilibrium quantity in the market by 300 units. The deadweight loss from the tax is
a. $1,750.
b. $2,250.
c. $3,000.
d. $4,500.
59. In the market for widgets, the supply curve is the typical upward-sloping straight line, and the
demand curve is the typical downward–sloping straight line. The equilibrium quantity in the market
for widgets is 200 per month when there is no tax. Then a tax of $5 per widget is imposed. As a
result, the government is able to raise $800 per month in tax revenue. We can conclude that the
equilibrium quantity of widgets has fallen by
a. 40 per month.
b. 50 per month.
c. 75 per month.
d. 100 per month.
2022 Application: The Costs of Taxation
60. In the market for widgets, the supply curve is the typical upward-sloping straight line, and the
demand curve is the typical downward-sloping straight line. The equilibrium quantity in the market
for widgets is 250 per month when there is no tax. Then a tax of $6 per widget is imposed. As a
result, the government is able to raise $750 per month in tax revenue. We can conclude that the
after-tax quantity of widgets is
a. 75 per month.
b. 100 per month.
c. 125 per month.
d. 150 per month.
61. In the market for widgets, the supply curve is the typical upward-sloping straight line, and the
demand curve is the typical downward-sloping straight line. The equilibrium quantity in the market
for widgets is 200 per month when there is no tax. Then a tax of $5 per widget is imposed. The
price paid by buyers increases by $2 and the after-tax price received by sellers falls by $3. The
government is able to raise $750 per month in revenue from the tax. The deadweight loss from the
tax is
a. $250.
b. $125.
c. $75.
d. $50.
Application: The Costs of Taxation 2023
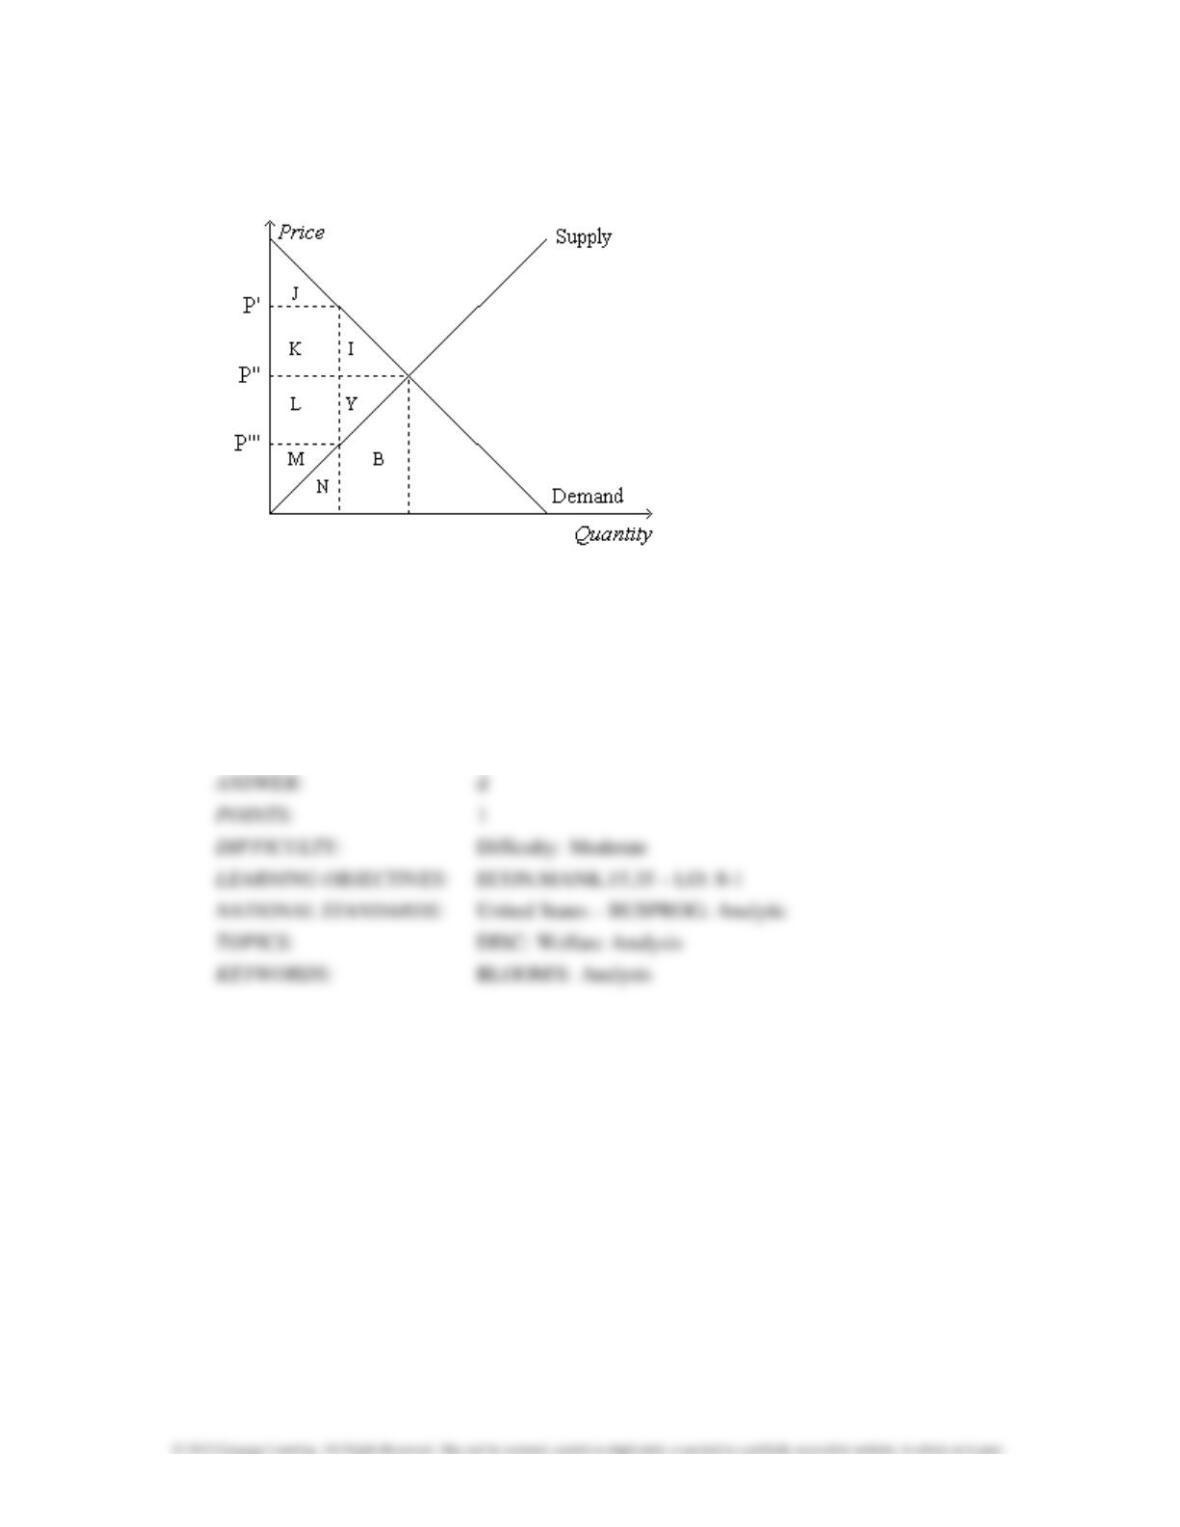
Figure 8-1
62. Refer to Figure 8-1. Suppose the government imposes a tax of P’ – P”’. Total surplus before the
tax is measured by the area
a. I+Y.
b. J+K+L+M.
c. L+M+Y.
d. I+J+K+L+M+Y.

2024 Application: The Costs of Taxation
63. Refer to Figure 8-1. Suppose the government imposes a tax of P’ – P”’. The area measured by
I+J+K+L+M+Y represents
a. total surplus before the tax.
b. total surplus after the tax.
c. consumer surplus before the tax.
d. deadweight loss from the tax.
64. Refer to Figure 8-1. Suppose the government imposes a tax of P’ – P”’. Total surplus after the
tax is measured by the area
a. I+Y.
b. J+K+L+M.
c. I+Y+B.
d. I+J+K+L+M+Y.

Application: The Costs of Taxation 2025
65. Refer to Figure 8-1. Suppose the government imposes a tax of P’ – P”’. The area measured by
J+K+L+M represents
a. total surplus after the tax.
b. total surplus before the tax.
c. deadweight loss from the tax.
d. tax revenue.
66. Refer to Figure 8-1. Suppose the government imposes a tax of P’ – P”’. The area measured by
K+L represents
a. tax revenue.
b. consumer surplus before the tax.
c. producer surplus after the tax.
d. total surplus before the tax.
2026 Application: The Costs of Taxation
67. Refer to Figure 8-1. Suppose the government imposes a tax of P’ – P”’. The tax revenue is
measured by the area
a. K+L.
b. I+Y.
c. J+K+L+M.
d. I+J+K+L+M+Y.
68. Refer to Figure 8-1. Suppose the government imposes a tax of P’ – P”’. The area measured by
L+M+Y represents
a. consumer surplus after the tax.
b. consumer surplus before the tax.
c. producer surplus after the tax.
d. producer surplus before the tax.

Application: The Costs of Taxation 2027
69. Refer to Figure 8-1. Suppose the government imposes a tax of P’ – P”’. The producer surplus
before the tax is measured by the area
a. I+J+K.
b. I+Y.
c. L+M+Y.
d. M.
70. Refer to Figure 8-1. Suppose the government imposes a tax of P’ – P”’. The area measured by
M represents
a. consumer surplus after the tax.
b. consumer surplus before the tax.
c. producer surplus after the tax.
d. producer surplus before the tax.
2028 Application: The Costs of Taxation
71. Refer to Figure 8-1. Suppose the government imposes a tax of P’ – P”’. The producer surplus
after the tax is measured by the area
a. M.
b. L+M+N+Y+B.
c. L+M+Y.
d. J.
72. Refer to Figure 8-1. Suppose the government imposes a tax of P’ – P”’. The area measured by
J+K+I represents
a. consumer surplus after the tax.
b. consumer surplus before the tax.
c. producer surplus after the tax.
d. producer surplus before the tax.
Application: The Costs of Taxation 2029
73. Refer to Figure 8-1. Suppose the government imposes a tax of P’ – P”’. The consumer surplus
before the tax is measured by the area
a. M.
b. L+M+Y.
c. J.
d. J+K+I.
74. Refer to Figure 8-1. Suppose the government imposes a tax of P’ – P”’. The area measured by
J represents
a. consumer surplus after the tax.
b. consumer surplus before the tax.
c. producer surplus after the tax.
d. producer surplus before the tax.
2030 Application: The Costs of Taxation
75. Refer to Figure 8-1. Suppose the government imposes a tax of P’ – P”’. The consumer surplus
after the tax is measured by the area
a. J+K+I.
b. J.
c. M.
d. L+M+Y.
76. Refer to Figure 8-1. Suppose the government imposes a tax of P’ – P”’. The area measured by
I+Y represents the
a. deadweight loss due to the tax.
b. loss in consumer surplus due to the tax.
c. loss in producer surplus due to the tax.
d. total surplus before the tax.