
1
Chapter 8 Correlational research
Suggested Activities and Resources
1. Many students don’t understand what a correlation is or means. Prior to addressing Chapter 8
2. To understand simple correlation conceptually, Glover, Ronning, and Bruning (1990) text (p.
109) presents correlations from the literature on correlations on intelligence tests related to
genetics and environmental influences. I have used this a conceptual example of correlation for
years and it always works very well. Among other numbers, they provide the following
correlations: identical twins reared together (.90), identical twins reared separately (.74),
heterozygotic twins of same sex reared together (.60), heterozygotic twins of different sex reared
3. A recent topic of interest to many students is the relationship between teacher behaviors and
increased standardized testing. Most in my classes suggest that teachers’ behaviors have changed
under NCLB. For this activity, have students work with a peer to generate several correlational
research questions related to the topic. Request that students generate examples of two variable
possibilities, as well as prediction possibilities or path models with multiple variables. The
examples below can be used to start the activity. Students generally get engaged with this topic
and generate several examples.
Is there a relationship between assigned homework and standardized mathematics scores?
Is there a correlation between amount of writing practice done with sample items and writing
standardized test scores?
Does professional development, years of teaching the same grade, or SES of the school’s students
best predict third grade reading test scores?
4. In order to understand correlational studies, one successful example of a criterion variable is
retention or college student persistence. Start with a large Venn diagram on the board and have
students generate with you the potential variables that might predict college students’ inclination
(or ability) to remain enrolled in post-secondary education. Make a list of all of the variables and

2
Peltier, G. L., Laden, R., & Matranga, M. (1999). Student persistence in college: A review of
research. Journal of College Student Retention, 1, 357-375.
5. Including some examples of path analysis models and SEM models is also a good idea. Students
don’t inherently understand how to read and interpret a path or structural equation model.
Further, much of the published research they will encounter uses these techniques. Two
examples to use related to the above activity are:
Both introduce prediction models on topics related to the persistence exercise above.
7. In recent classes in which I have focused on prediction studies I have spent time addressing the
extant databases available. As mentioned generally in other activities, extant databases may
8. Based upon my experiences with advanced undergraduate and early graduate students, complete
conceptual understanding of relationship studies and prediction research is best supported by
graphical representations. Providing blank representations really helps students. This can be done
on the board with students noting the representations in their notes. Venn Diagrams work best for
regression models, and I use essentially blank models and have students fill in the variables on
representations for path analysis and Structural Equation Modeling. I have also used a
hierarchical framework with subordinate blanks to illustrate factor structures. A portion of the
students seem to benefit in increased conceptual understanding from the use of graphic
representations for correlational analysis and prediction studies.
9. I have recommended this activity in previous editions but I find it still is of interest to students.
Another area of research that addresses correlational relationships, but uses various modeling
techniques, is the area of academic self-concept as related to achievement. This topic is a good one
to use when you have a large range of prior knowledge and interests in a class, because, for
example, the more knowledgeable and able students will be very interested in the analysis
strategies and interpreting the models; while the students who are just being introduced to research
will ‘get’ the research question being asked. The topic lends itself well to discussion about
3
reciprocal relationships in educational research and also to causal ordering and structural
modeling.
The fundamental question is the relationship between academic self-concept and achievement and
the ordering of the relationship. Of course, those students who are high achievers also often have
high academic self-concept. Therefore, higher academic self-concept is related to higher
achievement. Is there a causal relationship between these variables? Does academic achievement
lead to higher self-concept? Does higher academic self-concept lead to higher achievement?
Through discussion with the class it becomes apparent that it could be either way—or both!
To facilitate discussion and introduce students to both the topic and causal ordering through
models, Herbert Marsh’s work stands out as a great foundation. I have provided some of the best
references from the last 15 years below. The arguments in his work are laid out for novices and
the analyses provided will make even the most advanced student interested. For this exercise I
have used a JIGSAW cooperative learning technique that works well. I have stratified my students
This activity does take a little class time but students enjoy it and the cooperative nature of the
activity allows for more hands-on time with correlational research. One of the strengths of this
activity is that peers act as scaffolds and provide support for each other in reading and interpreting
research.
Guay, F., Marsh, H., Boivin, M. (2003). Academic self-concept and academic achievement:
Developmental perspectives on their causal ordering. Journal of Educational Psychology, 95(1),
124-136.
Other related articles include
Helmke, A., van Aken, M. (1995). The causal ordering of academic achievement and self-
concept of ability during elementary school: A longitudinal study. Journal of Educational
Psychology, 87(4), 624-637.

4
Marsh, H. W., Hau, K. T., Kong, C. K. (2002). Multilevel causal ordering of academic self–
concept and achievement: Influence of language of instruction (English compared to Chinese)
for Hong Kong students. American Educational Research Journal, 39(3), 727-763.

5
Chapter 8 Test Items
1. Correlational studies are used primarily to
a. examine relationships among variables.
b. examine if differences between groups exist.
c. determine causal relationships.
d. determine if experimental treatments work.
• 2-6: For each, consider the information the correlation provides.
• 2. Joyce read a study that reported students’ age was correlated r= -.68 with
classroom management referrals. This correlation indicates as age increases,
a. classroom management referrals are about equally likely to decrease or increase.
b. classroom management referrals are more likely to decrease.
c. classroom management referrals are more likely to increase.
d. classroom management referrals are likely to remain at the same level.
• 3. Kevin’s analysis indicated that in his dataset SES was correlated r=.25 with
absenteeism. This indicates that
a. as SES increases there is a corresponding increase in absenteeism..
b. SES is moderately correlated with absenteeism.
c. SES does not predict absenteeism.
d. absenteeism is strongly correlated with SES.
• 4. Qi’s analysis indicated that for those students who took calculus in high school
and then introductory calculus in the first year of University, grades were correlated
r=.45. This indicates that high school grades and university grades are
a. strongly related.
b. independent.
c. moderately related.
d. mutually exclusive.
• 5. Suzanne reported a correlation between reading ability and math grades of r= .90
in the first grade. This correlation indicates that in Suzanne’s study
a. reading ability is strongly related to math grades.
b. reading and math grades are independent.
c. reading ability and math grades are mutually exclusive.
d. reading ability and math grades are moderately related.
• 6. Russell, a principal in a large urban district, finds a correlation of r=.72 between
number of free periods in a student’s schedule and number of discipline referrals for that
student. This correlation indicates that at his school
a. free periods and discipline referrals are independent.
b. as the number of free periods decrease the likelihood of discipline referral decreases.
c. as the number of free periods decrease the likelihood of discipline referral increases
d. free periods and discipline referrals directly correspond to one another.
6
7. According to your text, the fewest number of participants required for a correlation study
is
a. 15.
b. 30.
c. 45.
d. 60.
8. A strong negative correlation coefficient indicates that
a. two variables are not related.
b. two variables are inversely related.
c. there has been measurement error.
d. there has been calculation error
• 9. Of the following, which is most likely an example of a correlational study?
a. A study that indicated differences in GPA between ROTC and non ROTC students.
b. A study that examines organizational variables that predict retention of special
education teachers.
c. A study that examines characteristics of exchange student host families.
d. A study that examines the effect of overt displays of teacher empathy on student class
behavior.
• 10. Of the following, which is most likely an example of a correlational study?
a. A study that shares the typical symptoms of repeated sports concussions in high
school athletes.
b. A study that relates the pre- and post- concussion memory scores in a group of
athletes.
c. A study that breaks down the number of sports concussions by sport played and
number of years played.
d. A study that tests the effects of a concussion training program on number of
concussions.
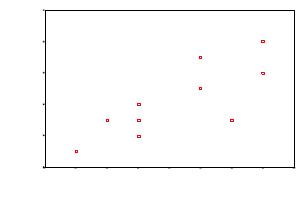
• 11. Given the graph below what is the most likely correlation between these variables?
VARX
987654321
VARY
12
10
8
6
4
2
a. -.60
b. .30
c. .80
d. 1.0
7
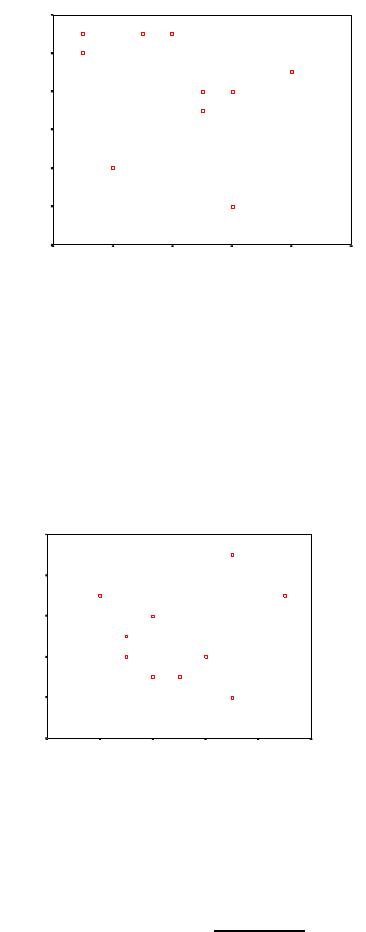
• 12. The graph below most likely represents a correlation of
VAR_X
12108642
VAR_Y
10
8
6
4
2
0
-2
a. -.30
b. 0.0
c. .40
d. .60
• 13. Which of the following correlation coefficients best represents the plot below?
VAR_X
1086420
VAR_Y
10
8
6
4
2
0
a. -.45
b. -.25
c. .15
d. .75
14. Which of the following cannot be a correlation coefficient?
a. -.80
b. 0.0
c. .72
d. 2.1
15. Which of the following demonstrates the strongest correlation coefficient?
a. 0.0
b.1.5
c. .65
d.-.72
8
16. Correlation studies must include
a. two or more levels of independent variable.
b. two or more variables and one group.
c. three or more variables and two groups.
d. one independent variable and two dependent variables.
17. Which of the following represents the strongest correlation?
a. -.85
b. 0.0
c. .35
d. .65
• 18. Given a correlation of r=.60, the common variance shared by the variables is
a. 16%.
b. 36%.
c. 60%.
d. 90%.
• 19. Given a correlation of r=.80, the common variance shared by the variables is
approximately
a. 25%
b. 40%
c. 65%
d. 80%
• 20. Paul found an internal consistency reliability coefficient of .85 for his self-esteem
measure. Paul’s instrument
a. shows high internal consistency reliability.
b. indicates acceptable internal consistency reliability.
c. indicates minimally acceptable internal consistency reliability.
d. shows poor internal consistency reliability.
• 21. Sam concluded in his research report that as class size increased teaching
efficacy also increased. Of the following which is a correlation coefficient would best
support Sam’s claim.
a. -.82
b. .09
c. .24
d. .68
• 22. The correlation that Kim found in her study between math self-efficacy and
enrollment in advanced mathematics was r=.25. Her correlation can be described as
a. low.
b. meaningful.
c. strong.
d. predictive.
9
• 23. In her prediction study of high school mathematics experiences and University
calculus performance, Kirby reported that number of courses taken was correlated r=.42
while the grades in high school mathematics courses was correlated r=.25 with university
grades. Given her findings, Kirby can conclude which of the following?
a. High school grades are a better predictor than are number of courses taken.
b. Both high school grades and number of courses taken are strong predictors.
c. Both high school grades and number of courses taken are weak predictors.
d. Number of courses taken are a better predictor than are high school grades.
24. Testing the statistical significance of a correlation requires knowledge of
a. mean, sample size, level of significance.
b. mean and level of significance.
c. level of significance and sample size.
d. sample size and mean.
• 25. In a prediction study of low achieving students academic motivation, Hillary was
surprised that achievement scores were not a significant predictor of motivation. Hillary’s
analysis is most likely is displaying
a. shrinkage.
b. attenuation.
c. standard variance.
d. restriction of range.
26. Attentuation refers to
a. stating there is not a relationship between two variables when there is one
b. lowered accuracy in a prediction equation when it is applied to a new sample.
c. combining many variables in order to predict the most amount of variance.
d. effects of unreliable instruments underestimating the correlation.
27. Shrinkage refers to
a. lowered accuracy in a prediction equation when it is applied to a new sample.
b. combining many variables in order to predict the most amount of variance.
c. effects of unreliable instruments underestimating the correlation.
d. a measure of the error found in a regression equation.
28. Errors in instrument reliability
a. do not effect interrelatedness of variables.
b. decrease the number of significant relationships found.
c. increase the number of significant relationships found.
d. may either increase of decrease the number of relationships between variables.
29. Data collection for types of correlation studies is generally
a. longer than most qualitative approaches.
b. shorter for prediction studies than for correlation studies.
c. longer than most types of quantitative research.
d. shorter than most types of quantitative research.
10
30. General guidelines for interpreting correlations in a group study as presented in your text
indicate that a correlation of r=30 is considered
a. not interpretable.
b. low and not important.
c. average but meaningful.
d. high and predictive.
31. General guidelines for interpreting correlations, in a group study, as presented in your
text indicate that a correlation of r=-.82 is considered
a. un-interpretable.
b. low.
c. average.
d. strong.
32. A Pearson r correlation is best used for data that is
a. only ordinal level.
b. both ordinal and interval level.
c. only interval level.
d. both interval and ratio.
• 33. Joni teaches a preschool class. She has eight students and ranks them based upon
math and reading ability. She would like to see if there is a relationship between how
well her students are ranked in math and in reading. Which of the following correlations
should she use?
a. Kendall’s tau
b. Phi coefficient
c. Biserial
d. eta
34. A Phi coefficient is used for
a. rank level data.
b. continuous level data.
c. artificial dichotomous level data.
d. true dichotomous level data.
• 35. Gretchen wanted to see if given a sample of teachers’ that graduated from
colleges and Universities, GPA in college was related to starting salary as a teacher.
Which correlation coefficient should Gretchen calculate?
a. Pearson r
b. eta
c. Kendall’s tau
d. Spearman rho
36. George suspects that there is a curvilinear relationship in his data set. Which of the
following correlation coefficient should George calculate?
a. Pearson
b. eta
c. Kendall’s tau
d. Spearman rho

11
37. The most commonly used correlation is the
a. Pearson r.
b. eta.
c. Kendall’s tau.
d. Spearman’s rho.
38. Regarding sampling, one strategy to facilitate obtaining accurate results if there will be
subgroup correlations would be to select a
a. stratified sample.
b. cluster sample.
c. random sample.
d. purposive sample.
39. The criterion variable in a prediction study is another name for the
a. the predictor variable.
b. the variable that is predicted.
c. the regression variable.
d. the independent variable.
40. Generally, when more variables are added to a prediction equation
a. more variance in the criterion variable is accounted for.
b. more variance in the predictor variables are accounted for.
c. less variance in the criterion variable is accounted for.
d. less variance in the predictor variable is accounted for.
41. In a single prediction question (Y=a + bX), X represents a(n)
a. predicted criterion score.
b. distribution of scores in the sample.
c. individual’s score.
d. constant calculated from the scores.
42. In a single prediction question (Y=a + bX), Y represents a(n)
a. predicted criterion score.
b. distribution of scores in the sample.
c. individual’s score.
d. constant calculated from the scores.
43. Compared to causal-comparative studies, one advantage of correlational studies in
schools is that they often
a. are more ethical.
b. require fewer participants.
c. take less time.
d. cost less.
44. The common variance shared by the predictor and criterion variables is referred to as the
a. coefficient of determination.
b. standard error of regression.
c. coefficient of regression.
d. standard error of determination.
12
45. Which of the following measures is used when the criterion variable in a prediction study
is categorical?
a. Multiple regression
b. Path analysis
c Discriminate function analysis
d. Connonical correlation
• 46. Cindy wants to use a correlational analysis to predict if individuals’ are field–
dependent or field-independent. Which of the following analysis approaches should she
use?
a. Multiple Linear Regression
b. Canonical correlation
c. Discriminate function analysis
d. Path analysis
• 47. In a large study that examines the ability of a new instrument to measure the
types of achievement motivation. Min relations of the items to one another. She has
employed which of the following analysis approaches?
a. Multiple Linear Regression
b. Factor Analysis
c. Discriminate function analysis
d. Canonical correlation
• 48.-49. Cheryl used age, education, and income to predict scores on a life satisfaction
survey. Her regression equation accounted for 58% of the variance in life satisfaction.
She collects a new sample and applies her equation.
• 48. This process is referred to as
a. discriminate testing
b. sample attenuation
c. cross-validation
d. regression reliability
• 49. In Cheryl’s second sample, the variance she accounts for will likely __________
due to __________.
a. decrease, attentuation
b. increase, replication
c. decrease, shrinkage
d. increase, regression.
50. When using correlational analysis with multiple predictors and multiple criterion
variables the appropriate procedure is
a. Multiple Linear Regression
b. Canonical correlation
c. Discriminate function analysis
d. Path analysis
13
• 51. Jack administered an achievement test with an internal consistency reliability of
.75. Given the measure, how should Jack interpret the correlation? The instrument
indicates
a. high internal consistency reliability.
b. moderate internal consistency reliability.
c. acceptable internal consistency reliability.
d. low internal consistency reliability.
• 52. A correlation between reading and math achievement scores on a national
standardized test for first graders indicates a correlation of r=.90. How much variance do
these scores share?
a. 30%
b. 45%
c. 81%
d. 90%
• 53. A study of the relationship between SES and high school completion rates
indicated a correlation of r=.60. How much variance do these two variables share?
a. 20%
b. 36%
c. 40%
d. 60%
54. When considering the use of Spearman rho or Pearson r for use with a small sample.
a. Spearman’s rho is more accurate than Pearson r
b. Spearman’s rho is easier to calculate.
c. Pearson r is the appropriate measure to use.
d. Pearson r is easier to calculate.
• 55. Barb is calculating the correlations between test items on a new version of her I
like school assessment. Of the following, which is likely a correlation coefficient for her
to use?
a. Kendall’s tau
b. Spearman’s rho
c. Correlation ratio
d. Phi coefficient
• 56. Which of the following illustrates a correlational research topic?
a. Do weight and number of days per week of exercise predict life satisfaction?
b. Are there differences between men and women in life satisfaction?
c. What are is someone with a high life satisfaction score like?
d. Are there self-esteem differences in children from either families with or without high
life satisfaction?
14
• 57.-58. Duffy’s research addresses the relationships among amount of practice time, race
times, and motivation for running in high school athletes. He measures motivation for
running by a Likert scale.
• 57. Given Duffy’s research, which one of the following correlation coefficients
should he use to analyze his data?
a. Kendall’s tau
b. Spearman’s rho
c. Pearson r
d. Phi coefficient
• 58. Duffy’s findings indicate a strong positive relationship between practice time and
race times. Which of the following is a possible correlation in his research?
a. -.80
b. -.30
c. .30
d. .80
• 59-60. For each, consider the information the correlation provides.
• 59. Kenji reported a correlation of –.85 between hours spent in community service
and adolescent drug use. This finding suggests that
a. there is no relationship between community service and adolescent drug use.
b. the more community service one performs the more likely one is to use drugs.
c. the more community service one performs the less likely one is to use drugs.
d. Kenji has calculated the correlation incorrectly because he has a negative number.
• 60. Monica, on the other hand, reported a correlation of 3.4 between community
service and interest in helping professions among adolescents. This finding suggests that
a. there is no relationship between community service and interest in helping
professions.
b. the more community service one performs the more likely one is to have interest in a
helping profession.
c. the more community service one performs the less likely one is to have interest in a
helping profession.
d. Monica has calculated the correlation incorrectly because 3.4 is not a possible
correlation coefficient.
• 61. Of the following research topics, which is most likely to be a correlation study?
a. The relationship between hours of exercise and sleep.
b. The difference in minutes a day exercising between boys and girls.
c. The types of exercise students engage in after school.
d. The experiences of John at after school track practice.
• 62. Of the following research topics, which is most likely to represent a correlation
study?
a. The mathematics activities found in a sixth grade math class.
b. The teaching philosophy of a new mathematics teacher.
c. The predictive ability of mathematics grades in later math class enrollment.
d. The differences in mathematics grades based upon parents’ educational level.
15
• 63. Jamie found an internal consistency reliability coefficient of .60 for his measure
of spatial ability. Jaime’s instrument
a. shows high internal consistency reliability.
b. shows adequate internal consistency reliability.
c. shows minimally acceptable internal consistency reliability.
d. shows poor internal consistency reliability.
• 64. Maddie reported a significant correlation of r=.20 between years of teaching and
salary satisfaction in her large survey study. How can Maddie’s findings best be
described?
a. Her finding is practically insignificant.
b. Her finding is moderately significant.
c. Her finding is a strong effect.
d. Her finding is strongly significant.
• 65. Yeung reported a correlation of .70 between hours of exercise and self-reported
stress-level in graduate students. Which of the following is an accurate statement
regarding this finding?
a. The two variables were unrelated in her study.
b. As hours of exercise increased, stress generally increased.
c. Her finding represents a moderate effect.
d. Her results represent significant differences.
• 66. Milton reported in his study that as chocolate consumption increased, reported
stress remained constant. Of the following, which is a correlation coefficient that would
best support Milton’s claim?
a. –1.0
b. -.40
c. .05
d. .50
• 67. The correlation that Raymond found in his study between child self-confidence
and reported number of friends was r=.90.
a. Insignificant
b. Low
c. Moderate
d. Strong
• 68. Which of the following represents the correlation that Shenna reported
when she concluded that there was a moderate relationship between self-concept and
parents’ ratings of children’s self-concept?
a. -.70
b. -.30
c. .00
d. .80
16
• 69. Nena reported a large effect for genetics in her study of early onset dementia. Of
the following, which represents the correlation that she found?
a. -.70
b. -.40
c. .45
d. .80
• 70. Paisley found no significant relationship in her study of number of friends and
alcohol consumption in University women. Of the following which is likely a correlation
she reported?
a. -.68
b. -.14
c. .52
d. 1.0

17
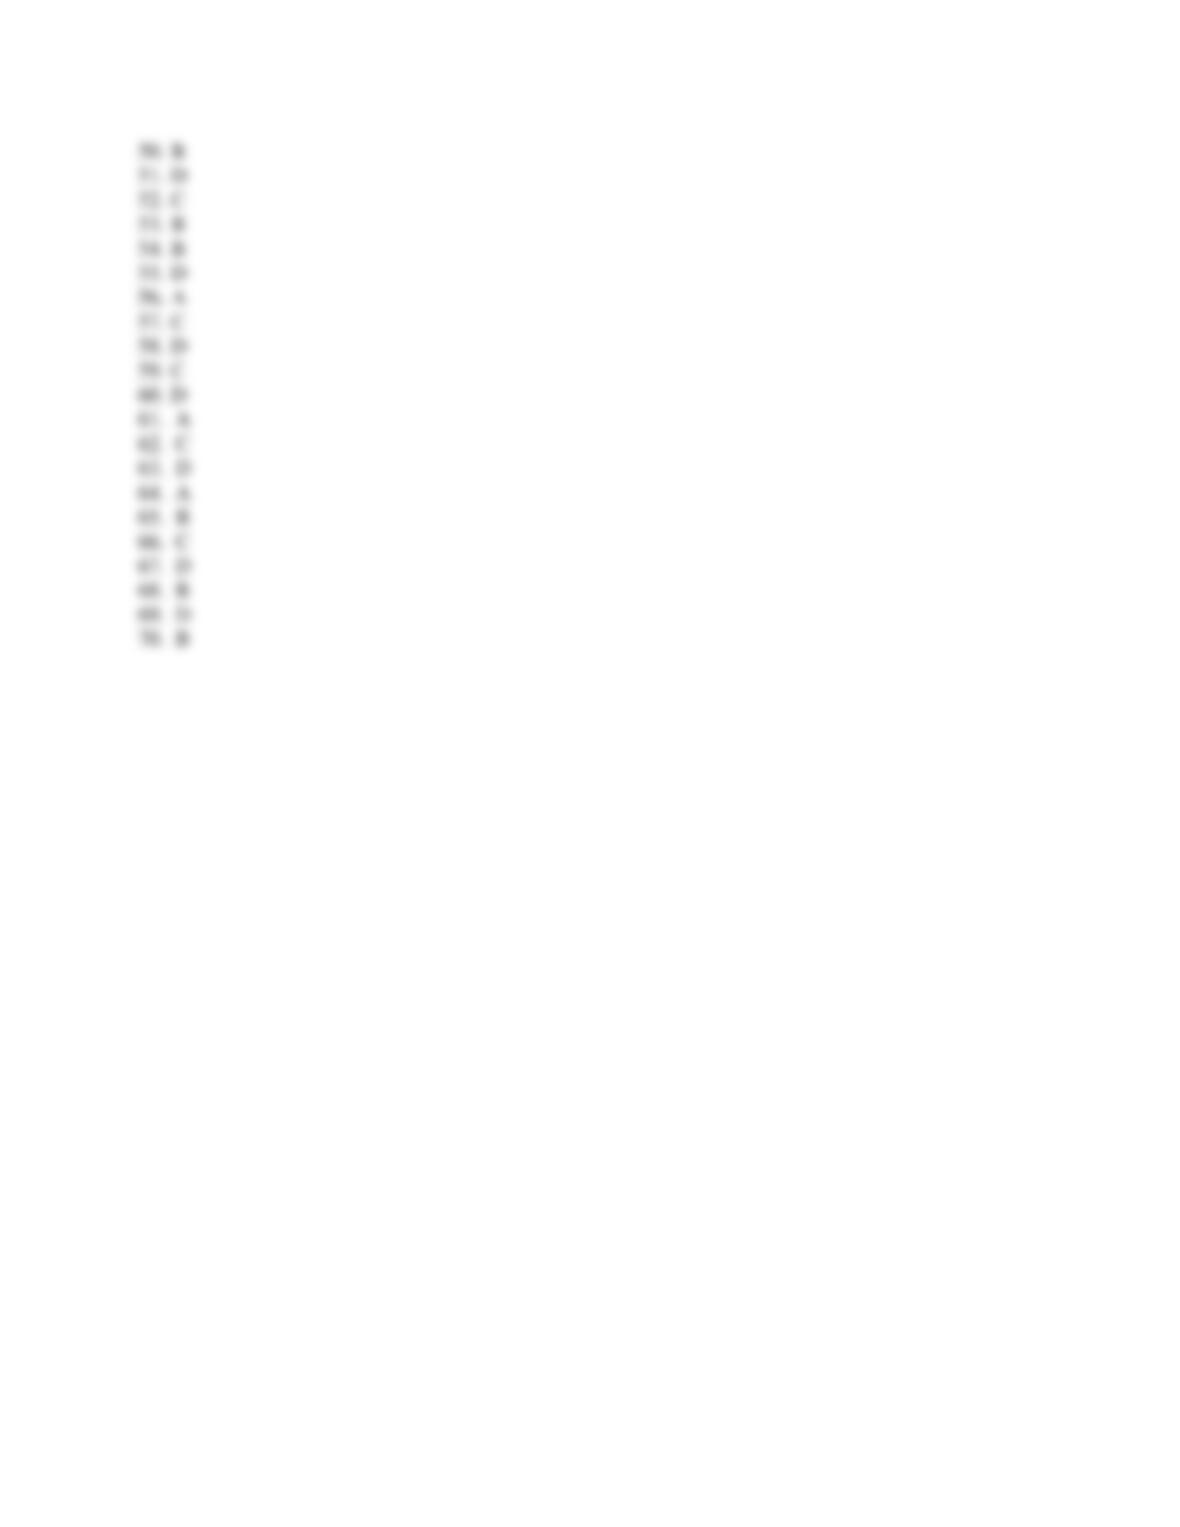
Chapter 8 Answers
18