Exam
Name___________________________________
SHORT ANSWER. Write the word or phrase that best completes each statement or answers the question.
Describe the given distribution with a circle graph.
1)
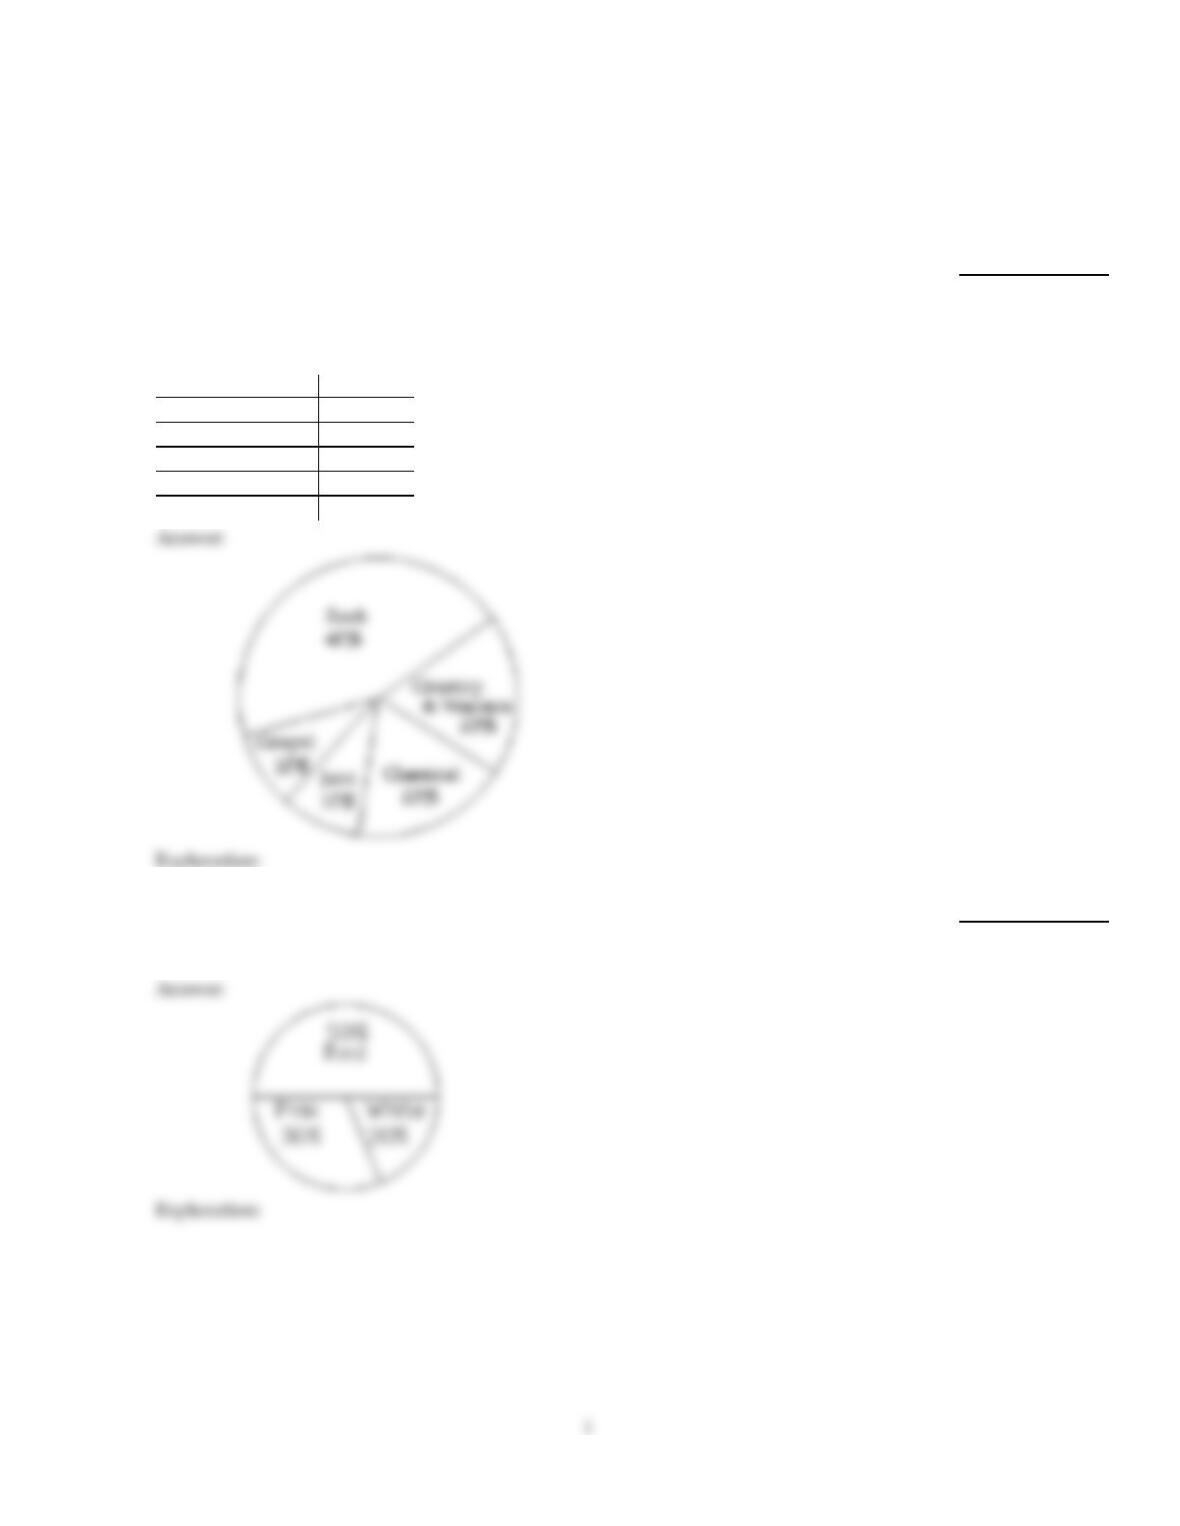
A questionnaire was sent to customers asking about their music preferences. The
customers were asked to pick the type of music they preferred from the categories rock,
classical, gospel, country & western, and jazz. The results are shown in the table. Make a
circle graph based on the data in the table.
CATEGORY NUMBER
Rock 600
Classical 300
Gospel 150
Country &Western 300
Jazz 150
1)
2)
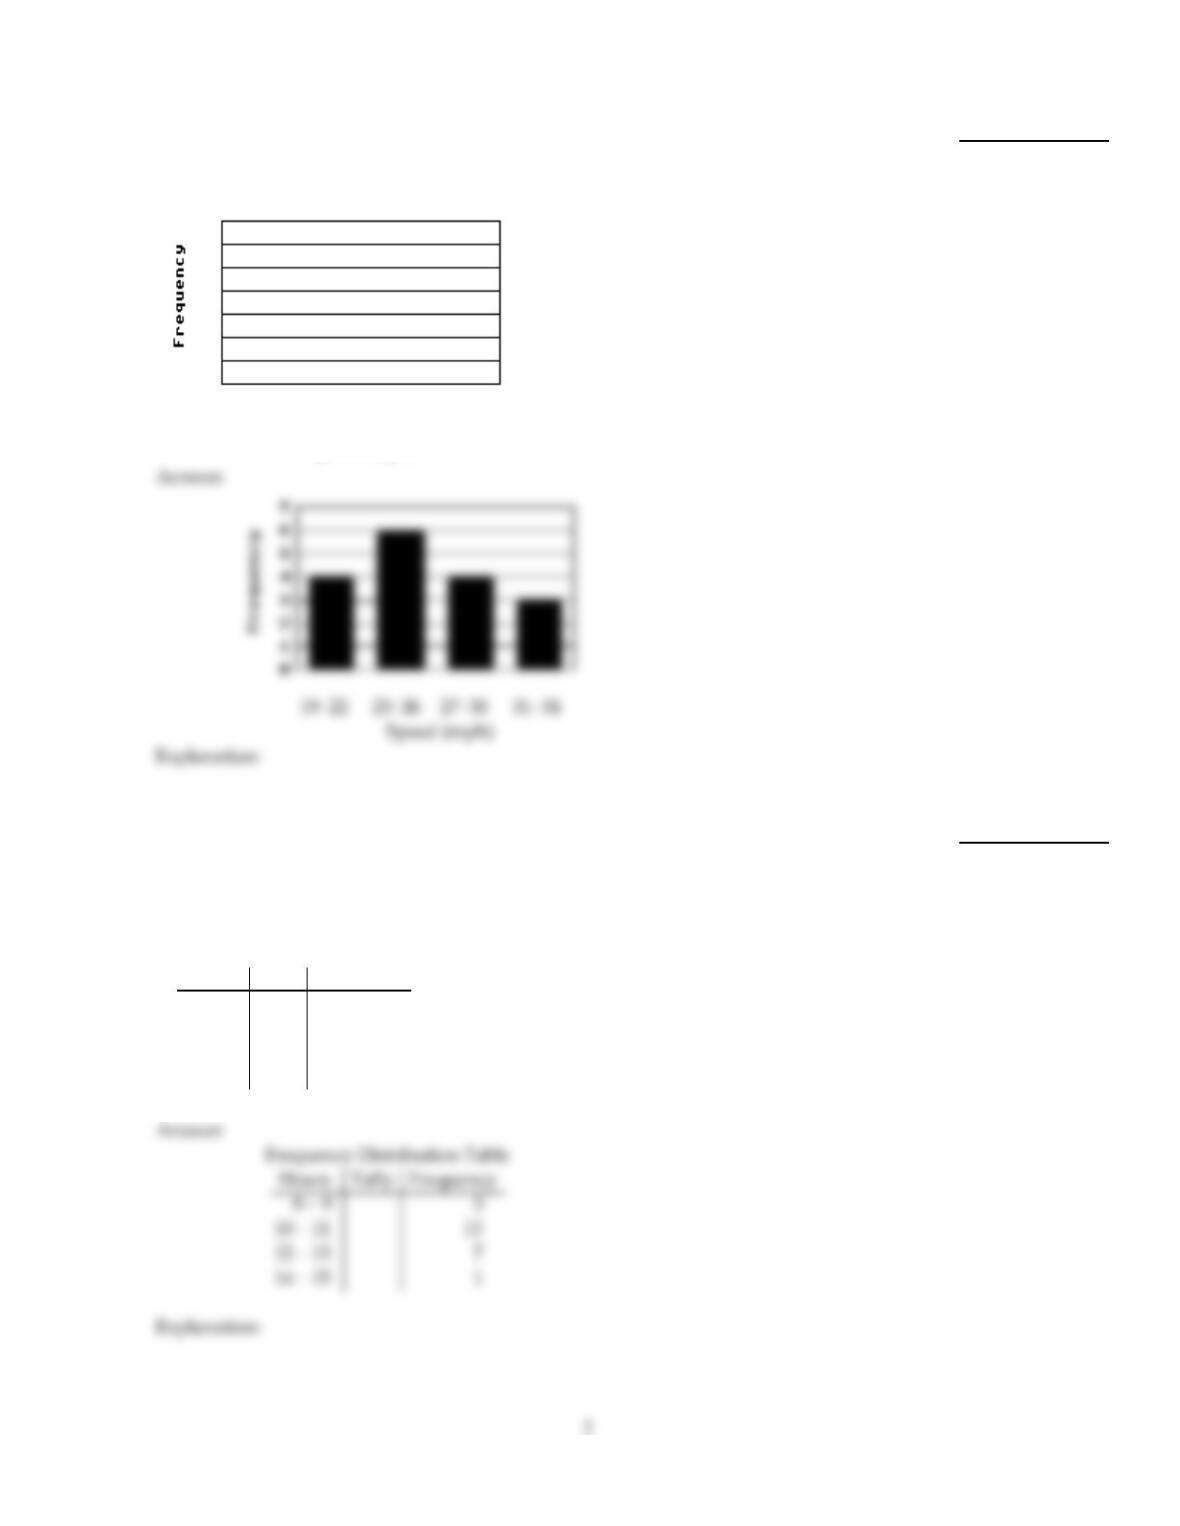
The following data give the color distribution of 1900 carnations ordered by a local florist.
Pink Red White
570 950 380
2)
Use the data to make a histogram.
3)
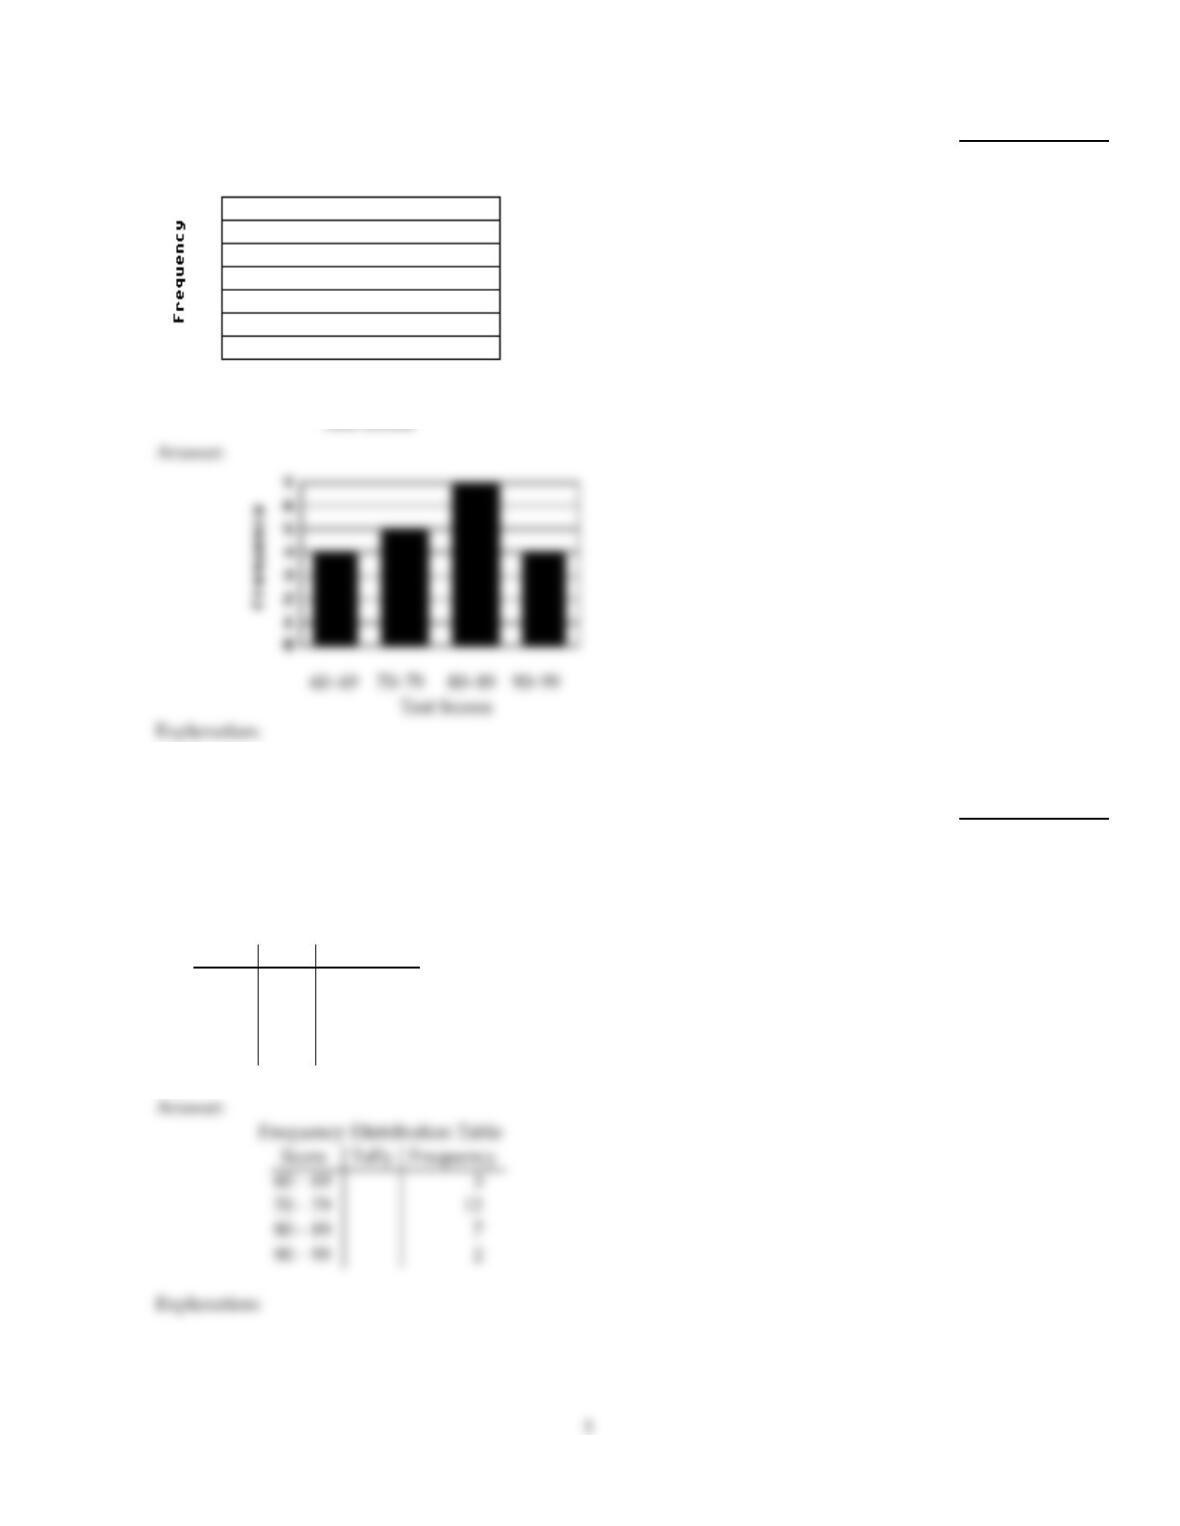
In one 3–minute period, 17 cars passed a speed checkpoint. Listed below are their speeds
in miles per hour.
24 19 24 30 31 25 34 27
26 33 27 20 20 25 28 26 22
19–22 23–26 27–30 31–34
Speed (mph)
3)
Use the data to make a frequency distribution table.
4)
Lori asked 24 students how many hours they spent doing homework during the previous
week.
10 10 10 910 10 15 12 10 812 10
10 12 10 10 12 10 10 12 10 12 12 9
Frequency Distribution Table
Hours Tally Frequency
4)
Use the data to make a histogram.
5)
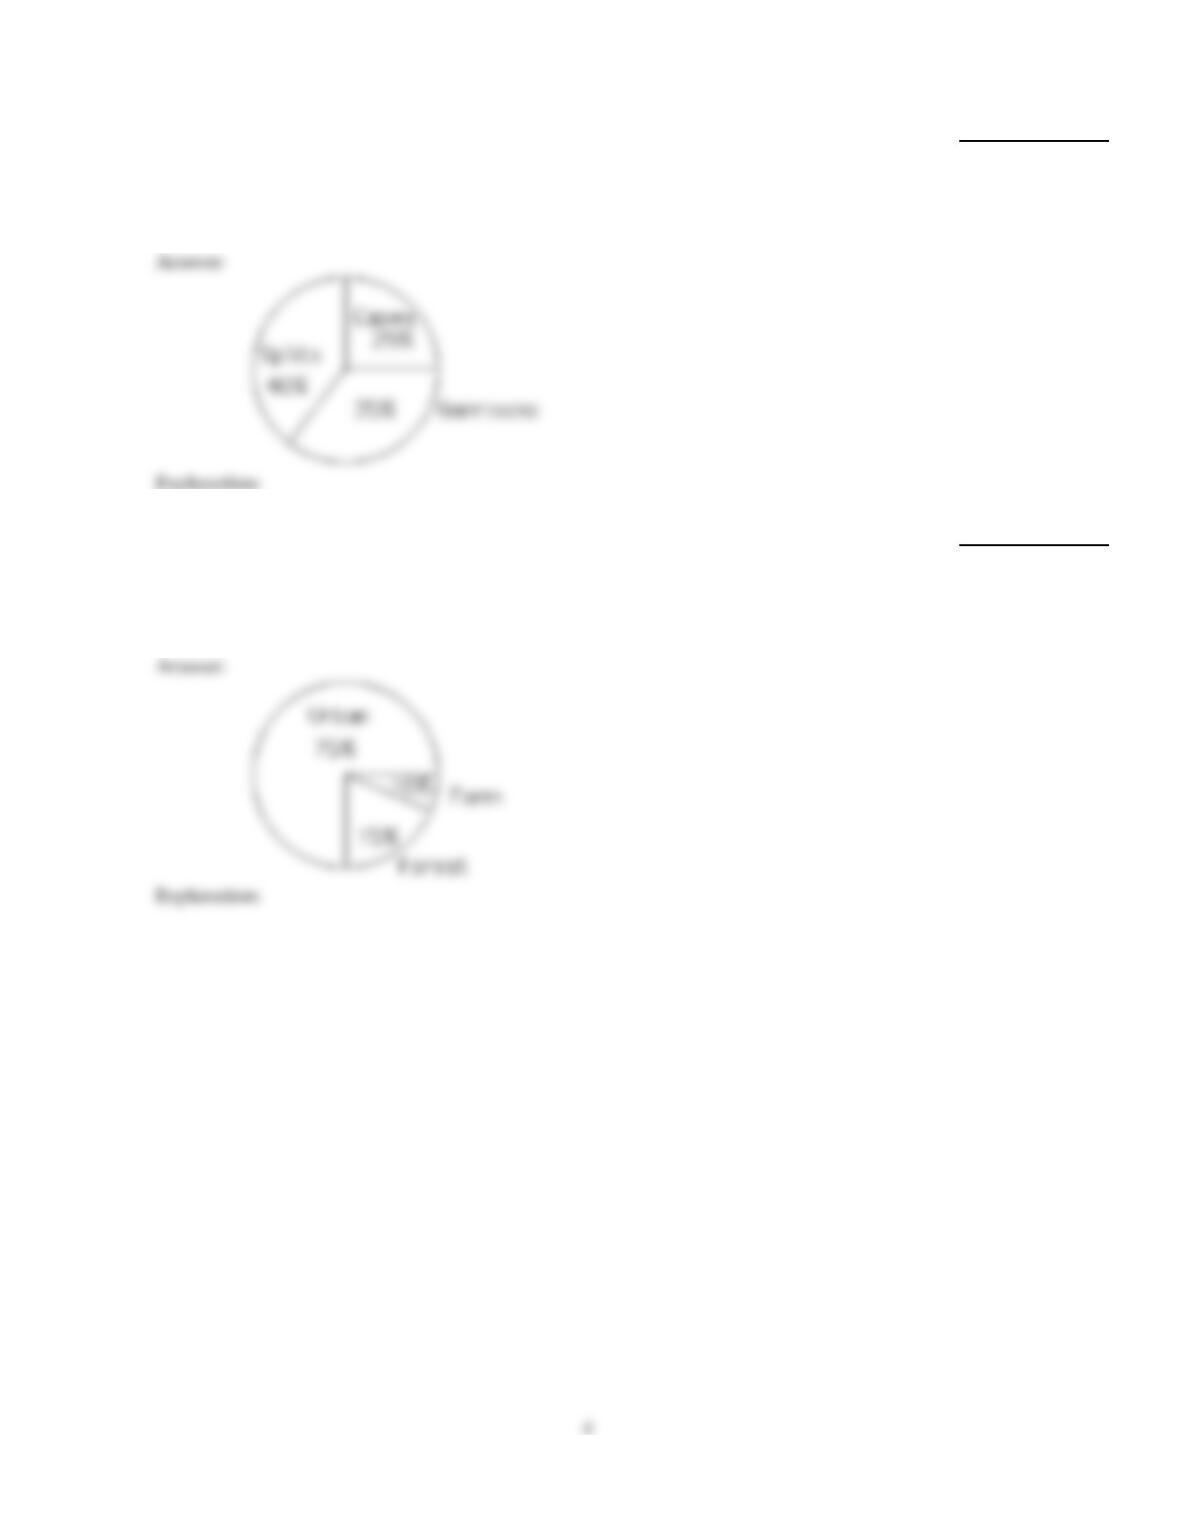
The test scores in Mrs. Brooks’ biology class are listed below.
85 64 97 93 88 82 75 85 92 88
67 82 77 83 62 73 77 95 75 65
60–69 70–79 80–89 90–99
Test Scores
5)
Use the data to make a frequency distribution table.
6)
On a math test, 24 students got the following scores.
95 77 74 62 74 74 95 83 74 63 87 77
77 87 74 77 87 74 77 83 77 87 83 62
Frequency Distribution Table
Score Tally Frequency
6)
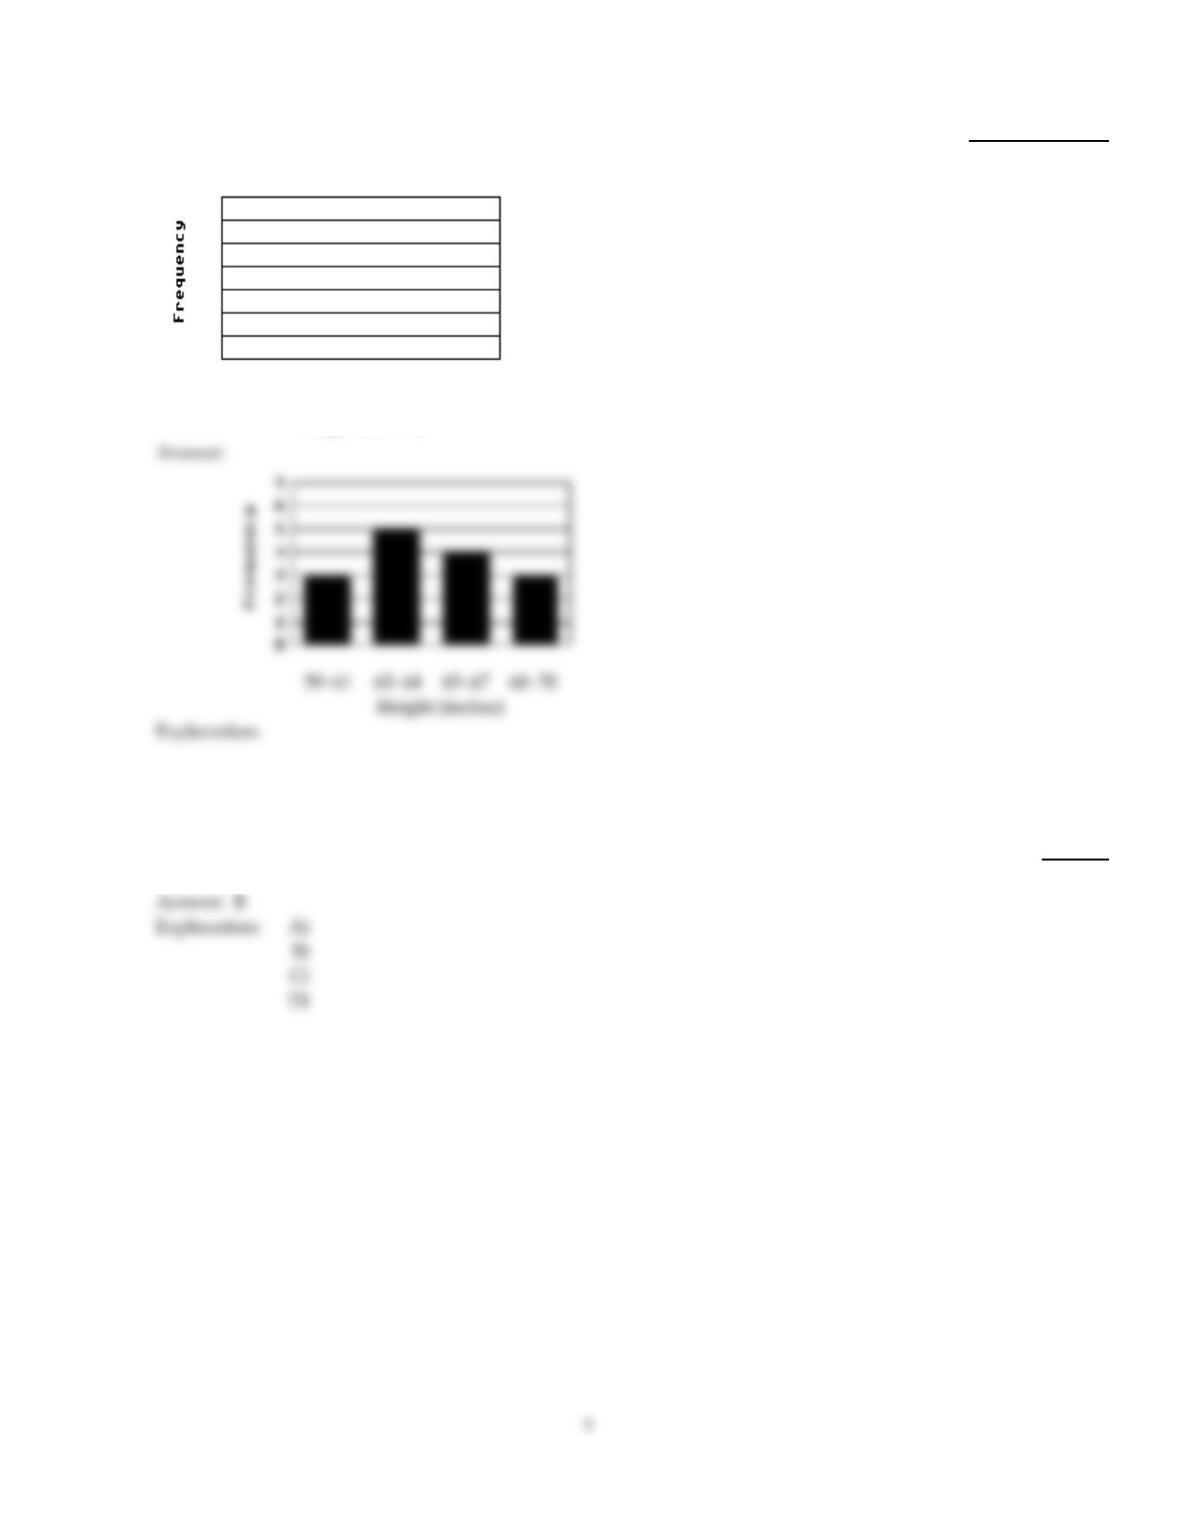
Describe the given distribution with a circle graph.
7)
The following data give the distribution of the types of houses in a town containing 18,000
houses.
Capes
4500
Garrisons
6300
Splits
7200
7)
8)
The following figures give the distribution of land (in acres) of a county containing 83,000
acres.
Forest
12,450
Farm
8300
Urban
62,250
8)
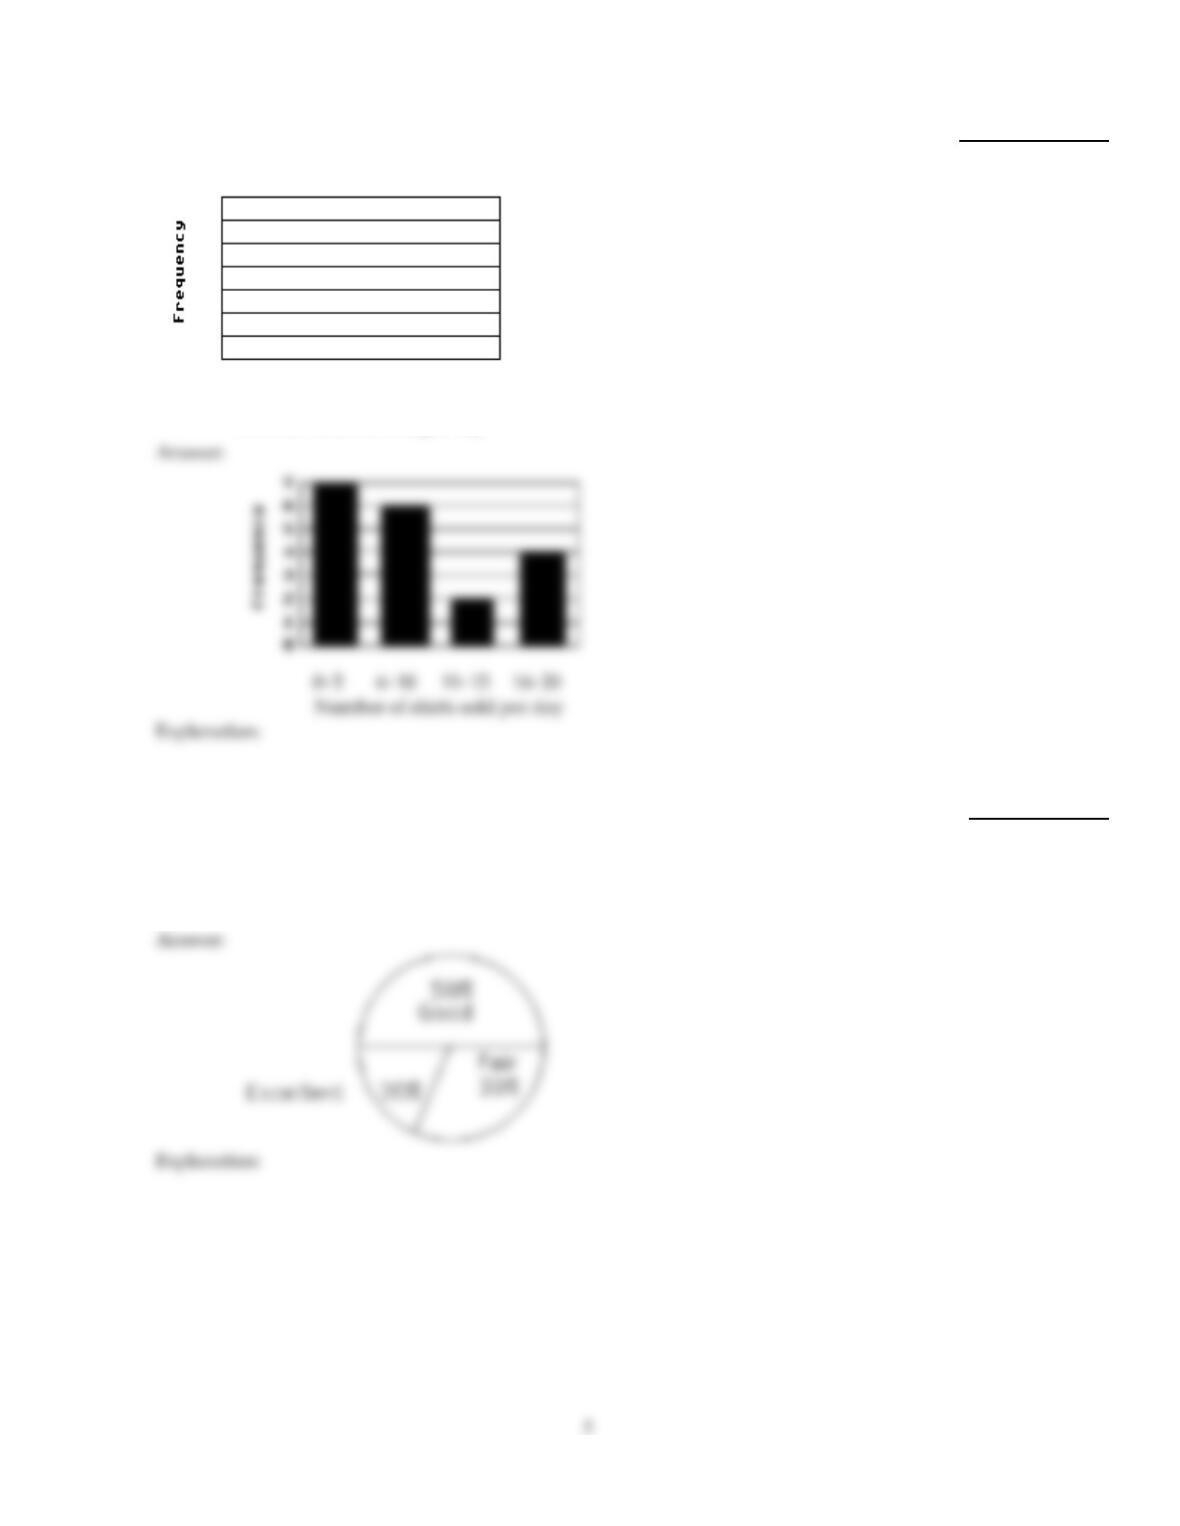
Use the data to make a histogram.
9)
The number of sweatshirts sold each day for 19 days is listed below.
15 12 20 18 5 3 7 4 10 1
6 5 7 9 2 17 16 3 7
0–5 6–10 11–15 16–20
Number of shirts sold per day
9)
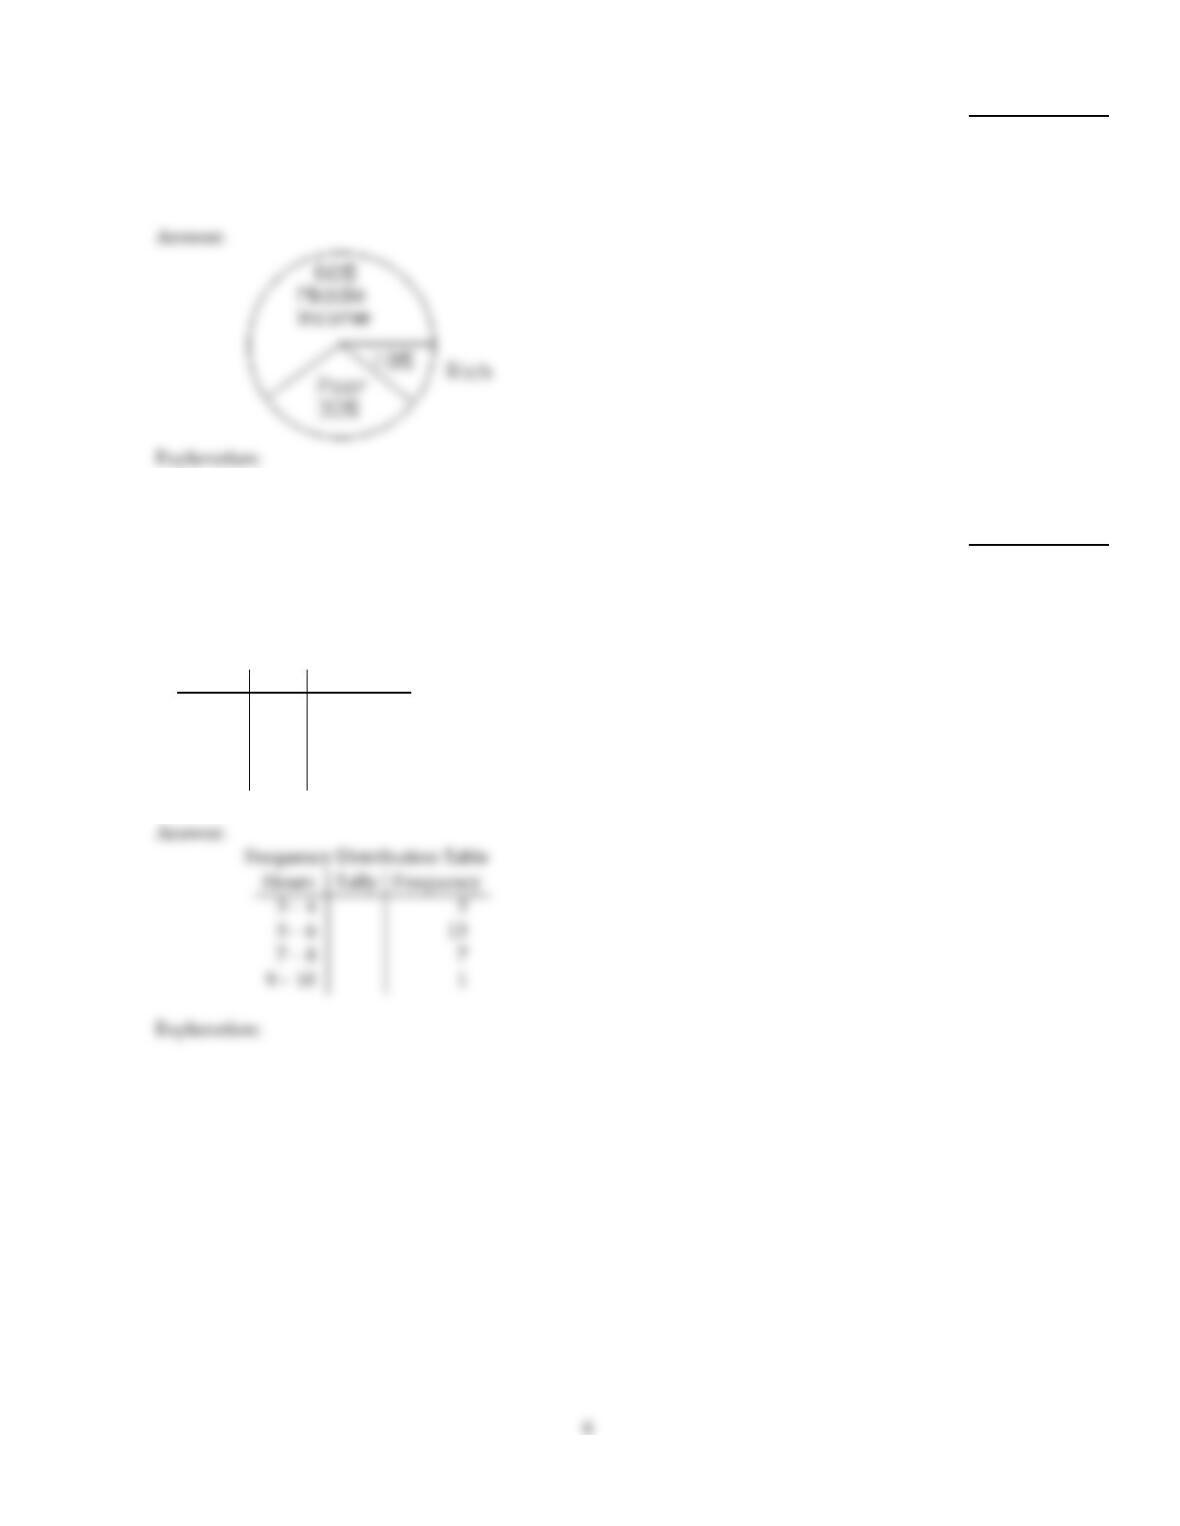
Describe the given distribution with a circle graph.
10)
After reviewing a movie, 200 people rated the movie as excellent, good, or fair. The
following data give the rating distribution.
Excellent
40
Good
100
Fair
60
10)
11)
The following figures give the economic distribution for 9000 people who live in a certain
county.
Poor
2700
Middle Income
5400
Rich
900
11)
Use the data to make a frequency distribution table.
12)
Kevin asked some of his friends how many hours they worked during the previous week
at their after–school jobs.
5 5 5 3 5 5 9 7 5 4 7 5
5 7 5 5 7 5 5 7 5 7 7 3
Frequency Distribution Table
Hours Tally Frequency
12)
Use the data to make a histogram.
13)
The heights in inches of the boys on a ninth–grade basketball team are listed below.
62 63 66 67 62 60 70 65
62 68 65 61 64 59 68
59–61 62–64 65–67 68–70
Height (inches)
13)
MULTIPLE CHOICE. Choose the one alternative that best completes the statement or answers the question.
Find the median for the data given.
14)
Number of phone calls made each day: 5, 1, 26, 10, 25, 41, 32, 30
14)
A)
26 calls
B)
25.5 calls
C)
25 calls
D)
21.5 calls
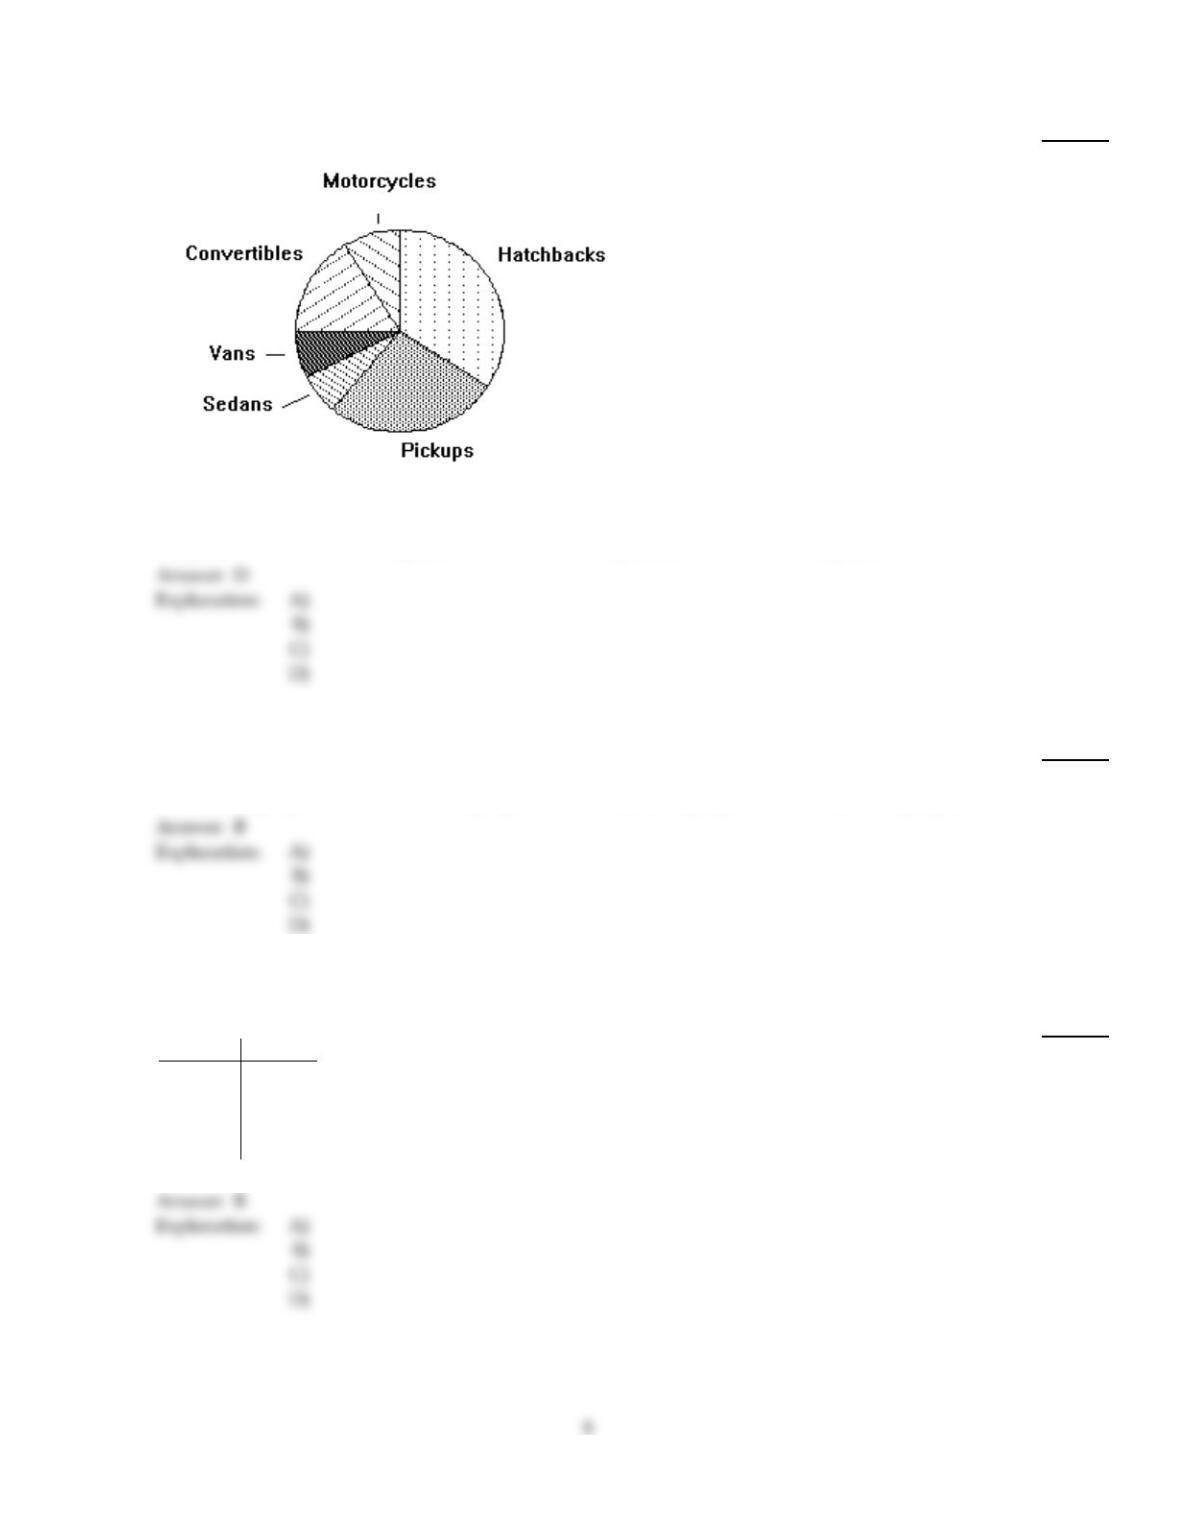
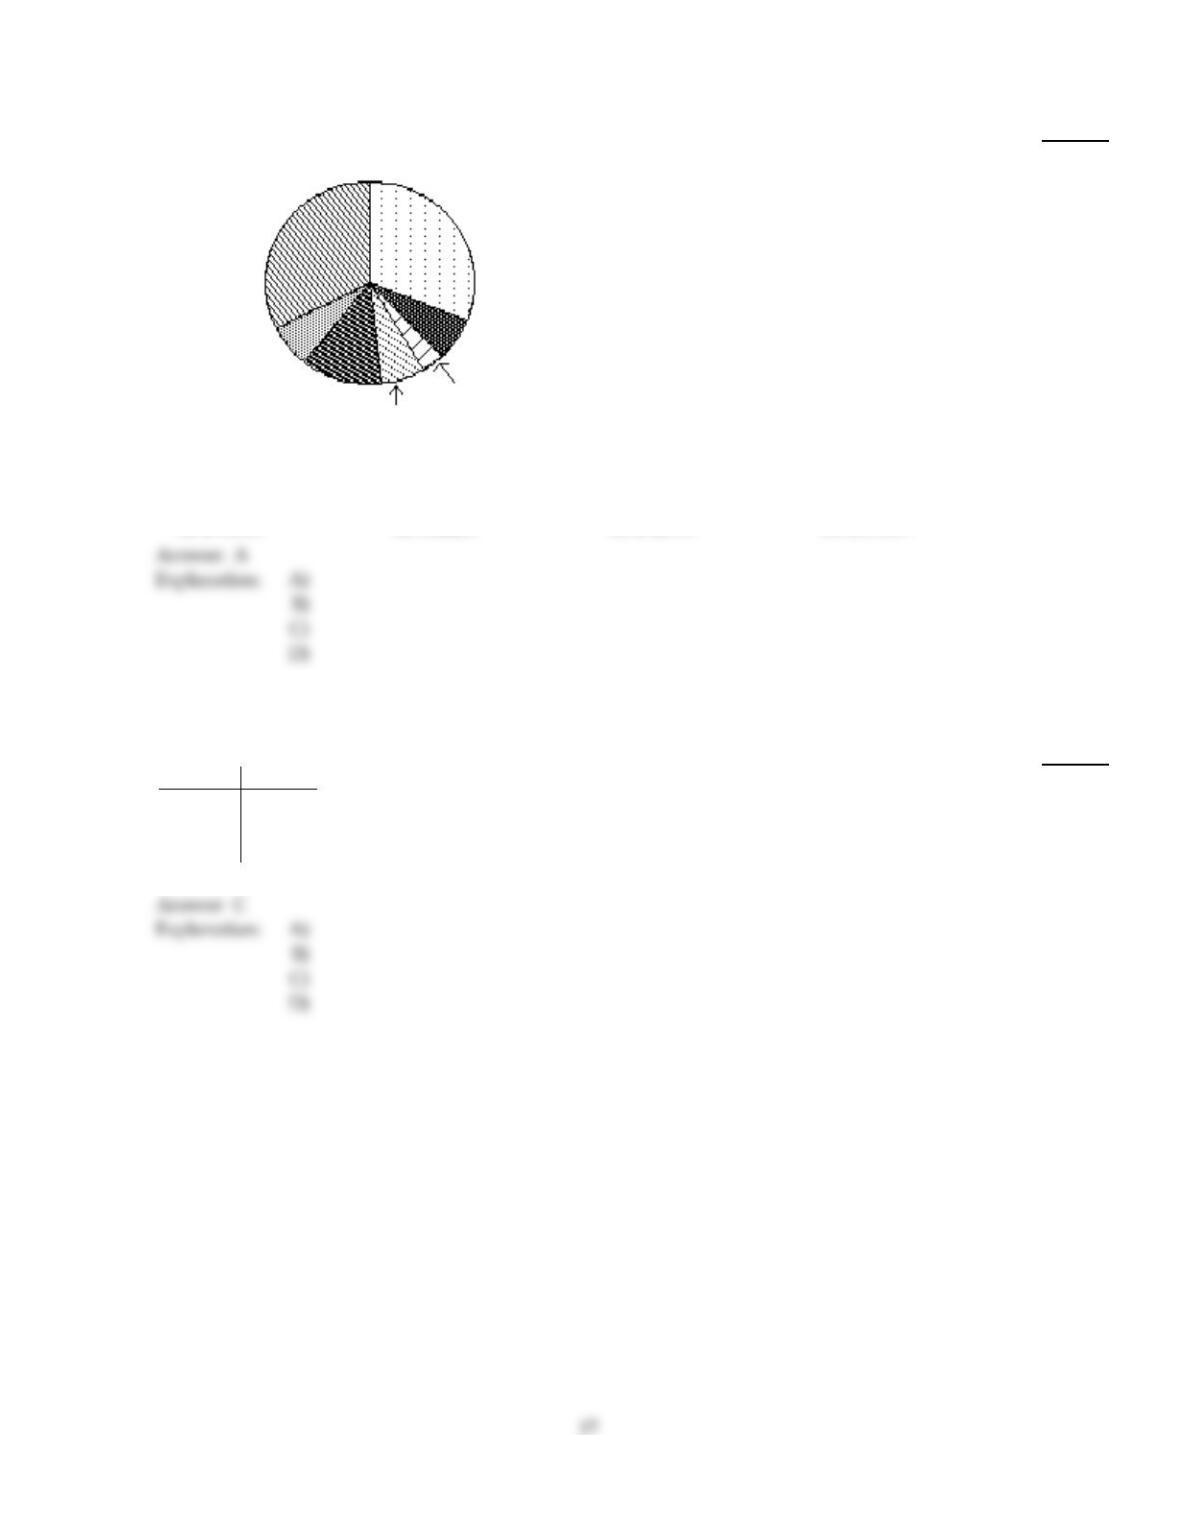
Use the circle graph to solve the problem.
15)
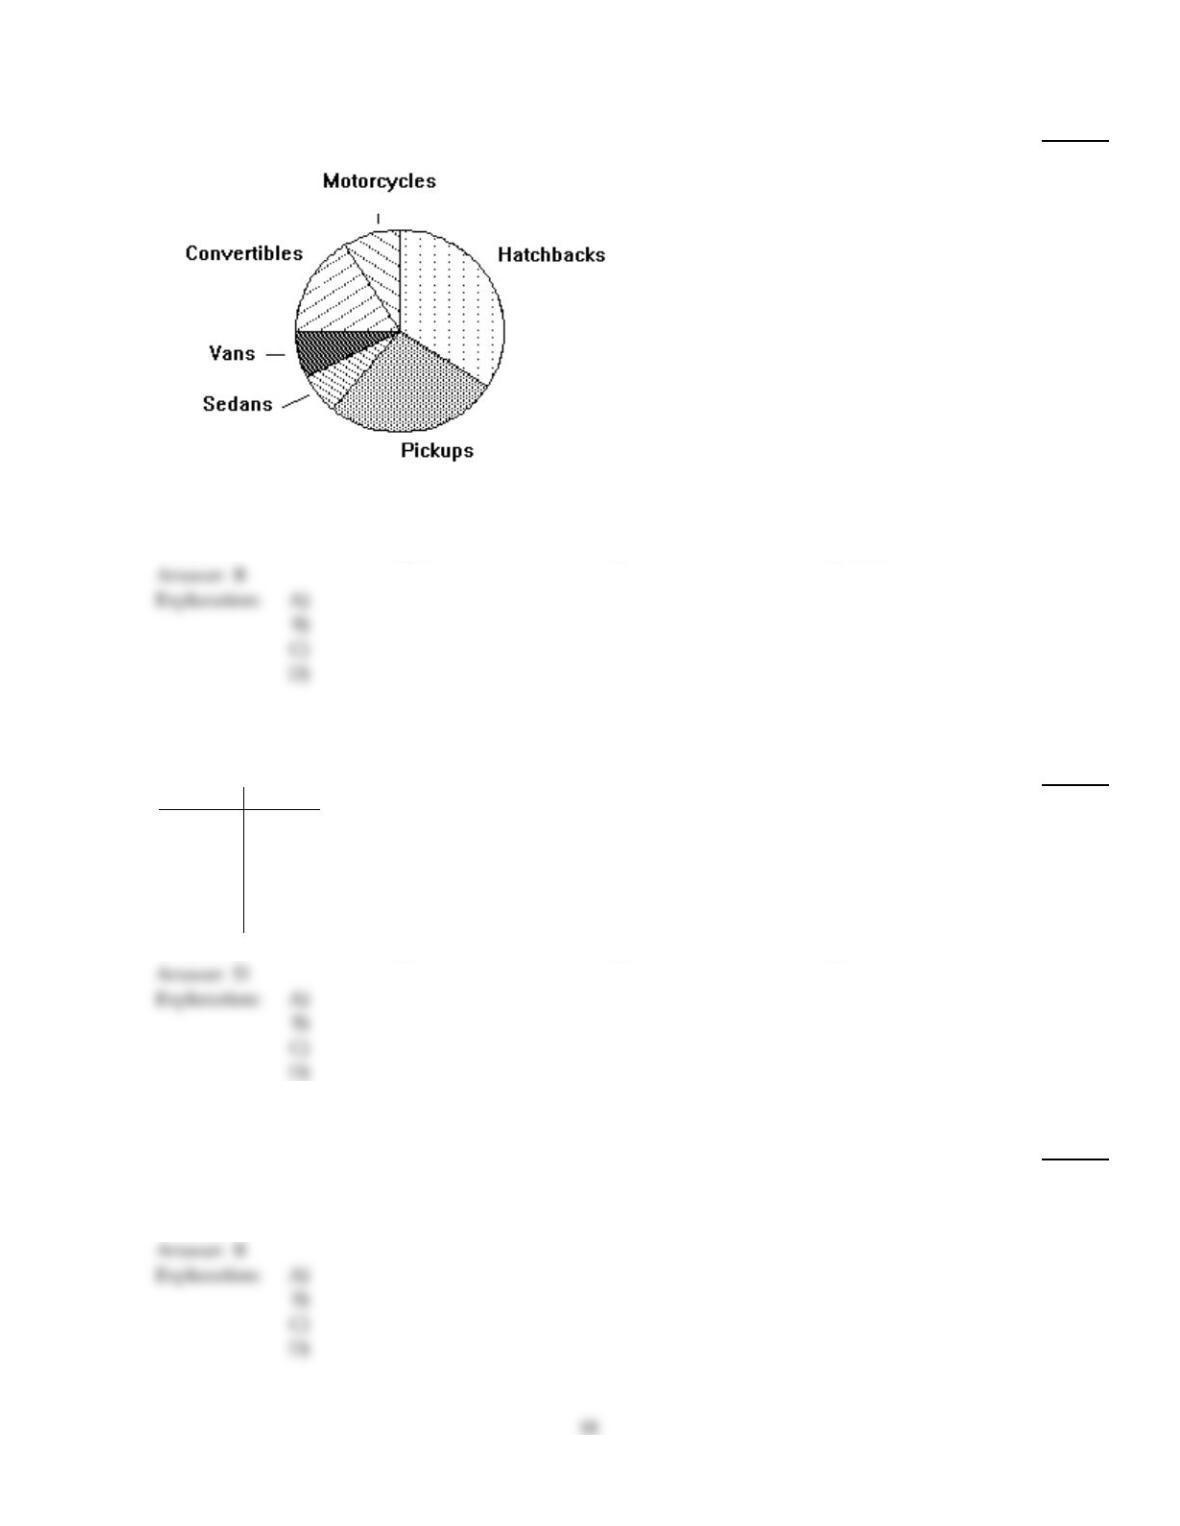
A survey of the 5150 vehicles on the campus of State University yielded the following circle graph.
7%
18%36%
8%
6%
25%
What percent of the vehicles are hatchbacks?
15)
A)
8%
B)
25%
C)
185%
D)
36%
Find the mean for the list of numbers.
16)
Numbers of people attending hockey games: 27,107, 24,713, 36,212, 26,386
Round answer to the nearest whole number if necessary.
16)
A)
24,713 people
B)
28,605 people
C)
27,107 people
D)
28,604 people
Find the grade point average for a student earning the following grades. Assume A = 4, B = 3, C = 2, D = 1, and F = 0.
Round answer to the nearest hundredth.
17)
Credits Grade
6 B
1 B
6 B
4 B
17)
A)
4.25
B)
3.00
C)
3.60
D)
12.75
Suppose that the average adult in the United States will work x number of days (rounded to the nearest day) to earn
enough to pay for all of the household’s leisure activities in that year. This number can be calculated by multiplying the
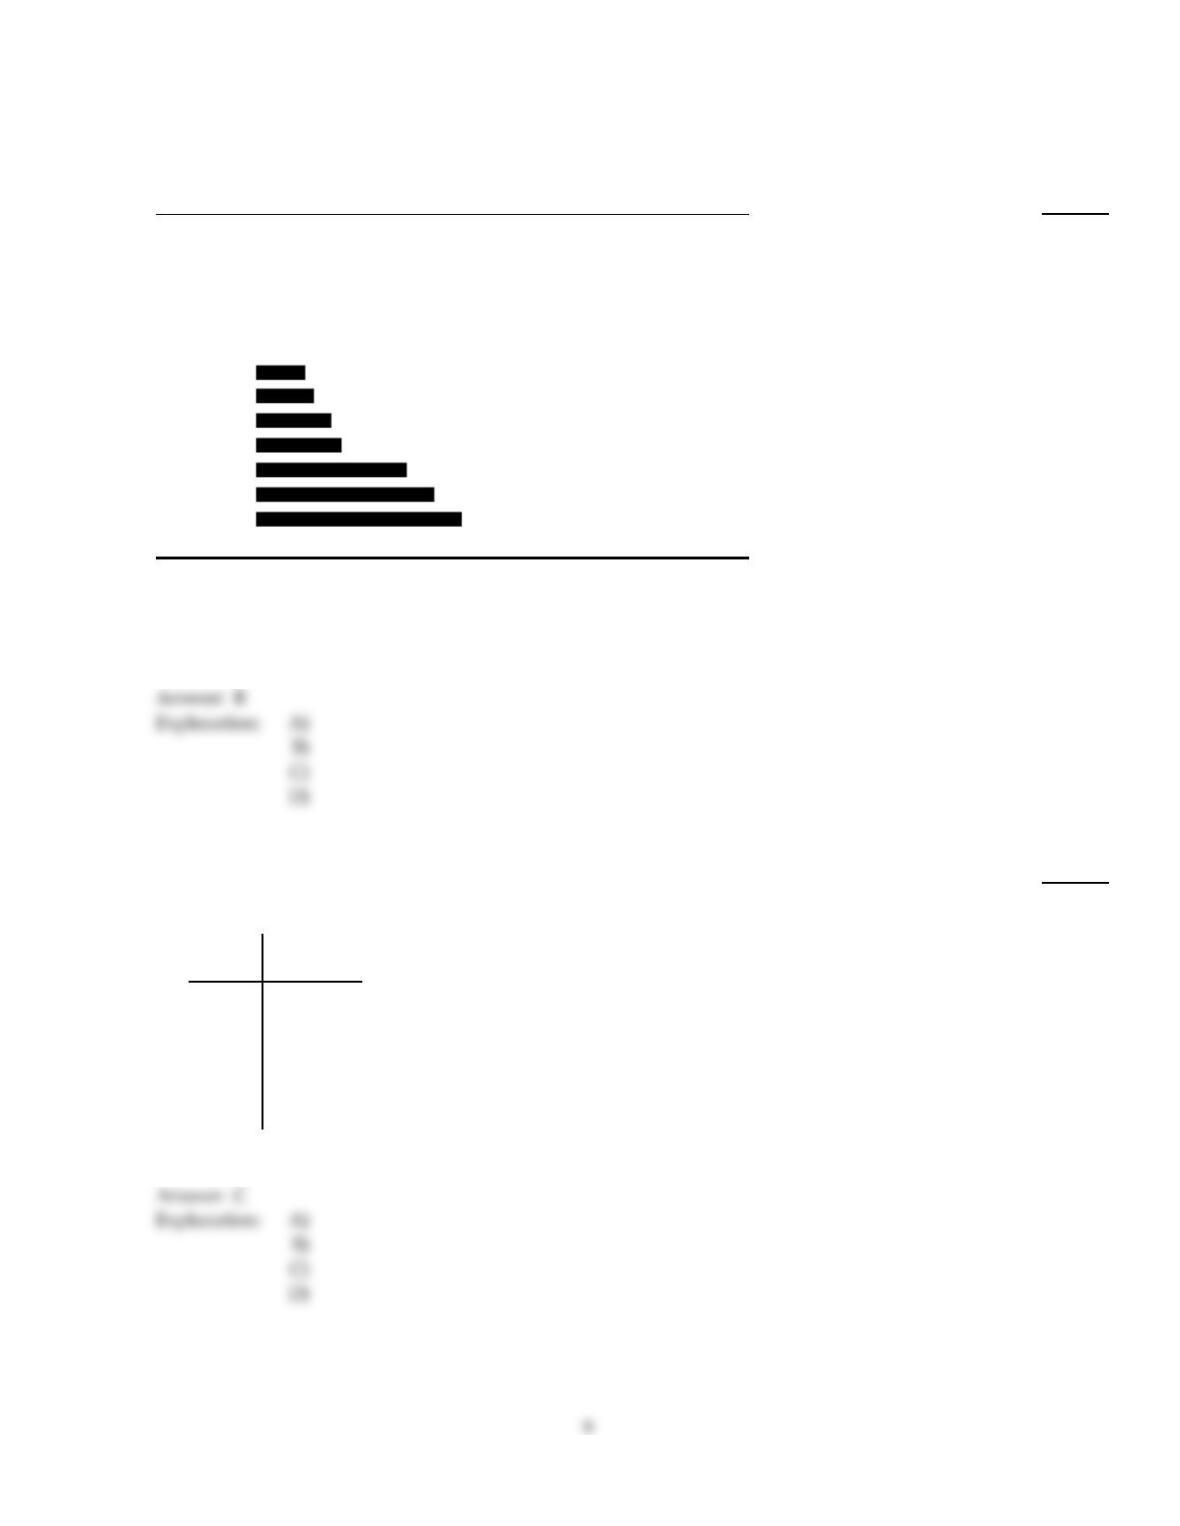
average percent of household income spent on leisure activities by 365 (the number of days in a year). The bar graph
shows the percent of income spent in various countries of the world. Use the graph to answer the question.
18)
PERCENT OF HOUSEHOLD INCOME FOR LEISURE ACTIVITIES
The average American adult will work 104 days each year
to earn enough to pay annual leisure expenses.
Percent of household income spent on leisure activities:
China 5.8%
Australia 8.6%
France 9.9%
Germany 13.9%
Britain 19.3%
Japan 23.1%
USA 28.5%
List all countries in the graph in which more than 12% of household income is spent, on average,
for leisure activities.
18)
A)
China, Australia, France
B)
Germany, Britain, Japan, USA
C)
Britain, Japan, USA
D)
Japan, USA
Find the weighted mean of the numbers in the table. Round to the nearest tenth.
19)
At a supermarket during the 6 p.m. rush, the manager counted the number of customers waiting in
each of the 12 checkout lines. The results are shown in the table.
Number
Waiting Frequency
2 2
3 1
4 4
5 3
6 0
7 2
19)
A)
5.2 customers
B)
5.8 customers
C)
4.3 customers
D)
4.5 customers
Provide an appropriate response.
20)
A cruise ship carried the following numbers of passengers on ten cruises last winter: 1886, 1658,
1742, 270, 1805, 1653, 1648, 1583, 1936, and 1903. Which measure of central tendency gives the best
average load?
20)
A)
Weighted mean
B)
Median
C)
Mean
D)
Mode
Find the median for the data given.
21)
Number of steaks served: 6, 8, 20, 23, 31, 44, 48
21)
A)
31 steaks
B)
26 steaks
C)
23 steaks
D)
20 steaks
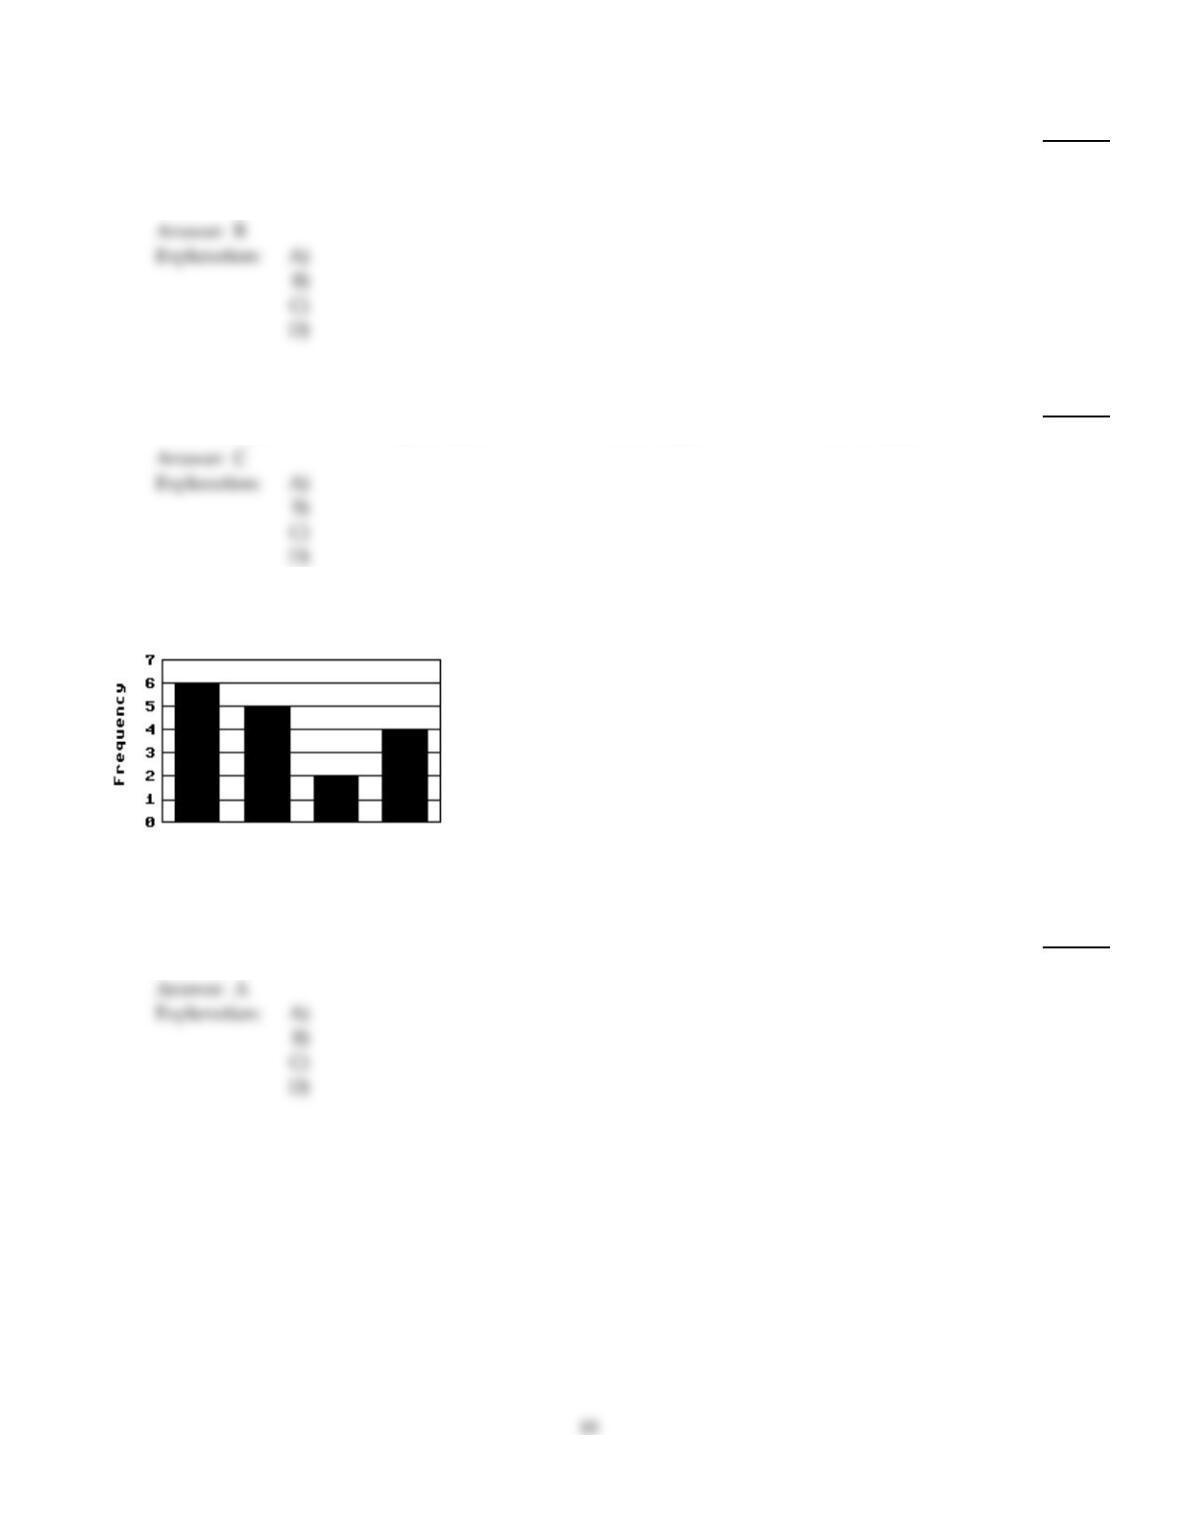
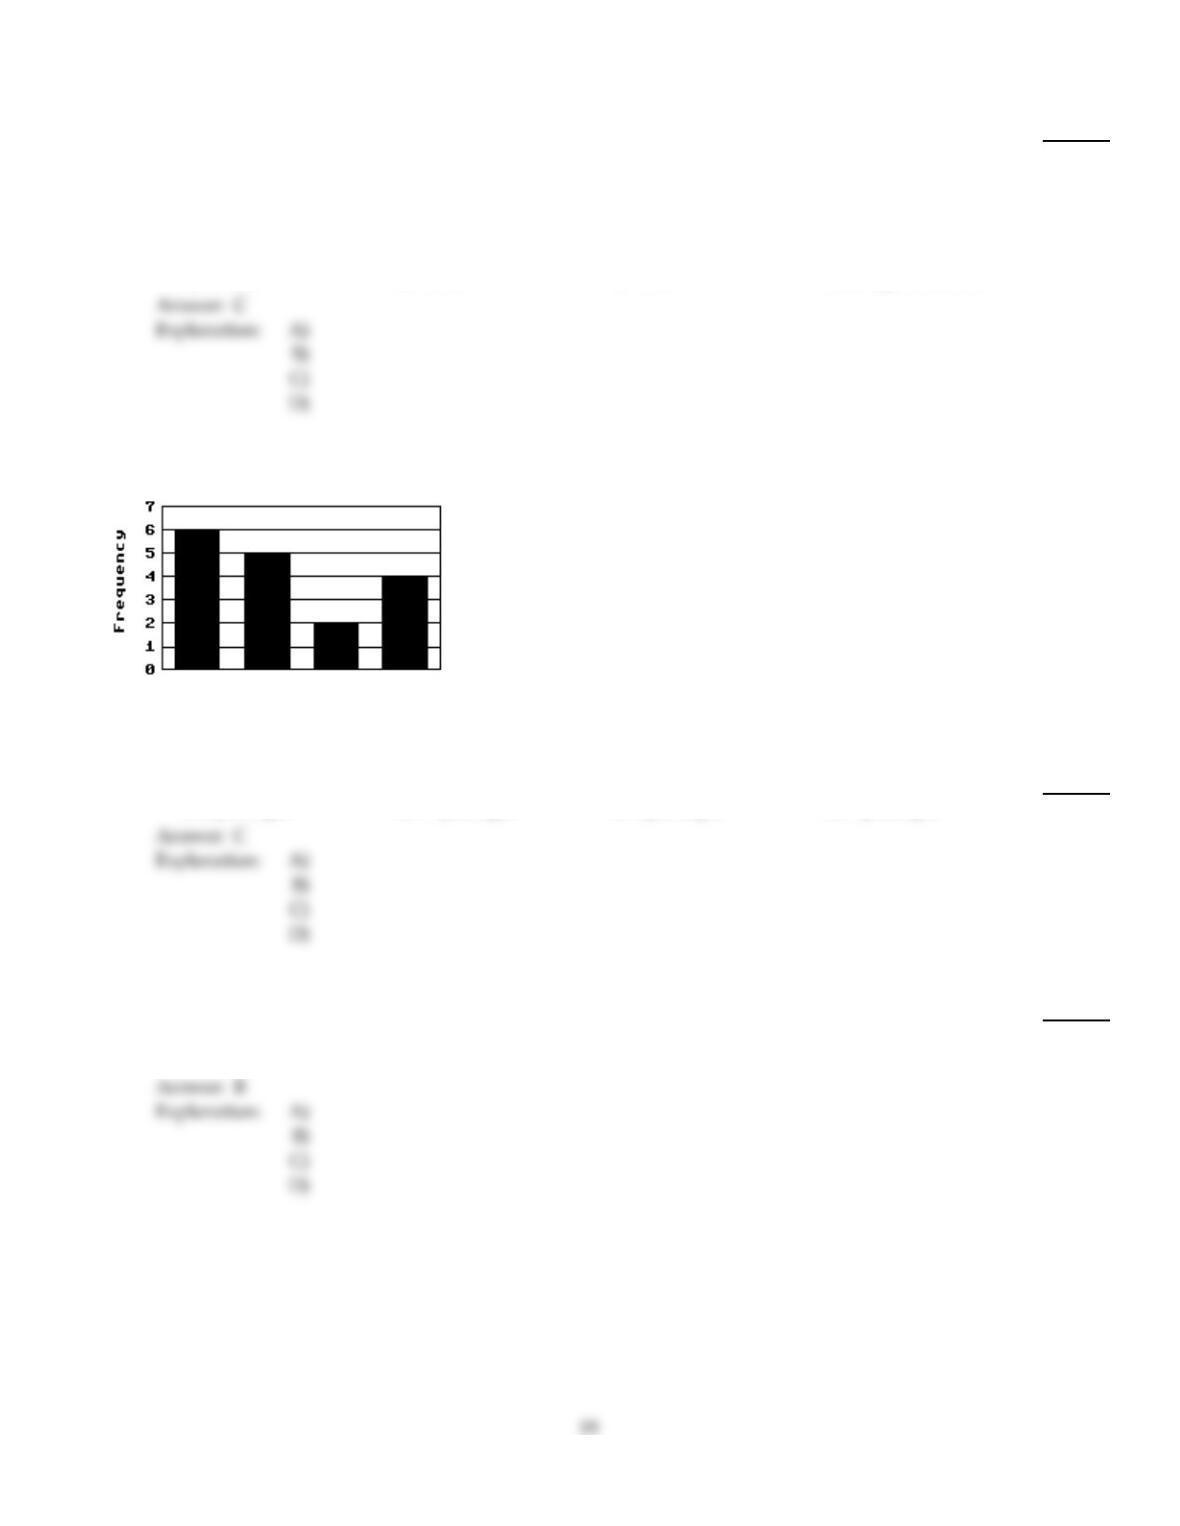
The post office recorded the weights of packages sent on a particular day and used the results to construct a histogram.
Use the histogram to solve the problem.
0–910–19 20–29 30–39
Weight of Package (pounds)
22)
Find the number of packages 10 pounds and over.
22)
A)
11 packages
B)
7 packages
C)
5 packages
D)
6 packages

Find the weighted mean of the numbers in the table. Round to the nearest tenth.
23)
Find the weighted mean salary for the employees. Round to the nearest thousand dollars.
Salary
Number of
employees
$20,000 6
$33,000 5
$41,000 3
$54,000 7
$62,000 2
23)
A)
$45,000
B)
$40,000
C)
$41,000
D)
$39,000
Find the mode or modes for the list of numbers.
24)
Ages of parents (in years) at the school: 20, 28, 46, 28, 49, 28, 49
24)
A)
35.4 years
B)
28 years
C)
46 years
D)
49 years
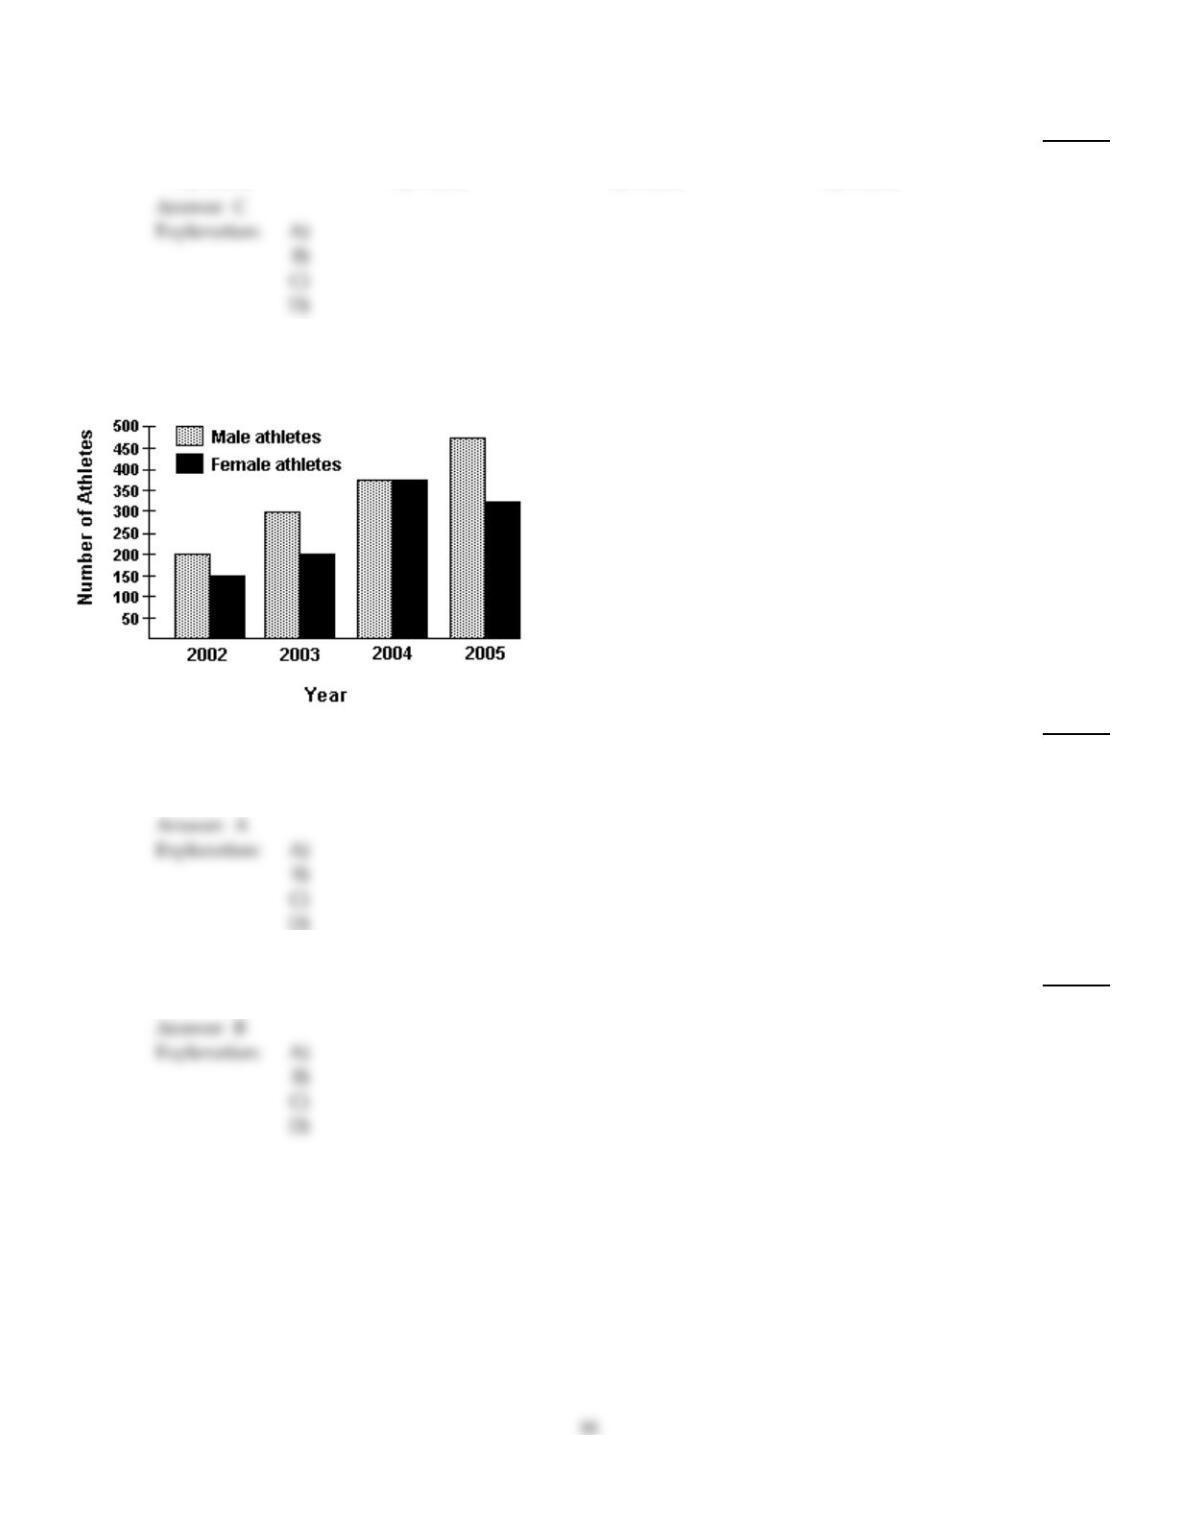
Refer to the double–bar graph below which shows the number of male and female athletes at a university over a
four–year period. Solve the problem.
25)
How many students were involved in athletics in 2003?
25)
A)
300
B)
500
C)
600
D)
400
Find the median for the data given.
26)
Newspapers delivered each day: 99, 51, 230, 154, 272, 237, 235
26)
A)
235 newspapers
B)
183 newspapers
C)
154 newspapers
D)
230 newspapers
Solve.
27)
Tatiana purchased a car for $19,592. Of the $19,592, she spent $2449 for a sunroof, which was 12.5%
of what she spent for the car. Find the number of degrees on a circle that represent the amount for
the sunroof.
27)
A)
25°
B)
12.5°
C)
45°
D)
90°
Solve the problem.
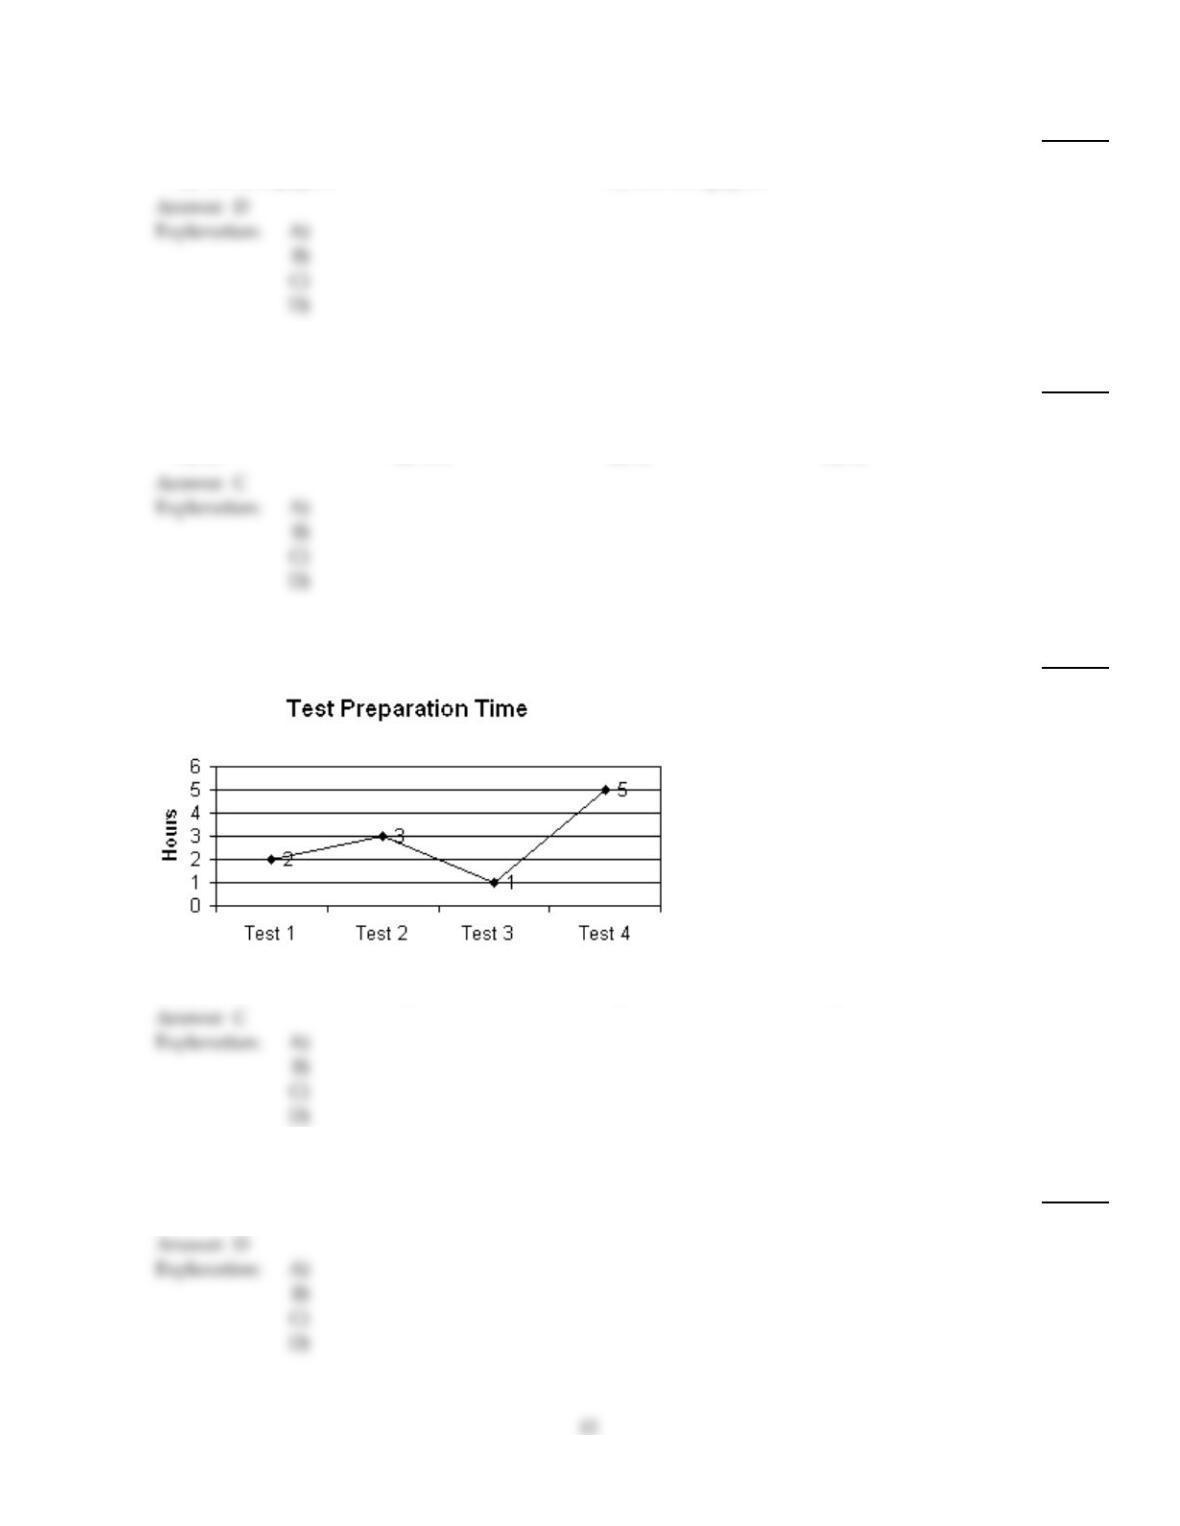
28)
Use the graph to determine how many hours were needed to prepare for Test 4.
28)
A)
2
B)
4
C)
5
D)
3
Find the mode or modes for the list of numbers.
29)
Number of samples taken each day: 5, 9, 52, 3, 2, 8, 61, 1, 4, 16
29)
A)
15.5 samples
B)
9 samples
C)
8 samples
D)
No mode
Solve the problem.
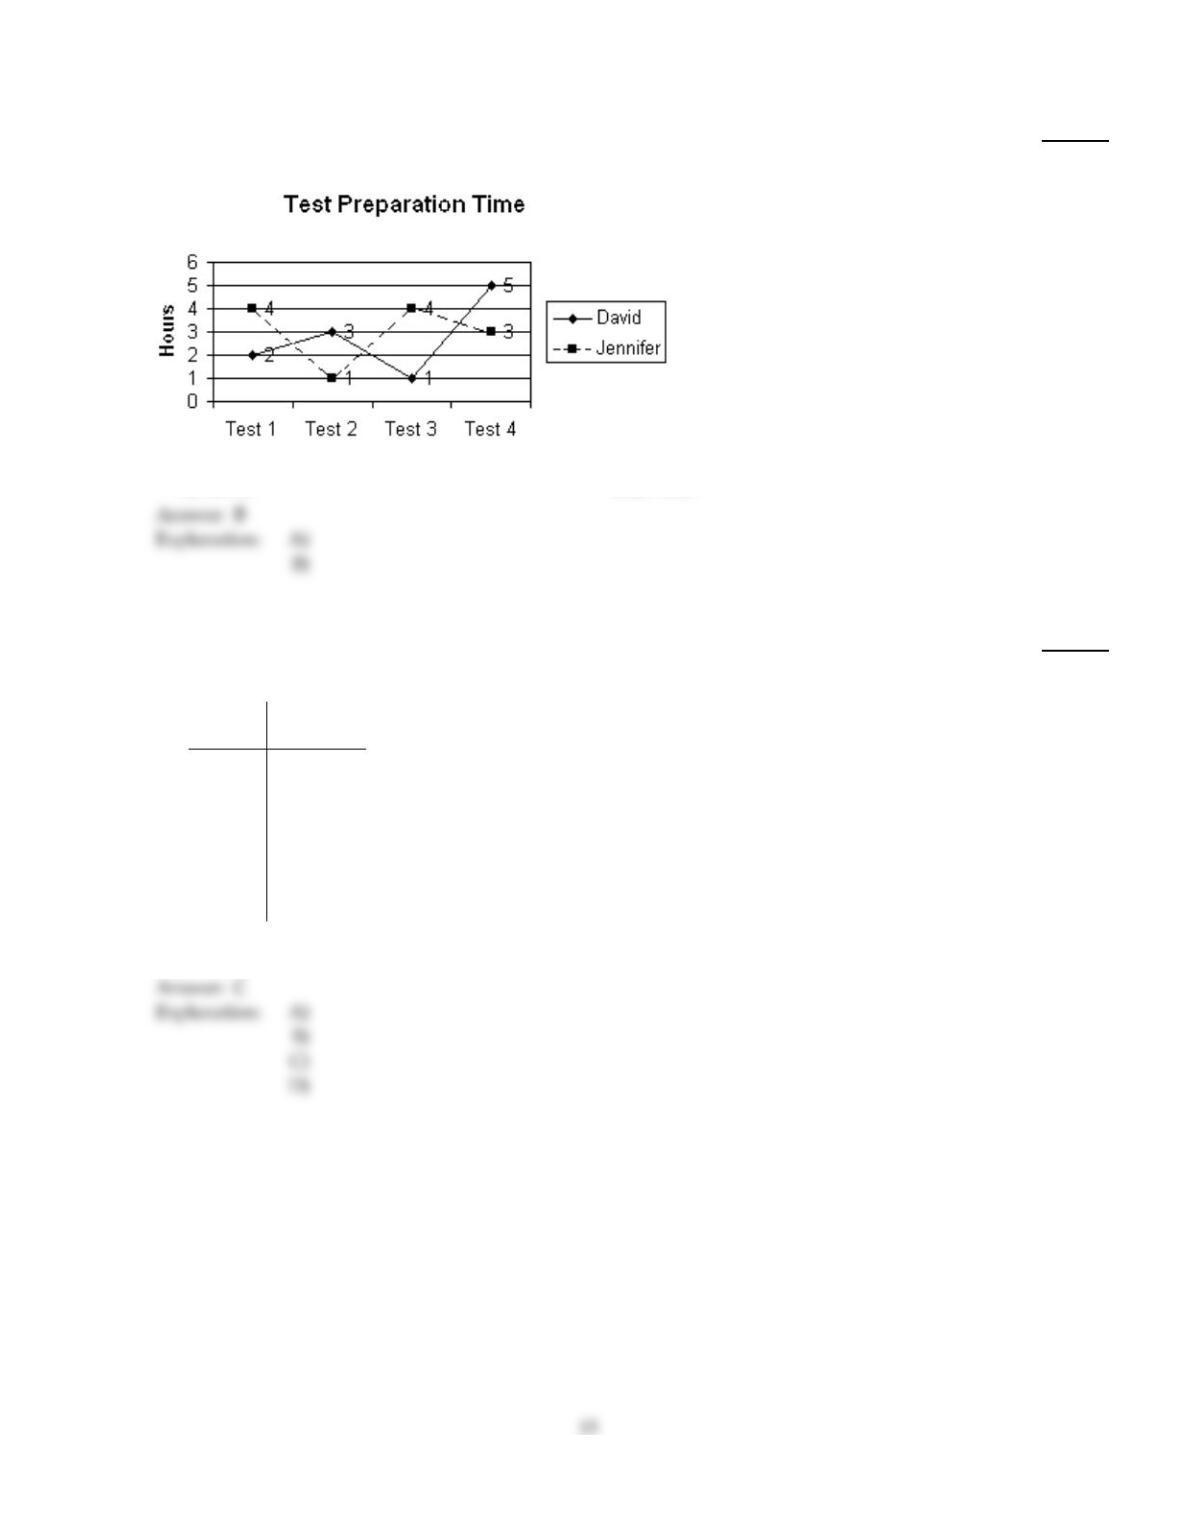
30)
Use the comparison line graph to determine who needed more time to prepare for Test 1, Jennifer
or David.
30)
A)
David
B)
Jennifer
Find the weighted mean of the numbers in the table. Round to the nearest tenth.
31)
A telephone company kept track of the calls for the correct time during a 24–hour period for two
weeks. The results are shown in the table.
Number
of Calls Frequency
59 1
60 2
61 3
62 4
63 2
64 1
65 1
31)
A)
62.0 calls
B)
61.6 calls
C)
61.8 calls
D)
59.6 calls
Provide an appropriate response.
32)
Which kind of graph should be used with two sets of data?
32)
A)
Double–bar graph or line graph
B)
Bar graph or comparison line graph
C)
Bar graph or line graph
D)
Double–bar graph or comparison line graph
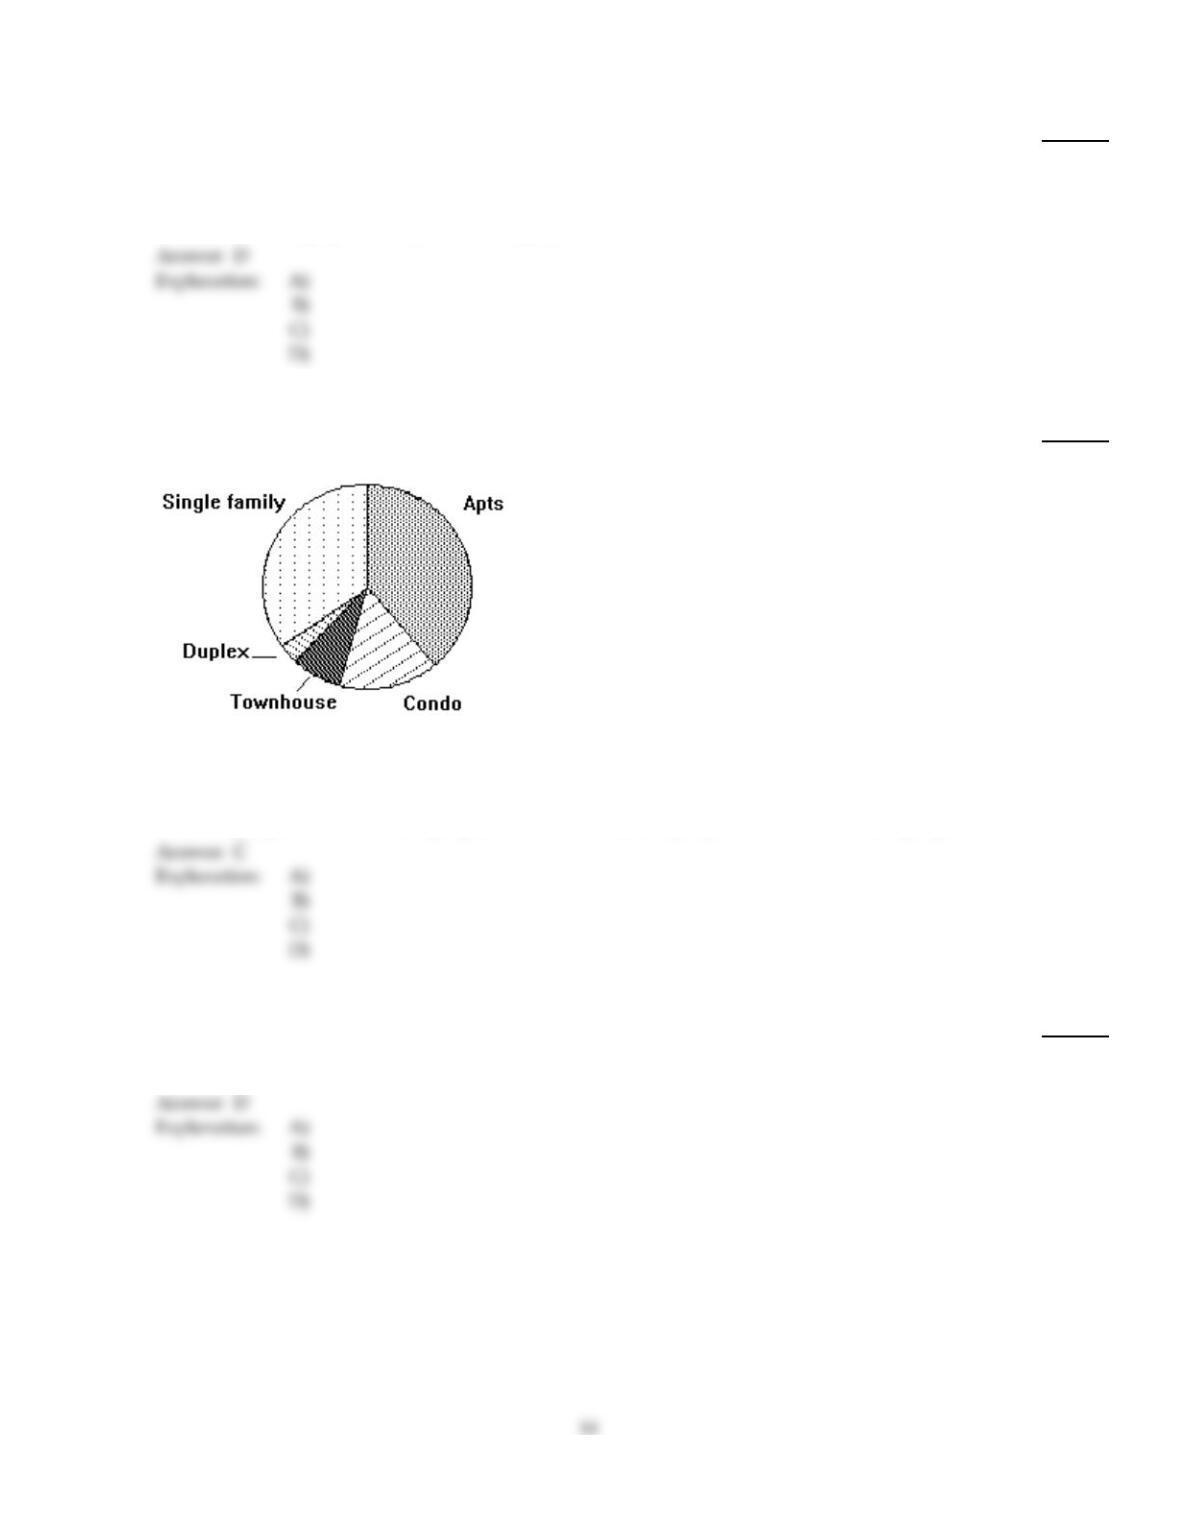
Use the circle graph to solve the problem.
33)
The circle graph shows the percent of the total population of 79,700 of Springfield living in the
given types of housing.
40%34%
1%
6% 19%
Find the number of people who live in townhouses. Round your result to the nearest whole
number.
33)
A)
797 people
B)
6 people
C)
4782 people
D)
74,918 people
Find the mean for the list of numbers.
34)
Scores on a math test: 70%, 48%, 70%, 97%, 48%
Round answer to the nearest whole number if necessary.
34)
A)
48%
B)
66%
C)
97%
D)
67%
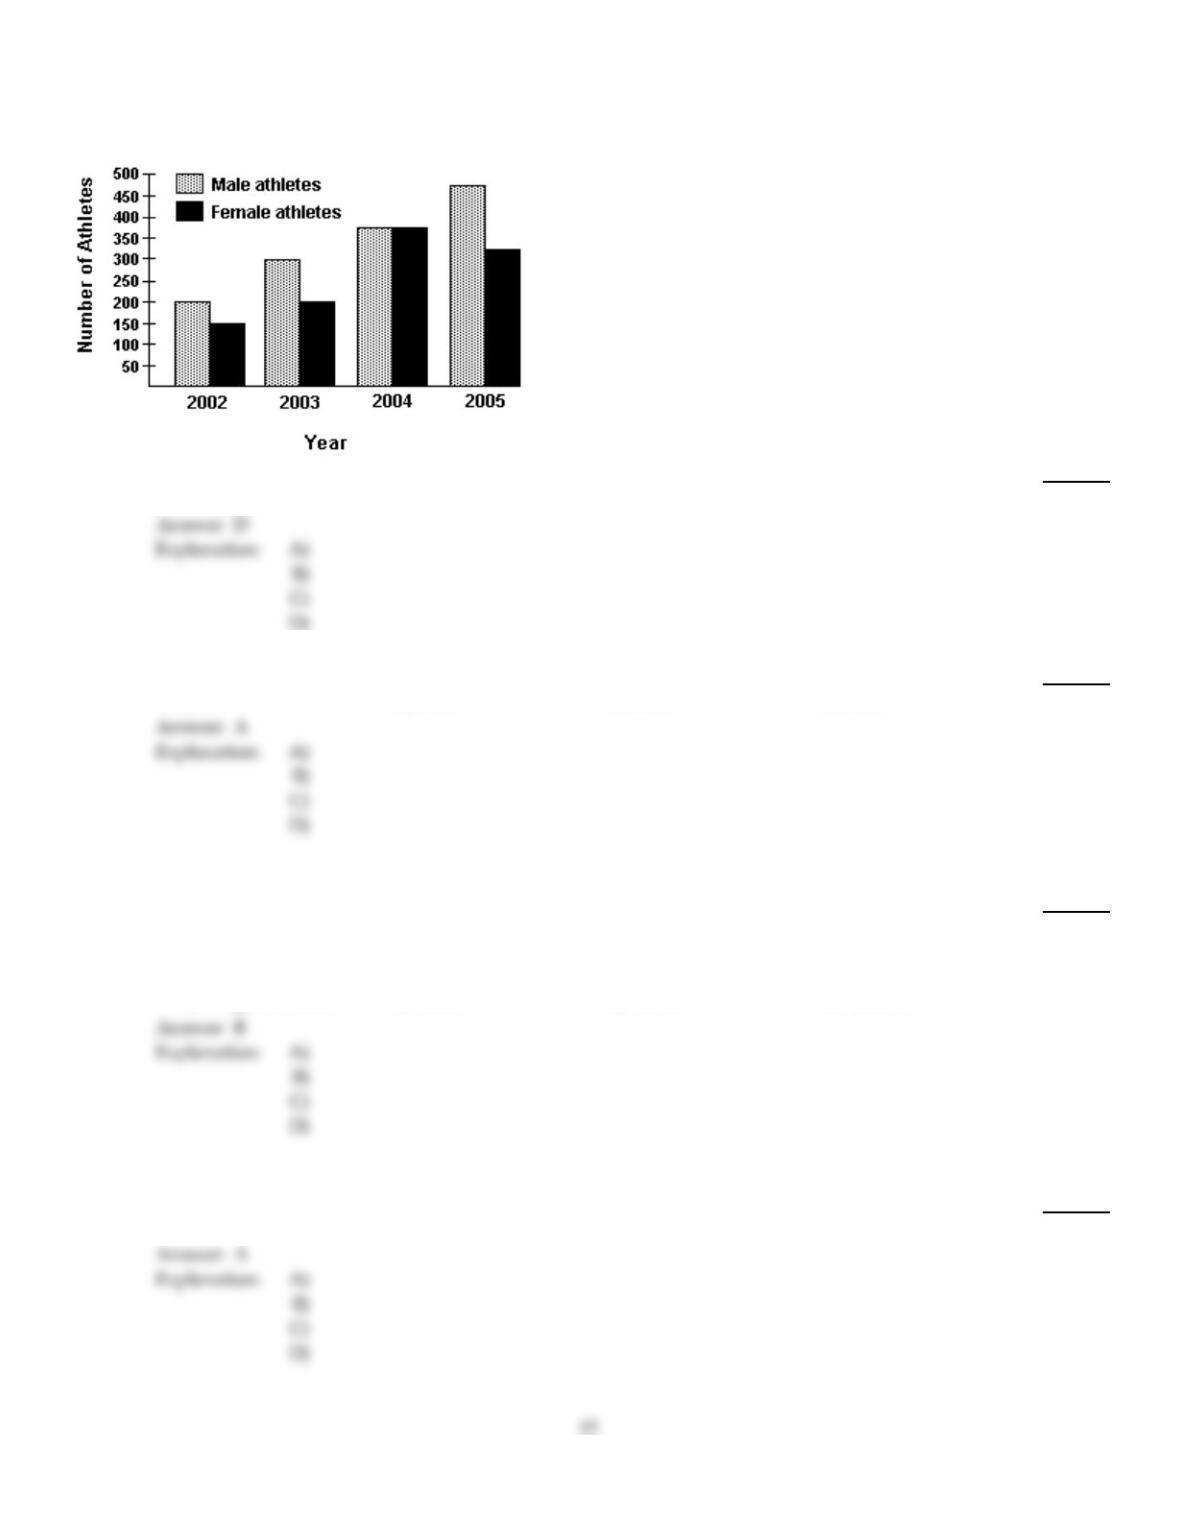
Refer to the double–bar graph below which shows the number of male and female athletes at a university over a
four–year period. Solve the problem.
35)
Find the increase in the number of female athletes from 2003 to 2005.
35)
A)
225
B)
150
C)
175
D)
125
36)
What is the only year in which the number of female athletes declined from its previous value?
36)
A)
2005
B)
2004
C)
2002
D)
2003
Provide an appropriate response.
37)
In the first game last week a baseball player had 0 hits in 5 times at bat. In the second game he went
0 for 5, and in the third game he had 0 hits in 4 times at bat. In the double header the next day he
was 2 for 3 and 1 for 2. Which measure of central tendency would be best to use to find his
average?
37)
A)
Weighted mean
B)
Mean
C)
Mode
D)
Median
Find the median for the data given.
38)
Number of customers at concession stand: 44, 20, 8, 8, 25, 12, 22, 44, 37, 36
38)
A)
23.5 customers
B)
26 customers
C)
25 customers
D)
22 customers
Find the mean for the list of numbers.
39)
Cans of soup used by a family in a month: 3, 4, 9, 4, 11, 7
Round answer to the nearest whole number if necessary.
39)
A)
4 cans
B)
9 cans
C)
6 cans
D)
5 cans
Refer to the double–bar graph below which shows the number of male and female athletes at a university over a
four–year period. Solve the problem.
40)
In which year did the greatest difference between the number of male athlete and female athletes
occur? Find the difference.
40)
A)
2005; 150 athletes
B)
2003; 100 athletes
C)
2005; 100 athletes
D)
2005; 200 athletes
41)
Find the increase in the number of male athletes from 2004 to 2005.
41)
A)
475
B)
100
C)
50
D)
75
Use the circle graph to solve the problem.
42)
The circle graph below gives the inventory of the women’s department of a store.
Coats
$30,105 Dresses
$28,098
Lingerie Skirts
$4014 $7359
Slacks Socks
$12,711 Blouses $2676
$5352
What is the total inventory?
42)
A)
$90,315
B)
$62,217
C)
$92,991
D)
$87,639
Find the grade point average for a student earning the following grades. Assume A = 4, B = 3, C = 2, D = 1, and F = 0.
Round answer to the nearest hundredth.
43)
Credits Grade
4 A
5 A
1 C
43)
A)
4.39
B)
11.00
C)
3.80
D)
4.13
Use the circle graph to solve the problem.
44)
A survey of the 5743 vehicles on the campus of State University yielded the following circle graph.
7%
18%36%
8%
2%
29%
Find the number of vans. Round your result to the nearest whole number.
44)
A)
172
B)
459
C)
8
D)
5284
Find the grade point average for a student earning the following grades. Assume A = 4, B = 3, C = 2, D = 1, and F = 0.
Round answer to the nearest hundredth.
45)
Credits Grade
3 B
6 B
2 A
6 C
3 D
45)
A)
10.00
B)
3.85
C)
1.50
D)
2.50
Solve the problem.
46)
The batting averages of some of the players on the company softball team are 0.215,0.336,0.210,
0.333,0.224, 0.309, and 0.271. What is the mean of the batting averages of these players? Round to
the nearest thousandth.
46)
A)
0.316
B)
0.271
C)
0.285
D)
0.247
Provide an appropriate response.
47)
The local girls’ club wants to sell cookies to raise money. They surveyed 75 area stores to determine
which type of cookie they should sell to make the most money. In 10 stores chocolate fudge
sandwich cookies were the biggest seller. In 9 stores the favorite was sugar wafers. In 10 stores the
most popular was peanut butter cookies. In 29 stores the best seller was chocolate chip, and in 17
stores the favorite was oatmeal raisin. Which measure of central tendency should the girls’ club use
to make the choice?
47)
A)
Median
B)
Mean
C)
Mode
D)
Weighted mean
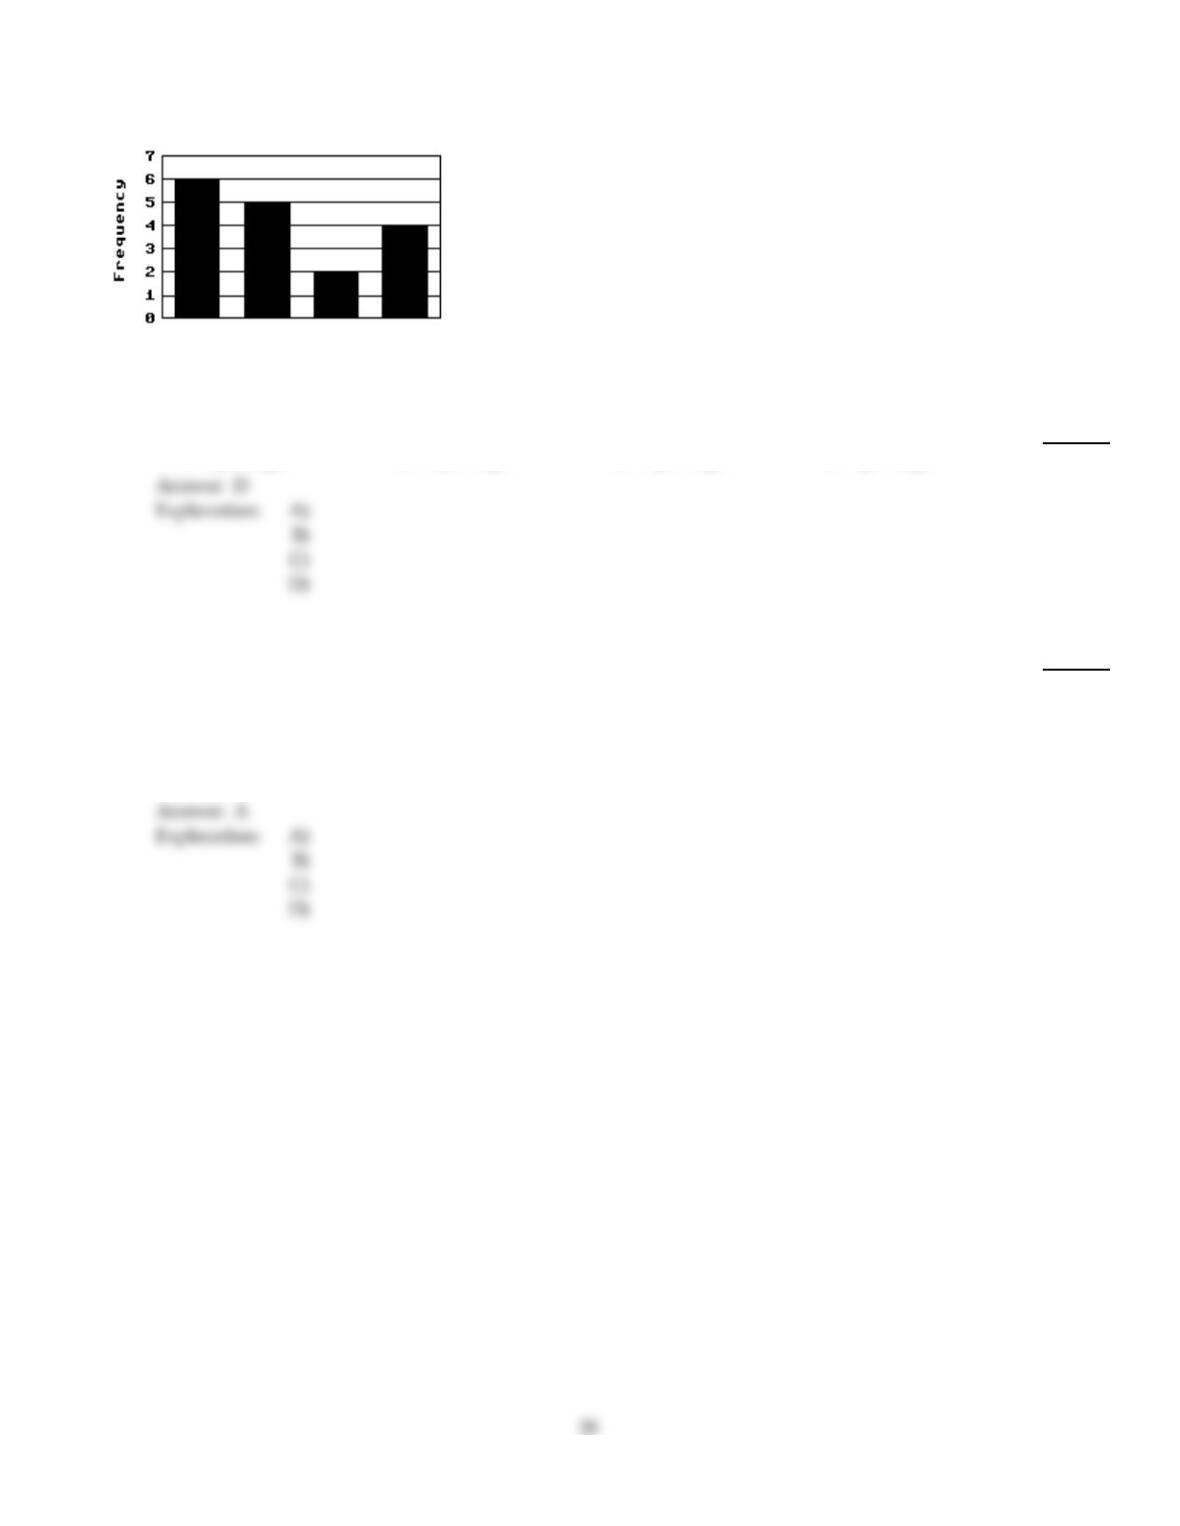
The post office recorded the weights of packages sent on a particular day and used the results to construct a histogram.
Use the histogram to solve the problem.
0–910–19 20–29 30–39
Weight of Package (pounds)
48)
How many packages weighed between 20 and 39 pounds?
48)
A)
2 packages
B)
11 packages
C)
6 packages
D)
7 packages
Provide an appropriate response.
49)
English classes at Jonesburg High School have enrollments of 25, 40, 31, 28, 23, 36, 38, 35, 20, and 32
students. Which measure of central tendency gives the best average class size?
49)
A)
Median
B)
Mean
C)
Mode
D)
Weighted mean
The post office recorded the weights of packages sent on a particular day and used the results to construct a histogram.
Use the histogram to solve the problem.
0–910–19 20–29 30–39
Weight of Package (pounds)
50)
How many packages weighed between 10 and 29 pounds?
50)
A)
6 packages
B)
11 packages
C)
13 packages
D)
7 packages
Provide an appropriate response.
51)
A small company allows its employees to use “flex–time” to decide whether to work full–time,
half–time, or quarter–time. Of its 50 employees, 20 choose to work full–time, 12 are parents with
small children who choose to work half–time, and 18 are students who work quarter–time after
school and on Sundays. Which measure of central tendency would be best to use for measuring the
average number of hours worked by the employees?
51)
A)
Weighted mean
B)
Mean
C)
Mode
D)
Median