
Chapter 7 – Nonlinear Optimization Models
1. Which of the following is not one of the reasons an optimization model can become nonlinear?
a.
Nonconstant returns to scale.
b.
The model objective is to minimize the sum of squared differences.
c.
The model objective is a function of a variable times multiplied by a function of that same variable
d.
The model objective is to minimize the sum of absolute errors.
d
1
2. Which of the following is not one of the common types of nonlinear models?
a.
Pricing models.
b.
Advertising and response selection models.
c.
Network flow models.
d.
Portfolio optimization models.
1
3. A function is concave if:
a.
its slope is always nondecreasing
b.
a line drawn connecting two points on the curve never lies below the curve
c.
its slope is always nonincreasing
d.
it is always positive
1
4. If a convex function is multiplied by a negative constant, the result:
a.
is convex
b.
is concave
c.
could be either convex or concave, depending on the value of the constant
d.
is linear
b
1
5. Which of the following is not one of the conditions for maximization in a nonlinear problem?
a.
The objective function is concave
b.
The logarithm of the objective function is concave
c.
The starting values are bounded
d.
The constraints are linear
1
6. If you try different starting values for the changing cells and obtain different solutions:
a.
you can be confident there is no solution
b.
there must be a mistake in your objective function
c.
there must be a mistake in one of your constraints
d.
you can keep the best solution you have found and hope that it is indeed optimal

Chapter 7 – Nonlinear Optimization Models
d
1
7. Which of the following is not one of the useful options within Solver’s Multistart box?
a.
Population size
b.
Error distribution
c.
Random seed
d.
Upper or lower bound constraints on all changing cells
b
1
8. In pricing models, elasticity of demand is an input with specifies the:
a.
range of demand
b.
level of demand
c.
sensitivity of price to changes in demand
d.
sensitivity of demand to changes in price
d
1
9. Which of the following types of fit should be selected in Excel’s Trendline function if a constant elasticity curve is to be
used to model demand?
a.
Exponential
b.
Logarithmic
c.
Polynomial
d.
Power
d
1
10. As an objective, minimizing the sum of squared errors is equivalent to minimizing the
a.
root mean square error
b.
weighted sum of squared errors
c.
sum of absolute errors
d.
maximum absolute error
a
1
11. Relative to linear optimization models, nonlinear optimization models are typically more difficult to solve.
a.
True
b.
False
True
1
12. Solver can get stuck at a global optimum and never find the local optimum.
a.
True
b.
False

Chapter 7 – Nonlinear Optimization Models
False
1
13. Solver is guaranteed to solve certain types of nonlinear programming models.
a.
True
b.
False
True
1
14. A function is convex if a line drawn connecting two points on the curve never lies below the curve.
a.
True
b.
False
True
1
15. The sum of two concave functions is concave.
a.
True
b.
False
True
1
16. Solver is guaranteed to find the global minimum (if it exists) if the objective function is concave and the constraints
are linear.
a.
True
b.
False
False
1
17. In pricing models, two products are substitutes for each other if a larger price for one product tends to induce
customers to demand less of the other.
a.
True
b.
False
False
1
18. In advertising response models, a typical source of nonlinearity is a decreasing marginal effect, where each extra ad
gains fewer exposures than the previous ad.
a.
True
b.
False
True
1
19. In some nonlinear models, Solver will find the optimal solution only if the starting solution is reasonably close to the
optimal solution.
a.
True
b.
False
Chapter 7 – Nonlinear Optimization Models
True
1
20. The amount invested is one of the required inputs in a portfolio optimization model.
a.
True
b.
False
False
1
Exhibit 7-1
A company manufactures two products. If it charges price p1 for product 1 and price p2 for product 2, it can sell quantities
q1 = 55 − 3p1 + 2p2 and q2 = 75 + 2p1 − 2p2 for products 1 and 2, respectively. It costs the company $20 to produce a unit
of product 1 and $65 to produce a unit of product 2.
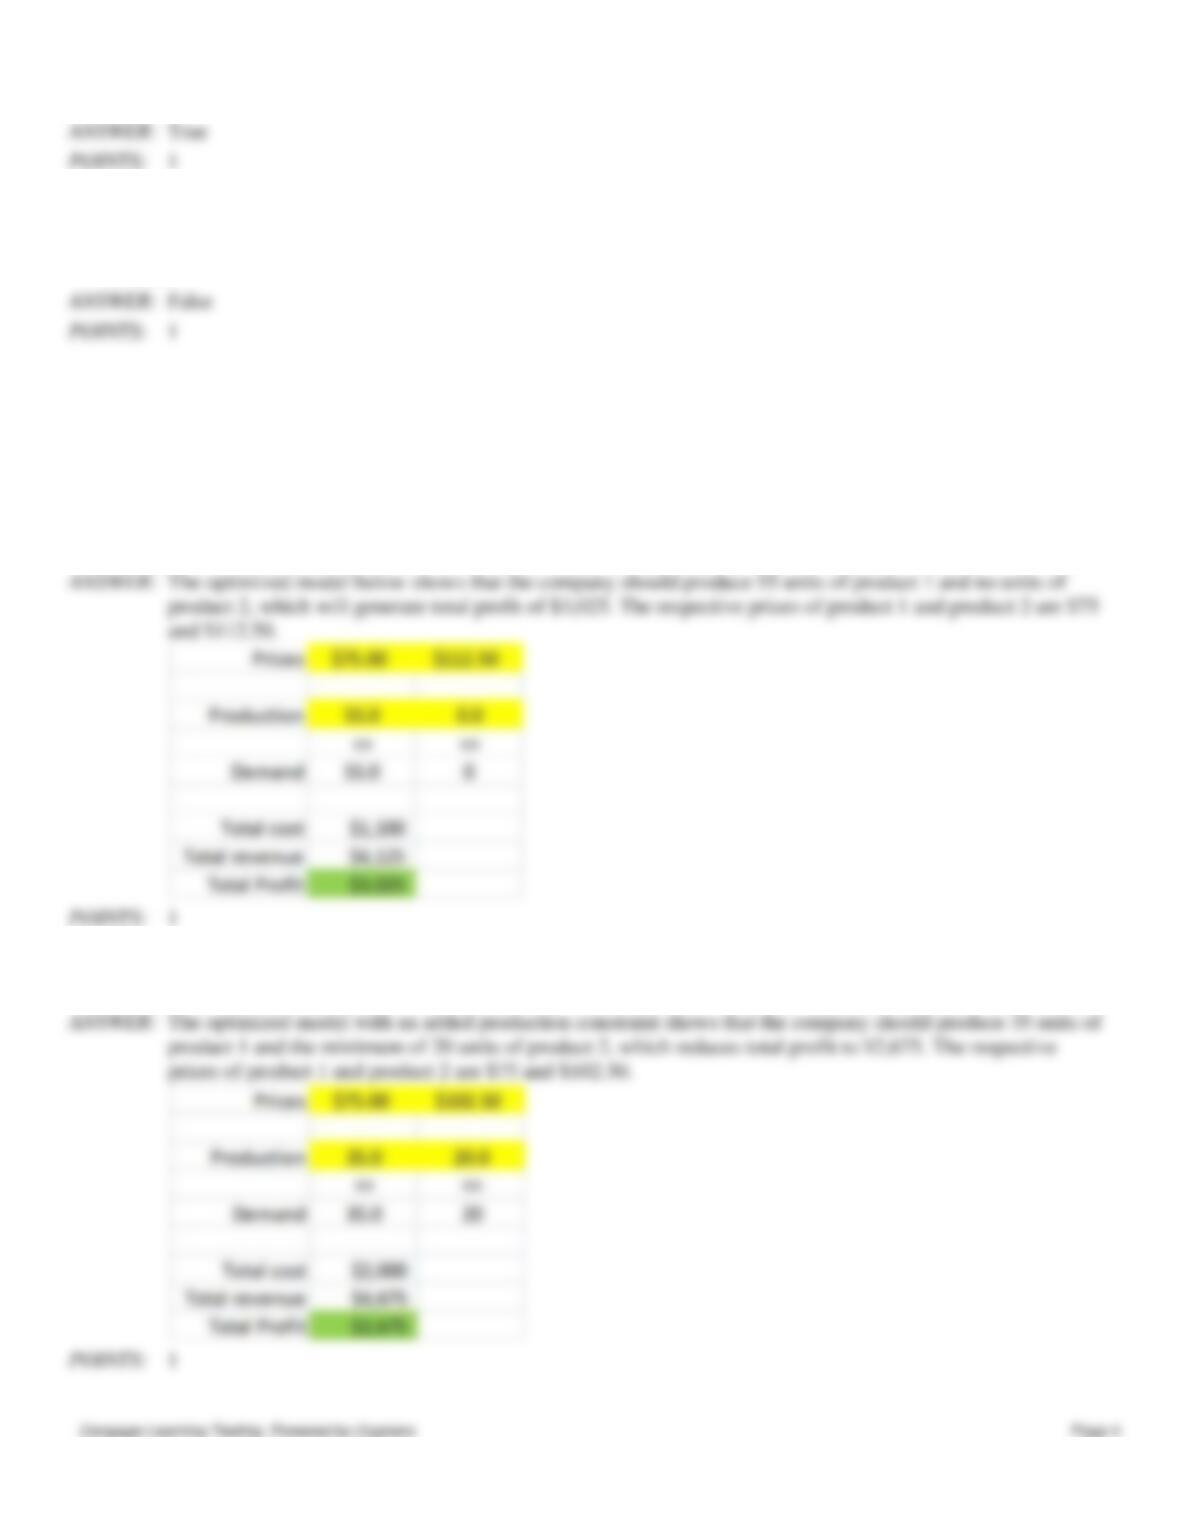
21. Refer to Exhibit 7-1. How many units of each product should the company produce? What prices should it charge, to
maximize profit?
1
22. Refer to Exhibit 7-1. Suppose the company must produce a minimum of 20 units of each product. How many units of
each product should the company produce in that case? What prices should it charge, to maximize profit?
1
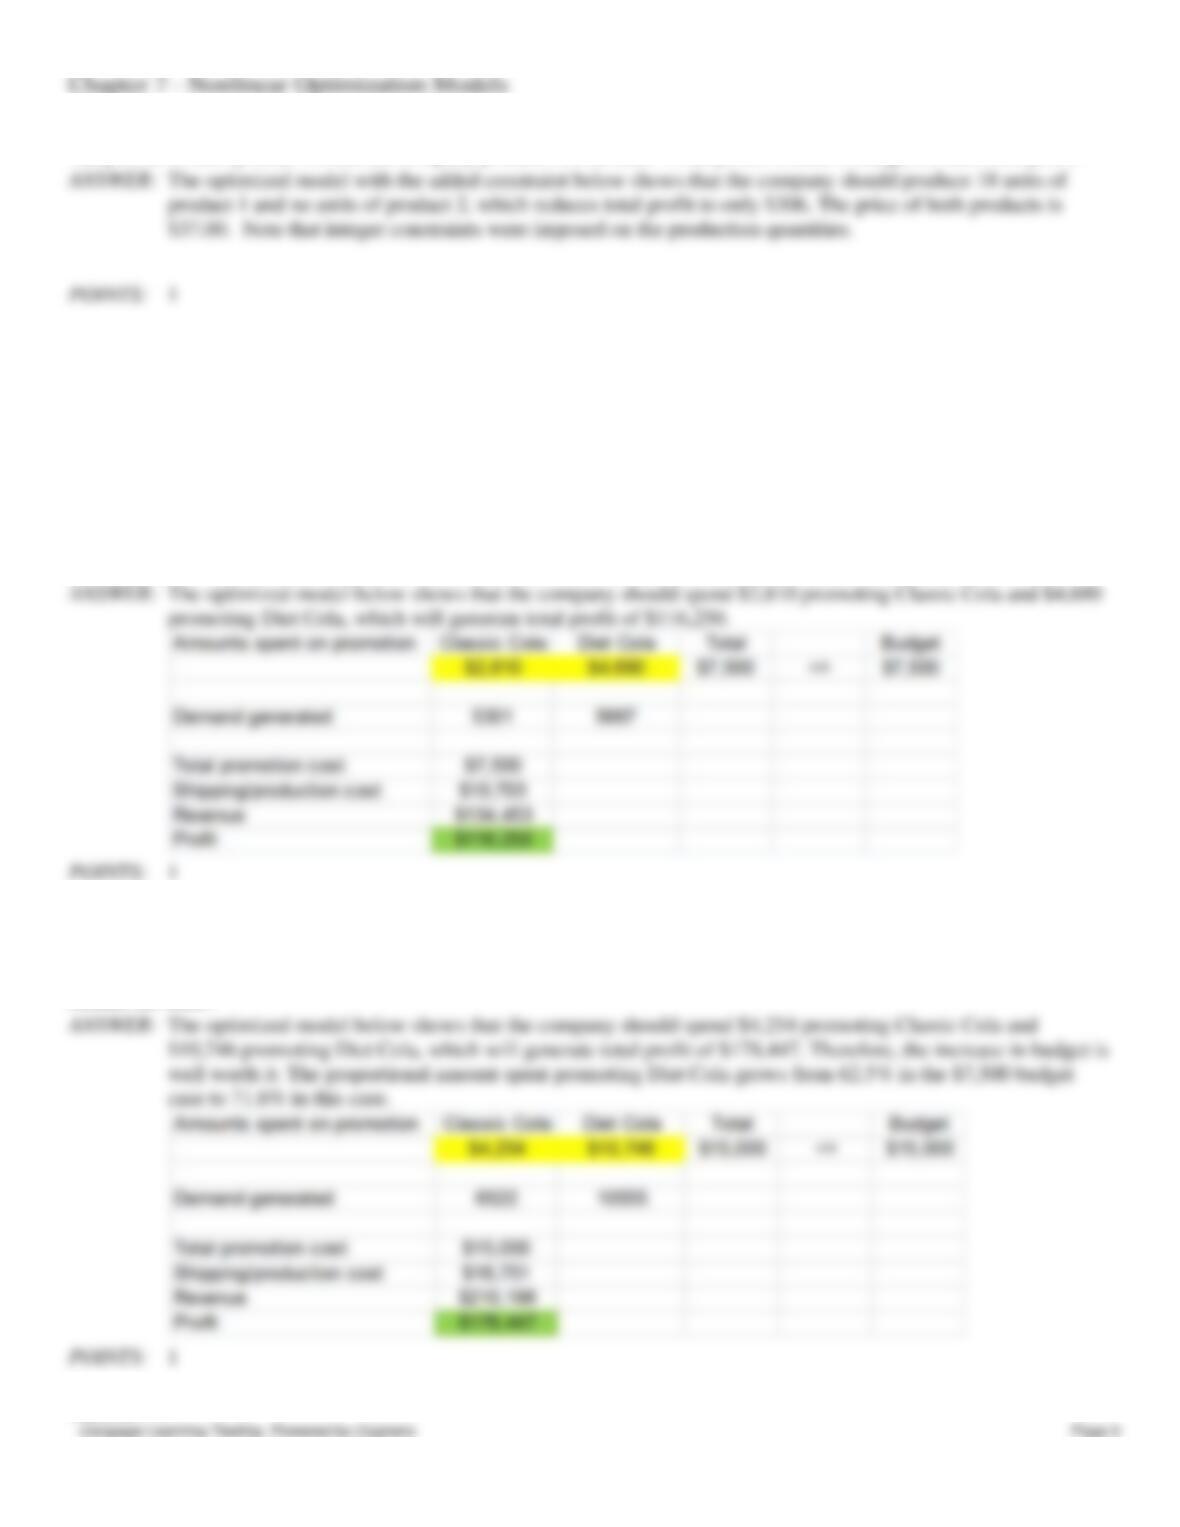
23. Refer to Exhibit 7-1. Suppose the company is required by regulation to charge the same price for both products. How
many units of each product should the company produce in that case? What prices should it charge, to maximize profit?
Exhibit 7-2
A soda producer makes and sells two products, Classic Cola and Diet Cola. During the planning period, if the producer
spends x1 dollars on promotion of Classic Cola, it can sell 100x10.5 cases of Classic Cola, and if it spends x2 dollars on
promotion of Diet Cola, it can sell 10x20.75 cases of Diet Cola. Each case of Classic Cola sells for $12.00 and costs $0.95
to produce and ship to customers, while each case of Diet Cola sells for $12.50 and costs $1.00 to produce and ship to
customers. A total of $7,500 is available for promotion during the planning period.
24. Refer to Exhibit 7-2. Formulate and solve a nonlinear optimization model to help this soda producer identify the best
promotional strategies for its two products.
25. Refer to Exhibit 7-2. Suppose the producer can double the promotional budget. Formulate and solve a nonlinear
optimization model to help this soda producer identify the best promotional strategies for its two products in that case.
Does the change in profit justify the budget increase? Does the proportional amount spent promoting the two products
remain the same?
Exhibit 7-3
Chapter 7 – Nonlinear Optimization Models
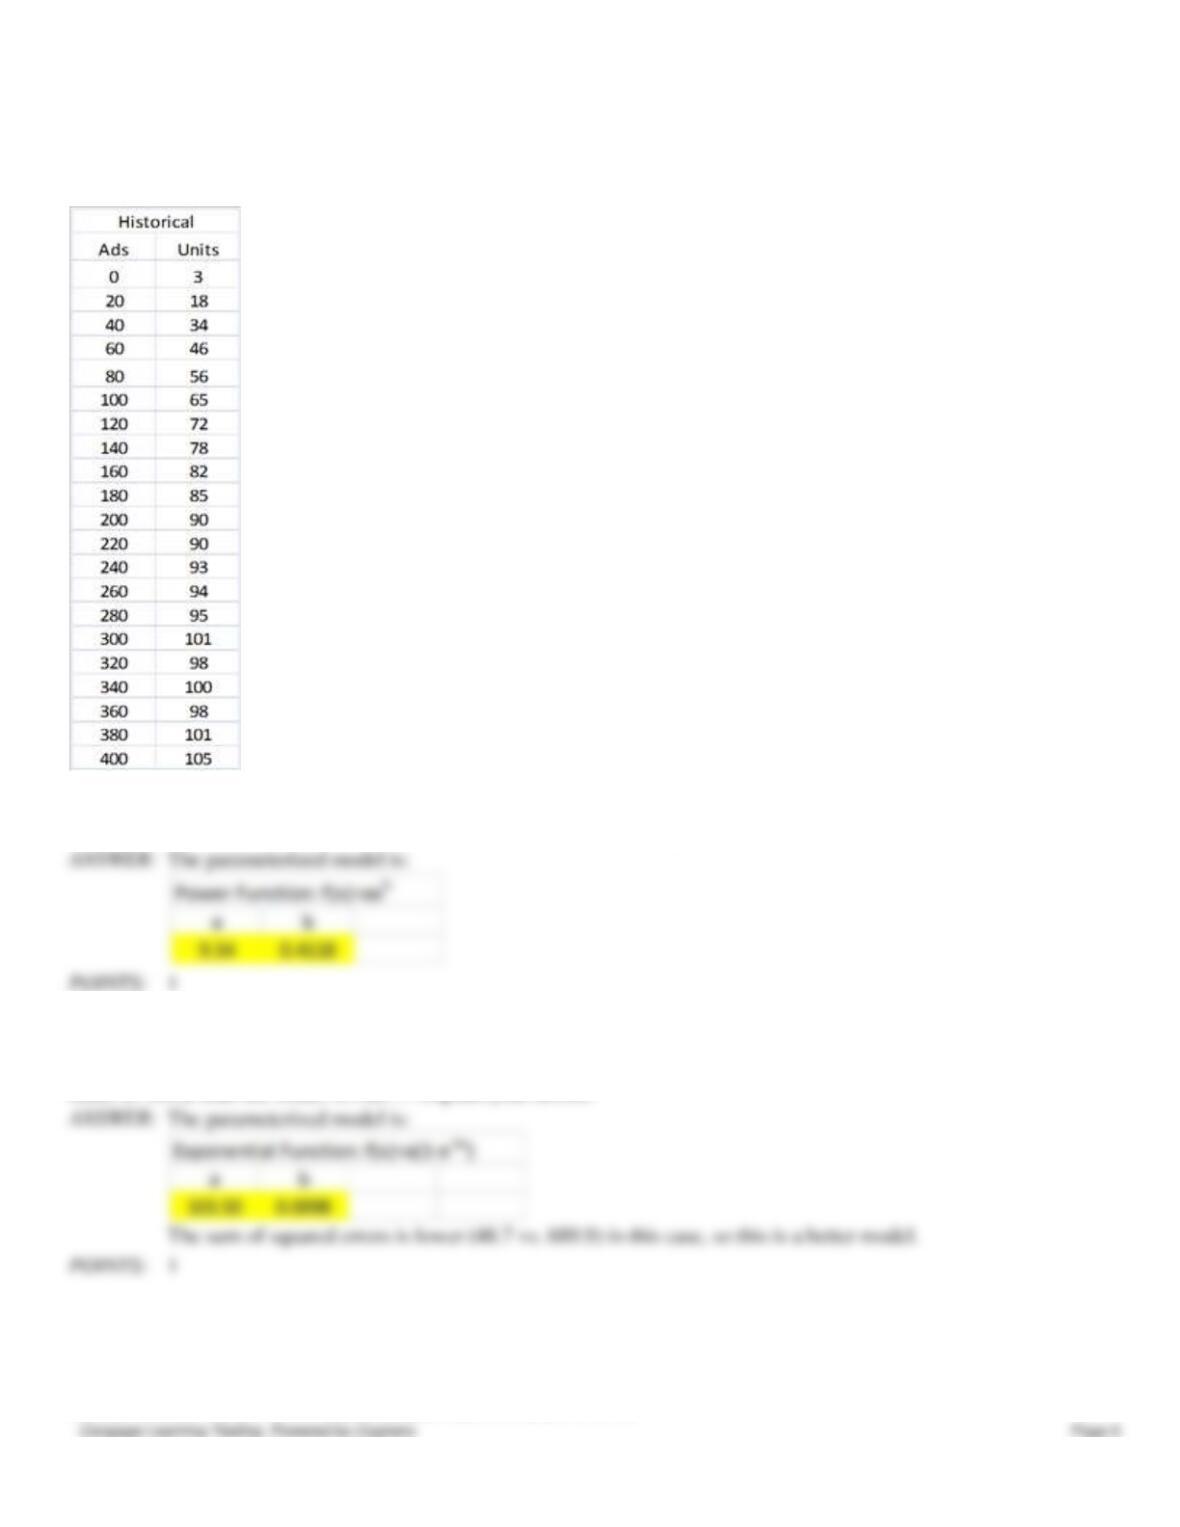
A company has the following historical data on the number of ad exposures and the corresponding number of units sold of
one of its products:
26. [Part 1] Refer to Exhibit 7-3. Formulate a nonlinear optimization model to find the parameters of a function of the
form: f(x) = axb to model demand for its product as a function of ad exposures (x).
27. [Part 2] Refer to Exhibit 7-3. Formulate a nonlinear optimization model to find the parameters of a function of the
form: f(x) = a(1 − e−bx) to model demand for its product as a function of ad exposures (x). In terms of fit, is this model
better or worse than the model in Part 1? Explain your answer
The sum of squared errors is lower (48.7 vs. 689.9) in this case, so this is a better model.
Exhibit 7-4
You are given the following means, standard deviations, and correlations for the annual return on three stocks. The means
are 0.08, 0.10, and 0.15. The standard deviations are 0.15, 0.20, and 0.30. The correlation between stocks 1 and 2 is 0.62,
between stocks 1 and 3 is 0.32, and between stocks 2 and 3 is 0.43.
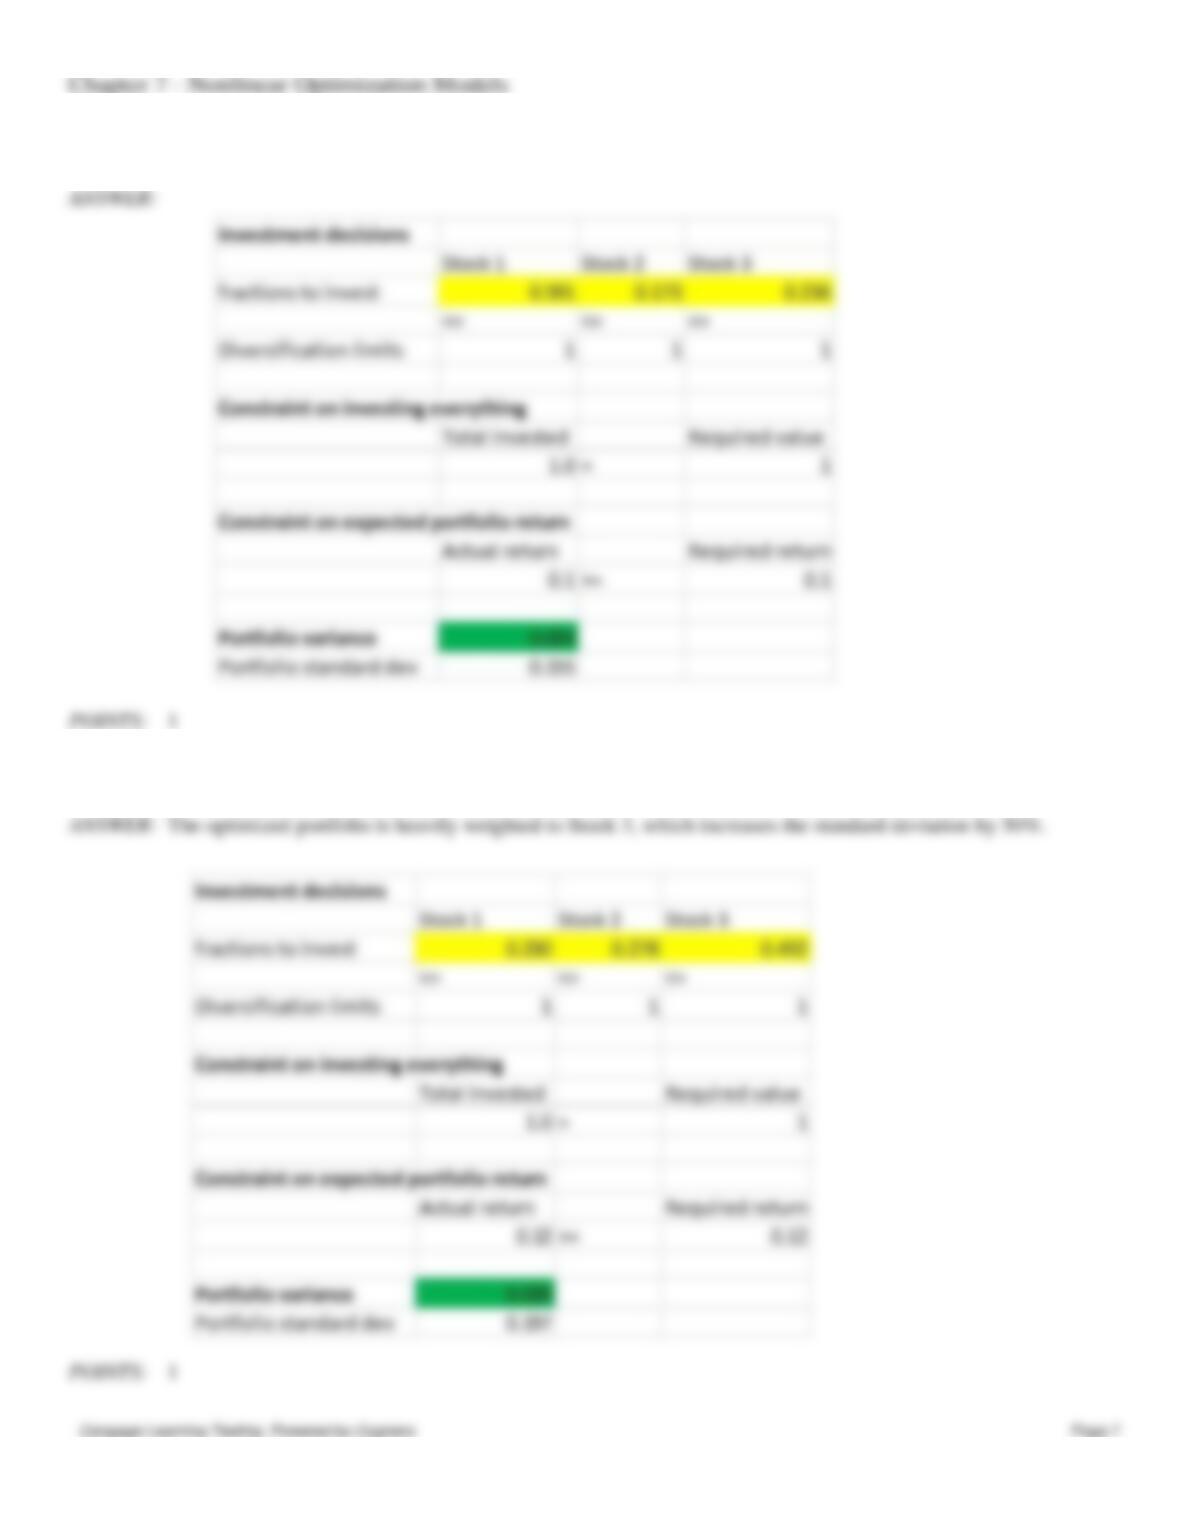
28. [Part 1] Refer to Exhibit 7-4. Determine the minimum variance portfolio that yields an expected annual return of at
least 0.10
29. [Part 2] Refer to Exhibit 7-4. Determine the minimum variance portfolio that yields an expected annual return of at
least 0.12. How has the portfolio changed from your answer in Part 1?
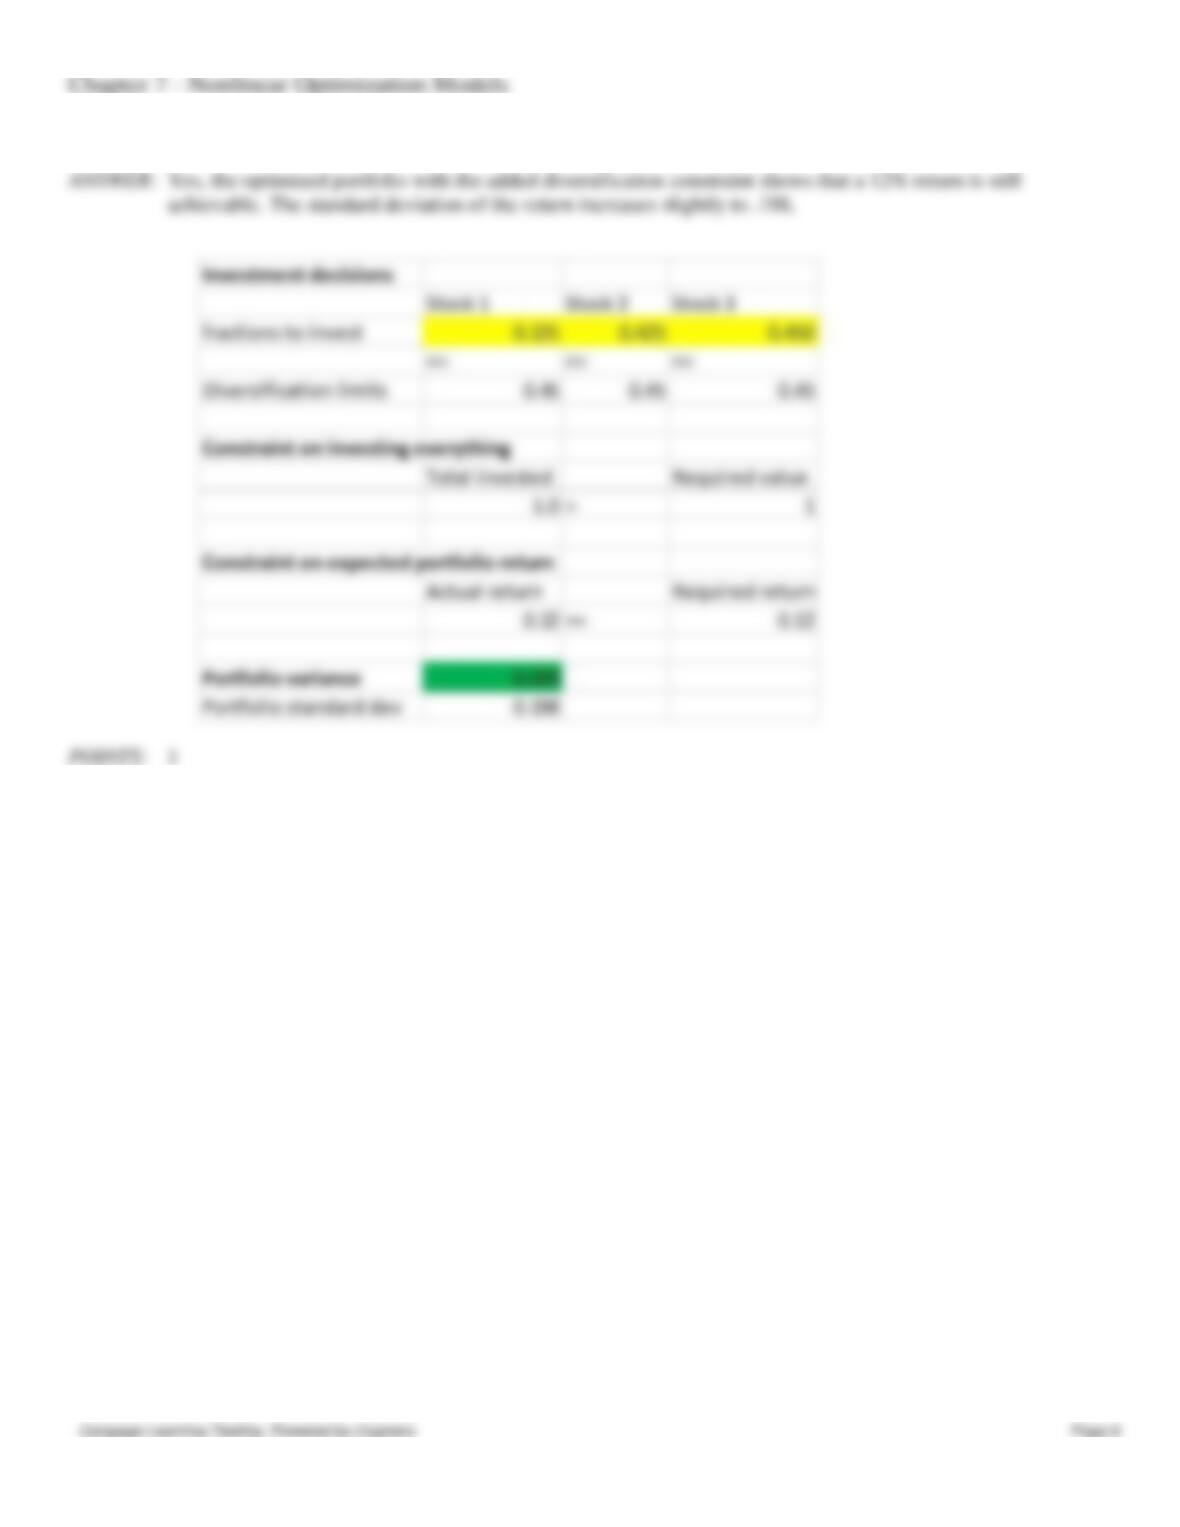
30. Refer to Exhibit 7-4. Suppose you set the weights in the portfolio to a maximum of 0.45 for each stock. Is it possible
to achieve a 12% return? What is the portfolio standard deviation in that case?