
Consumers, Producers, and the Efficiency of Markets 1833
70. Refer to Figure 7-12. If the equilibrium price rises from $200 to $350, what is the additional
producer surplus to initial producers?
a. $15,000
b. $3,750
c. $7,500
d. $30,000
71. Refer to Figure 7-12. If the equilibrium price rises from $200 to $350, what is the producer
surplus to new producers
a. $15,000
b. $3,750
c. $7,500
d.$30,000
1834 Consumers, Producers, and the Efficiency of Markets
Figure 7-13
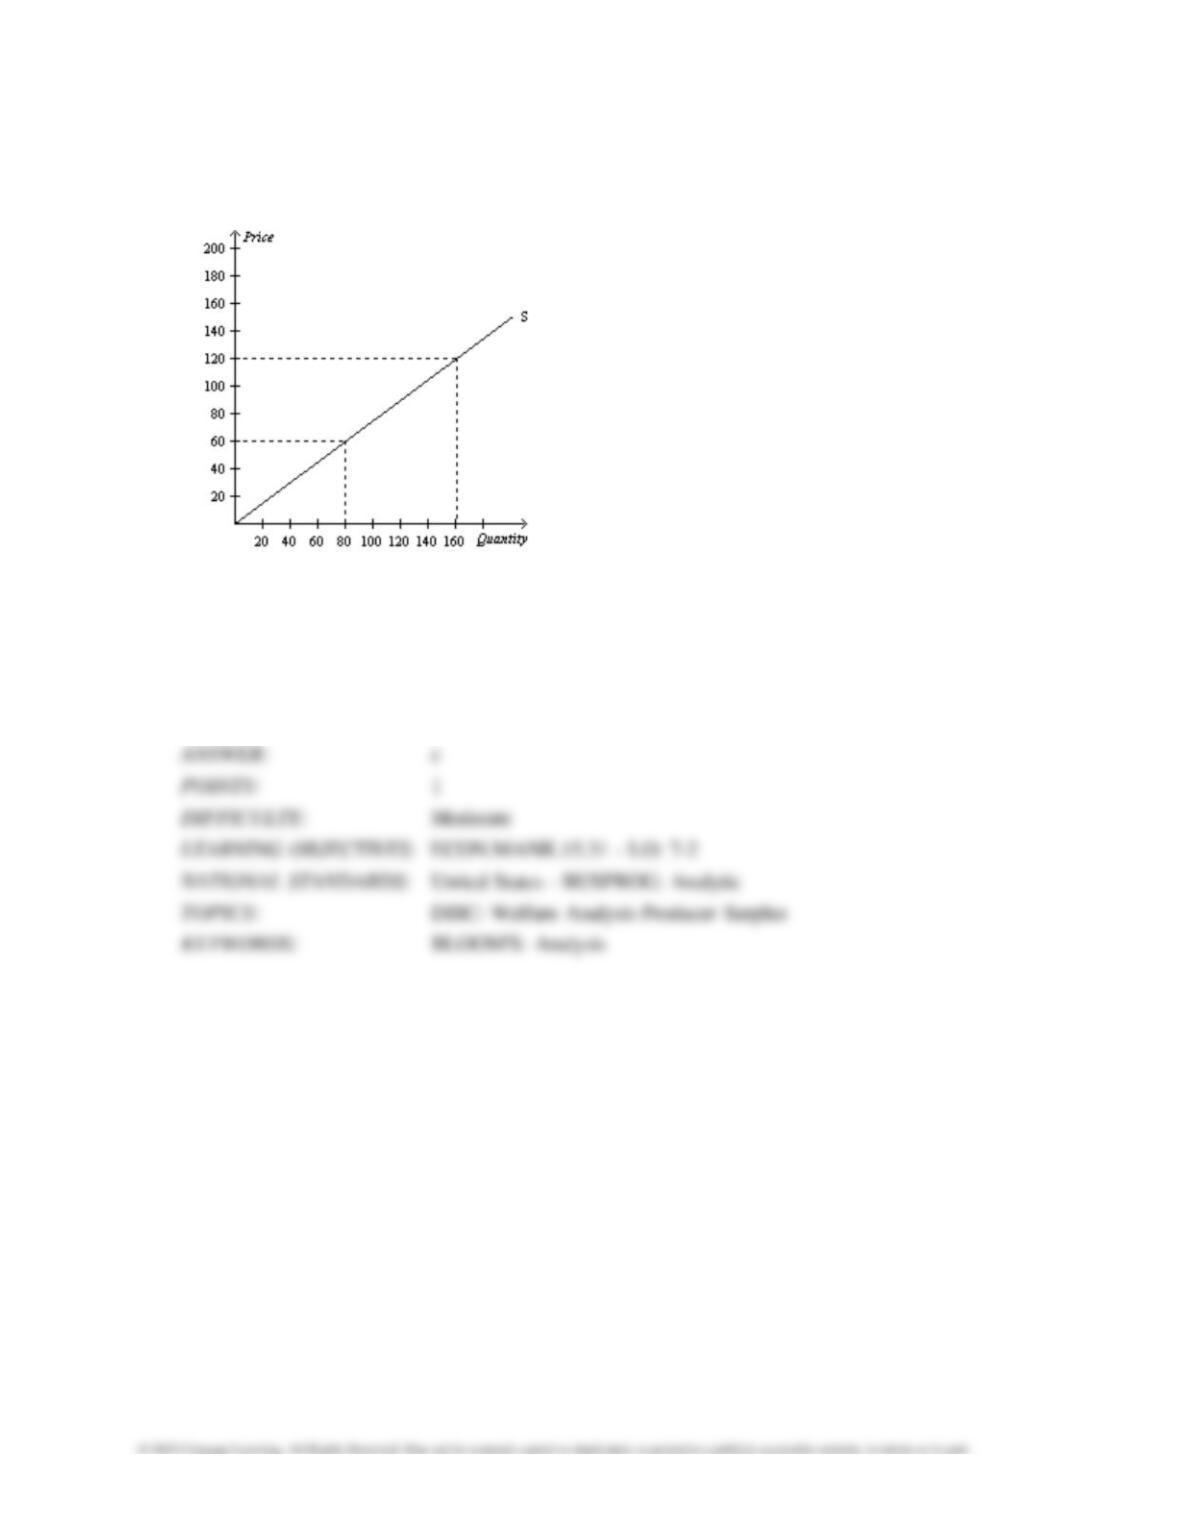
72. Refer to Figure 7-13. If the equilibrium price is $60, what is the producer surplus?
a. $600
b. $1,200
c. $2,400
d. $4,800
Consumers, Producers, and the Efficiency of Markets 1835
73. Refer to Figure 7-13. If the equilibrium price rises from $60 to $120, what is the additional
producer surplus to initial producers in the market?
a. $1,200
b. $2,400
c. $3,600
d. $4,800
74. Refer to Figure 7-13. If the equilibrium price rises from $60 to $120, what is the producer
surplus to new producer s in the market?
a. $1,200
b. $2,400
c. $3,600
d. $4,800
1836 Consumers, Producers, and the Efficiency of Markets
Figure 7-14
75. Refer to Figure 7-14. At the equilibrium price, producer surplus is
a. $800.
b. $400.
c. $450.
d. $900.
Consumers, Producers, and the Efficiency of Markets 1837
76. Refer to Figure 7-14. If the government imposes a price ceiling of $50 in this market, then the
new producer surplus will be
a. $200.
b. $100.
c. $125.
d. $250.
77. Refer to Figure 7-14. If the government imposes a price ceiling of $50 in this market, then
producer surplus will
a. $325.
b. $100.
c. $300.
d. $200.
1838 Consumers, Producers, and the Efficiency of Markets
78. Refer to Figure 7-14. If the market price increases to $130 due to an increase in demand, then
producer surplus is
a. $1,800.
b. $900.
c. $975.
d. $1,950.
Figure 7-15
Consumers, Producers, and the Efficiency of Markets 1839
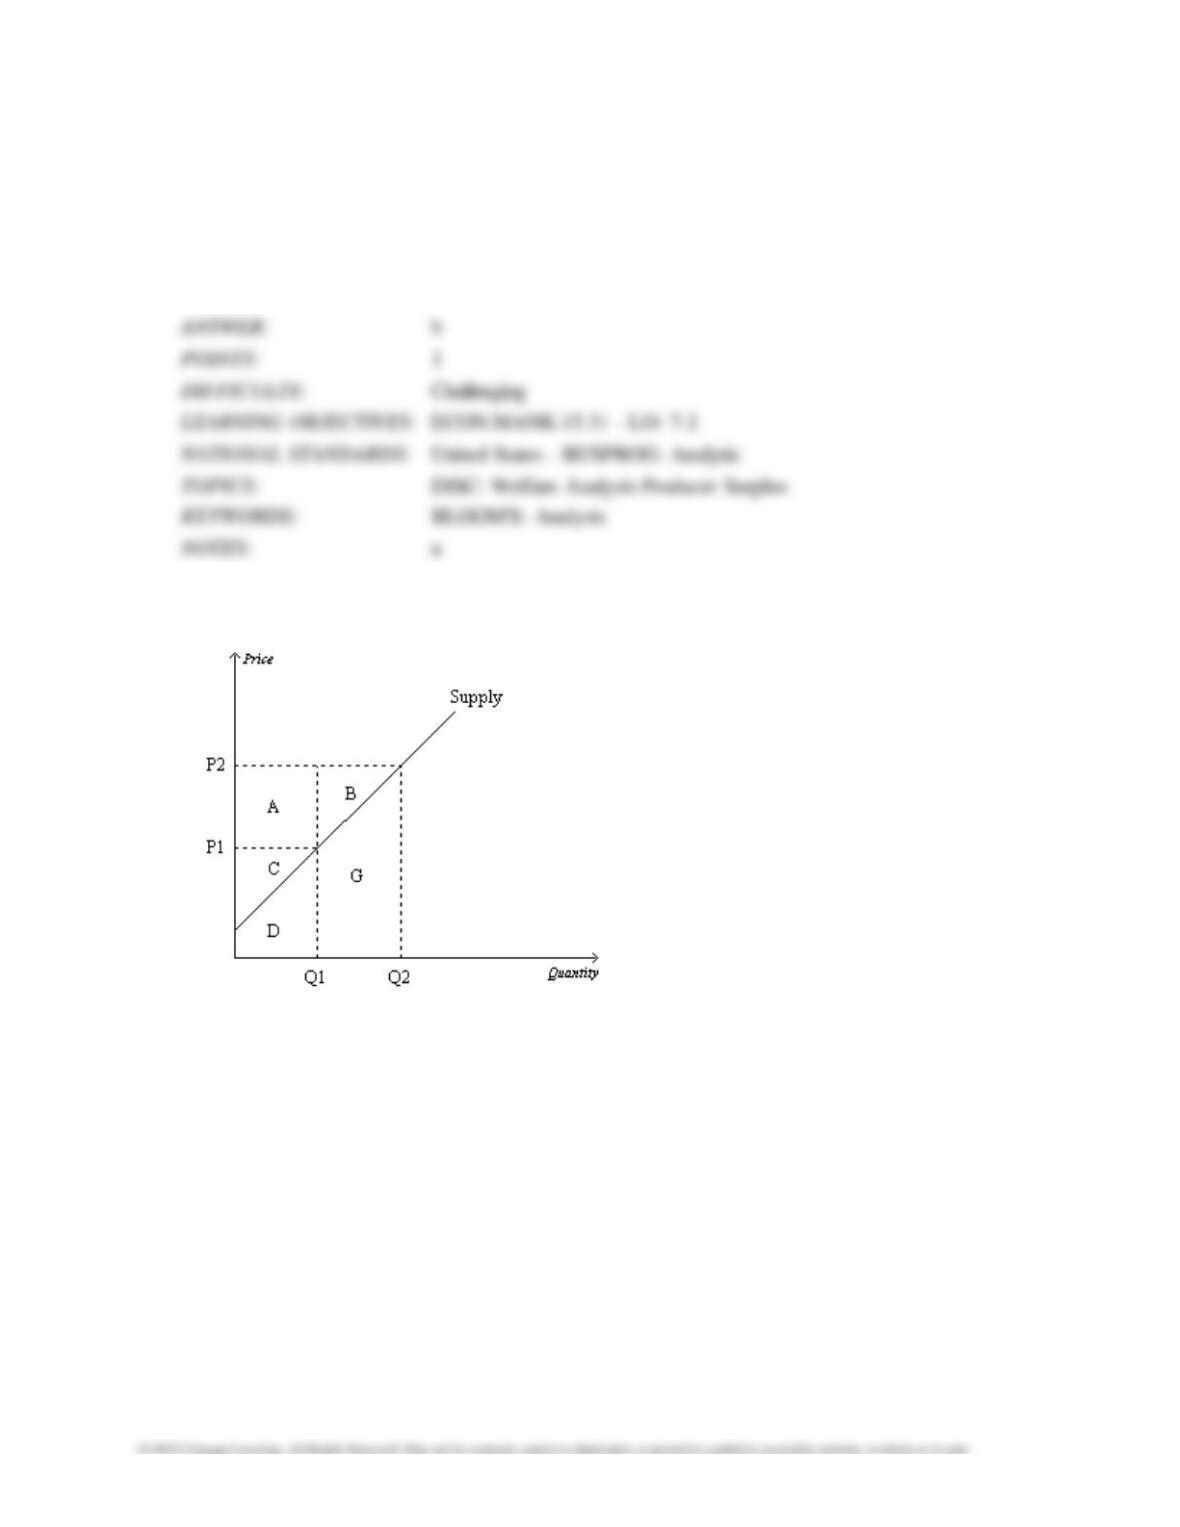
79. Refer to Figure 7-15. When the price is P2, producer surplus is
a. A.
b. A+C.
c. A+B+C.
d. D+G.
80. Refer to Figure 7-15. Suppose producer surplus is larger than C but smaller than A+B+C. The
price of the good must be
a. lower than P1.
b. P1.
c. between P1 and P2.
d. higher than P2.
1840 Consumers, Producers, and the Efficiency of Markets
81. Refer to Figure 7-15. When the price is P1, producer surplus is
a. A.
b. C.
c. A+B.
d. C+D.
82. Refer to Figure 7-15. When the price falls from P2 to P1, producer surplus
a. decreases by an amount equal to C.
b. decreases by an amount equal to A+B.
c. decreases by an amount equal to A+C.
d. increases by an amount equal to A+B.

Consumers, Producers, and the Efficiency of Markets 1841
83. Refer to Figure 7-15. When the price rises from P1 to P2, what area represents the increase in
producer surplus?
a. A
b. A+B
c. A+B+C
d. G
84. Refer to Figure 7-15. When the price rises from P1 to P2, which area represents the increase in
producer surplus to existing producers?
a. A
b. A+B
c. A+B+C
d. G
1842 Consumers, Producers, and the Efficiency of Markets
85. Refer to Figure 7-15. When the price rises from P1 to P2, which area represents the increase in
producer surplus due to new producers entering the market?
a. A
b. B
c. A+B
d. G
86. Refer to Figure 7-15. Area A represents
a. producer surplus to new producers entering the market as the result of an increase in price
from P1 to P2.
b. the increase in consumer surplus that results from an upward-sloping supply curve.
c. the increase in total surplus when sellers are willing and able to increase supply from Q1 to Q2.
d. the increase in producer surplus to those producers already in the market when the price
increases from P1 to P2.
Consumers, Producers, and the Efficiency of Markets 1843
87. Refer to Figure 7–15. Area B represents
a. the combined profits of all producers when the price is P2.
b. the increase in producer surplus to all producers as the result of an increase in the price from
P1 to P2.
c. producer surplus to new producers entering the market as the result of an increase in the price
from P1 to P2.
d. that portion of the increase in producer surplus that is offset by a loss in consumer surplus when
the price increases from P1 to P2.
88. Refer to Figure 7-15. When the price falls from P2 to P1, which of the following would not be
true?
a. The sellers who still sell the good are worse off because they now receive less.
b. Some sellers leave the market because they are not willing to sell the good at the lower price.
c. The total cost of what is now sold by sellers is actually higher than it was before the decrease
in the price.
d. Producer surplus would fall by area A + B.
1844 Consumers, Producers, and the Efficiency of Markets
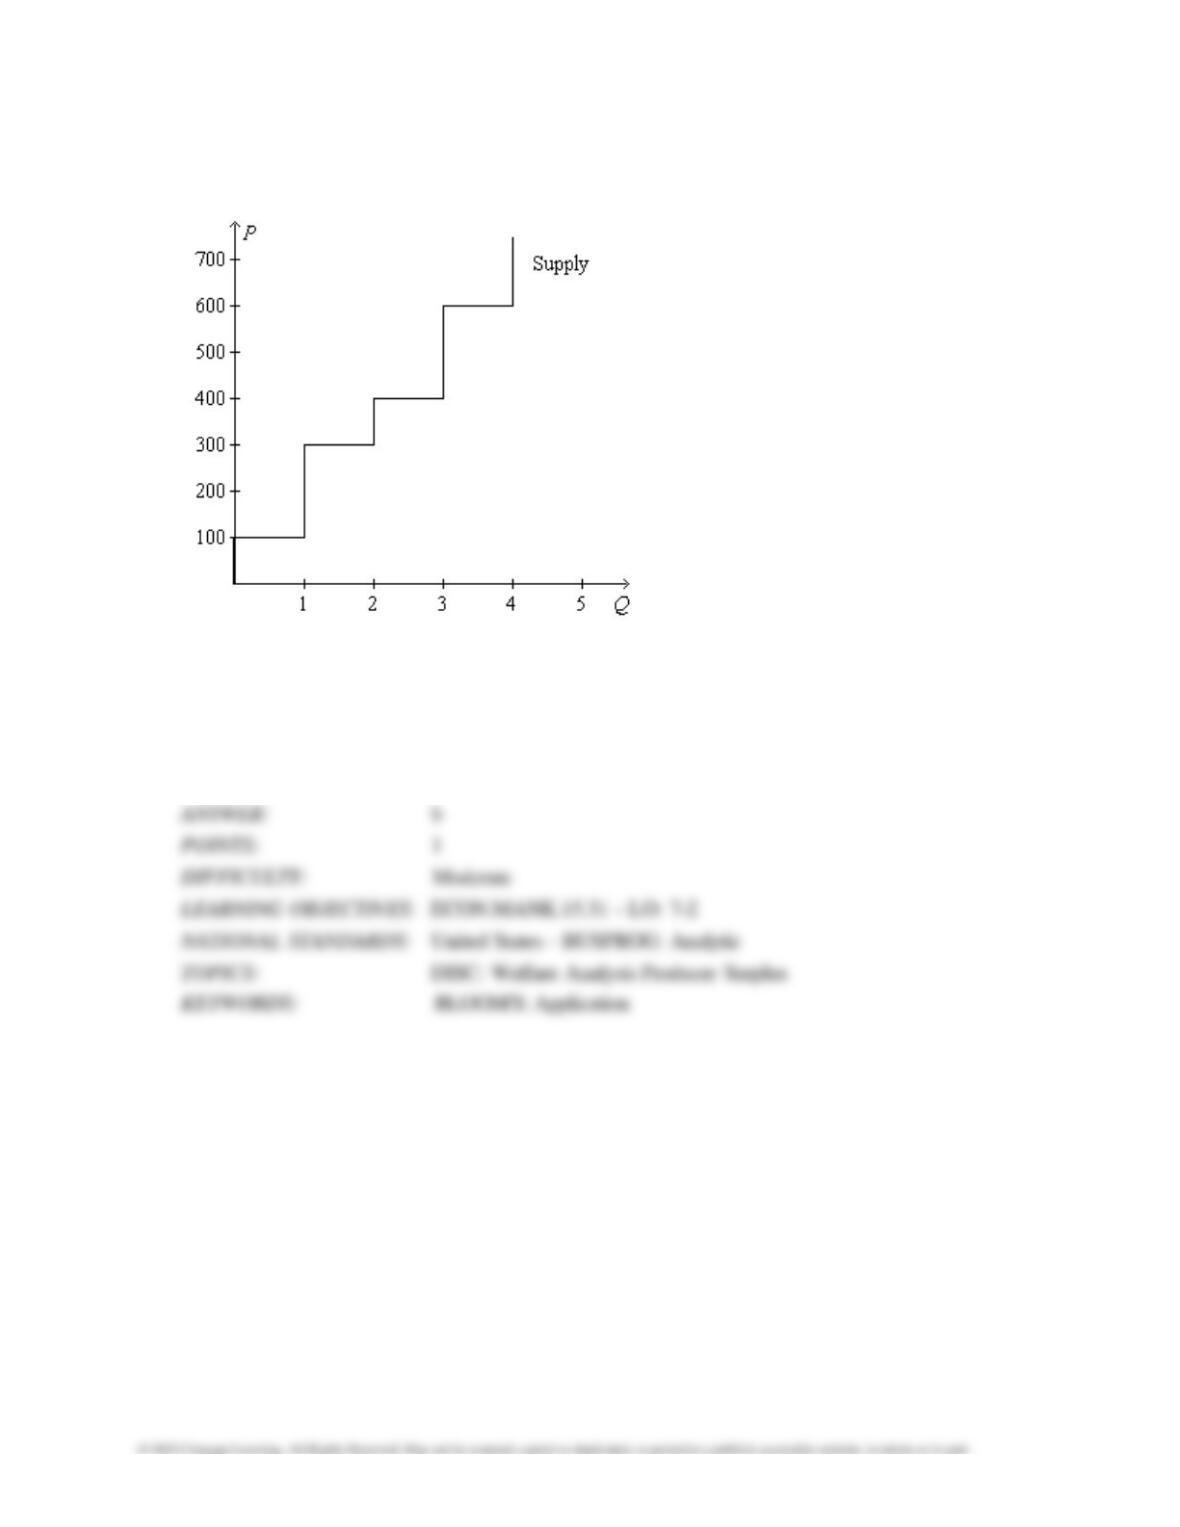
Figure 7-16
89. Refer to Figure 7-16. If the price of the good is $300, then producer surplus amounts to
a. $100.
b. $200.
c. $300.
d. $400.
Consumers, Producers, and the Efficiency of Markets 1845
90. Refer to Figure 7-16. If the price of the good is $500, then producer surplus amounts to
a. $450.
b. $575.
c. $700.
d. $800.
91. Refer to Figure 7-16. If the price of the good is $600, then producer surplus amounts to
a. $650.
b. $800.
c. $900.
d. $1,000.
1846 Consumers, Producers, and the Efficiency of Markets
92. Refer to Figure 7-16. If the price of the good is $600, then
a. consumer surplus is $800.
b. consumer surplus is $900.
c. producer surplus is $900.
d. producer surplus is $1,000.
93. Refer to Figure 7-16. Suppose the price of the good is $400. Then, on the first unit of the good
that is sold, producer surplus amounts to
a. $200.
b. $300.
c. $400.
d. $450.
Consumers, Producers, and the Efficiency of Markets 1847
94. Refer to Figure 7-16. Suppose the price of the good is $450. Then, on the first unit of the good
that is sold, producer surplus is
a. $250, and on the second unit of the good that is sold, producer surplus is $100.
b. $250, and on the second unit of the good that is sold, producer surplus is $150.
c. $350, and on the second unit of the good that is sold, producer surplus is $100.
d. $350, and on the second unit of the good that is sold, producer surplus is $150.
95. Refer to Figure 7-16. Producer surplus amounts to $300 if the price of the good is
a. $300.
b. $350.
c. $400.
d. $450.
1848 Consumers, Producers, and the Efficiency of Markets
96. Refer to Figure 7-16. Sellers will be unwilling to sell more than
a. 1 unit of the good if its price is below $200.
b. 2 units of the good if its price is below $450.
c. 3 units of the good if its price is below $700.
d. All of the above are correct.
Figure 7-17
Consumers, Producers, and the Efficiency of Markets 1849
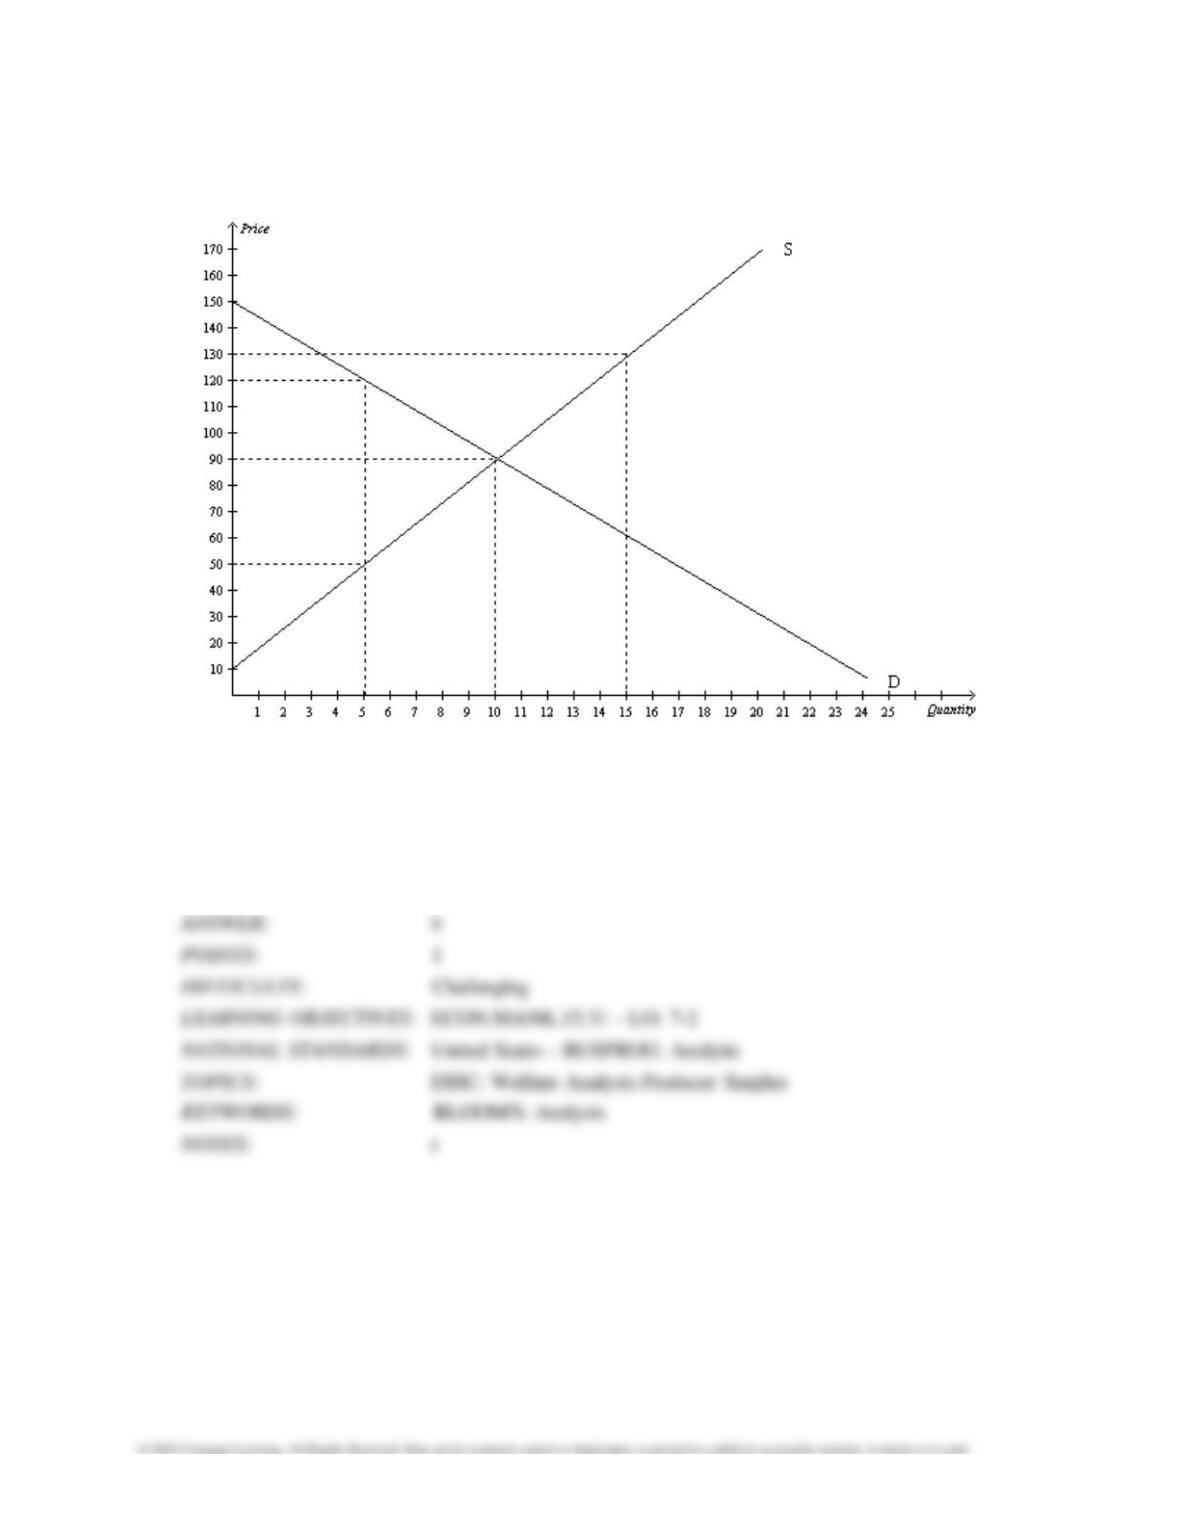
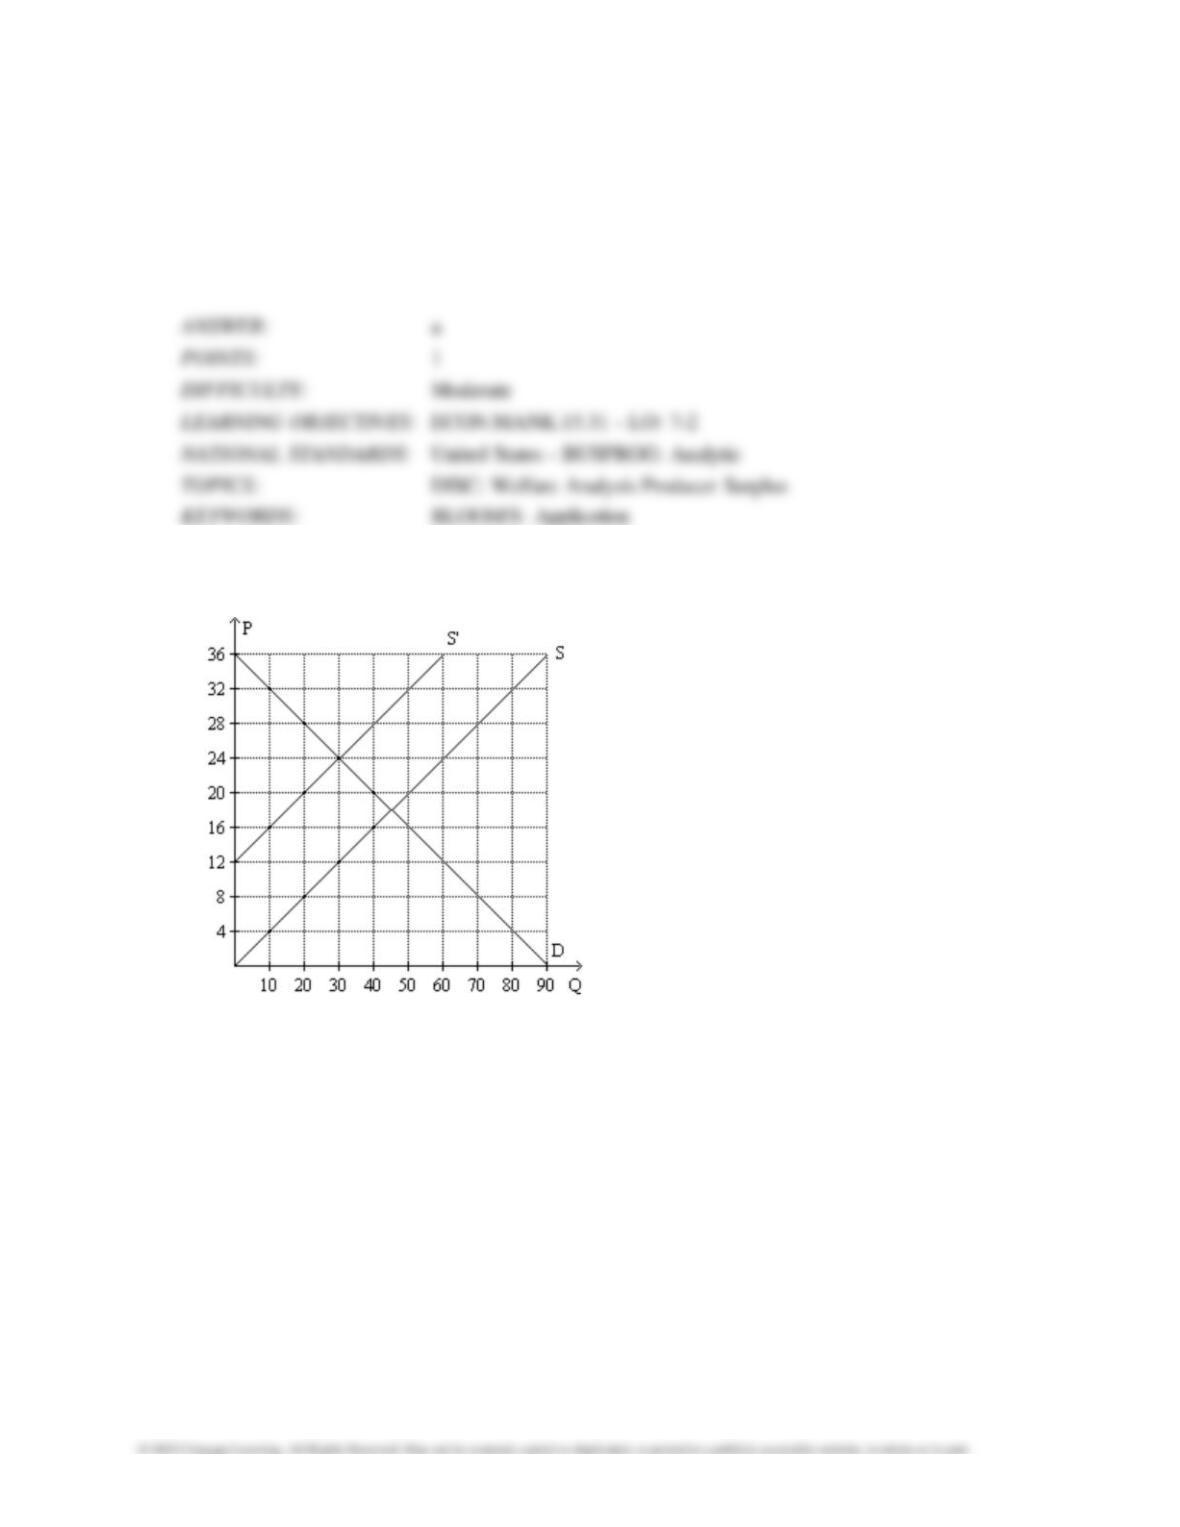
97. Refer to Figure 7-17. If the supply curve is S and the demand curve is D, what is total
producer surplus at the equilibrium price?
a. $202.50
b. $405
c. $810
d. $1,215
98. Refer to Figure 7-17. If the demand curve is D and the supply curve shifts left from S to S’,
what is the change
in producer surplus when comparing the new equilibrium with the original equilibrium?
a. Producer surplus increases by $225.
b. Producer surplus increases by $675.
c. Producer surplus decreases by $225.
d. Producer surplus decreases by $675.
1850 Consumers, Producers, and the Efficiency of Markets
99. Refer to Figure 7-17. Suppose the market starts out in equilibrium with demand curve D and
supply curve S. Next, suppose demand shifts left so as to decrease the quantity demanded by 20
units at every price. What is the change in producer surplus as a result of this demand shift?
a. $80
b. $160
c. $240
d. $320
100. Producer surplus equals
a. Value to buyers – Amount paid by buyers.
b. Amount received by sellers – Costs of sellers.
c. Value to buyers – Costs of sellers.
d. Value to buyers – Amount paid by buyers + Amount received by sellers – Costs of sellers.
Consumers, Producers, and the Efficiency of Markets 1851
101. Producer surplus is the
a. area under the supply curve to the left of the amount sold.
b. amount a seller is paid minus the cost of production.
c. area between the supply and demand curves, above the equilibrium price.
d. cost to sellers of participating in a market.
102. Producer surplus is the area
a. under the supply curve.
b. between the supply and demand curves.
c. below the price and above the supply curve.
d. under the demand curve and above the price.
1852 Consumers, Producers, and the Efficiency of Markets
103. Producer surplus is
a. represented on a graph by the area below the demand curve and above the supply curve.
b. the amount a seller is paid minus the cost of production.
c. also referred to as excess supply.
d. All of the above are correct.
104. Producer surplus directly measures
a. the well-being of society as a whole.
b. the well-being of buyers and sellers.
c. the well–being of sellers.
d. sellers’ willingness to sell.
105. Producer surplus directly measures
a. the well–being of sellers.
b. production costs.
c. excess demand.
d. unsold inventories.