KEY: Bloom’s: Comprehension
96. In the short run, if average variable cost equals $50, average total cost equals $75, and output equals
100, the total fixed cost must be:
a.
$25.
c.
$5,000.
b.
$2,500.
d.
$7,500.
97. The total fixed cost remains constant as which of the following varies?
a.
Cost of resources.
c.
Output in a given period of time.
b.
Time.
d.
Profit.
98. The total fixed cost curve:
a.
varies with the quantity of inputs used.
b.
decreases with output.
c.
increases with output.
d.
remains constant regardless of output.
99. Total fixed cost are costs that are fixed with respect to:
a.
the rate of output.
c.
technology.
b.
time.
d.
the minimum wage or price supports.
100. Bill is an accountant for a small machine shop. His boss has asked him to calculate the shop’s total
fixed cost. Which method will get Bill the correct answer?
a.
c and d.
b.
Calculating the product of average total cost and quantity
c.
Determining what the shop would pay for if they produced zero output
d.
Subtracting the total variable costs from the total costs
e.
Subtracting total variable costs from total revenue
101. Which of the following statements is true?
a.
TC = TFC − TVC.
b.
AVC = TC / Q.
c.
TFC = TC − TVC.
d.
MC equals the change in ATC divided by the change in Q.
102. Which of the following is considered to be a fixed cost of operating an automobile?
a.
Gasoline.
b.
Tires.
c.
Oil change.
d.
Maintenance.
e.
Registration fees.
103. Which of the following is an example of a fixed cost for a fishing company?
a.
The cost of hiring a fishing crew.
b.
The fuel costs of running the boat.
c.
The monthly loan payment on the boat.
d.
The supply of nets, hooks, and fishing lines.
e.
Bait.
104. If average fixed costs equal $60 and average total costs equal $120 when output is 100, the total
variable cost must be:
a.
$40.
c.
$6,000.
b.
$60.
d.
$8,000.
105. Suppose that when output is 20, marginal cost is $20, and average total cost is $30. Then which of the
following is most likely to be true?
a.
Average total cost is declining.
b.
Average total cost is constant.
c.
Average total cost is rising.
d.
Average total cost is less than average fixed cost.
106. Which of the following best describes average variable cost?
a.
The change in total cost when one additional unit of output is produced.
b.
Total cost divided by the quantity of output produced.
c.
Total variable cost divided by the quantity of output produced.
d.
Total fixed cost divided by the quantity of output produced.
e.
Costs that do not vary as output varies.
107. Which of the following is true if the total variable cost curve is rising?
a.
Average fixed cost is increasing.
c.
Marginal cost is increasing.
b.
Marginal cost is decreasing.
d.
Average fixed cost is constant.
108. If the total variable cost curve for a firm is S-shaped, what is the shape of the total cost curve for that
firm?
a.
U-shaped
b.
Flat.
c.
Hill-shaped.
d.
S-shaped.
e.
There is not enough information.
109. Barbara owns a small shop where dresses are made. At the end of a given month, she has 250 dresses.
Her expenses for the month are $1,000 for rent, $6,000 for wages, $1,500 for fabric and thread, and
$500 for electricity. Her total variable costs for the month are:
a.
c and e.
b.
$4,000.
c.
$32 per dress.
d.
$7,500.
e.
$8,000.
110. Suppose a firm has an output of 10,000 cans and a total fixed cost of $2,000. At an output of 5,000 the
difference between the total cost and the total variable cost is:
a.
b and c.
b.
$0.40.
c.
the average fixed cost.
d.
$2,000.
e.
$0.20.
111. Which statement about the total variable cost curve is true?
a.
It begins at the origin and increases before decreasing again.
b.
The total variable cost curve is the same at all levels of output.
c.
The total variable cost curve is increasing but at a decreasing rate.
d.
It begins at the origin and is always increasing.
e.
There is no such thing as a total variable cost curve.
112. Suppose a publisher faces the following costs of producing 10,000 newspapers each month: $5,500
cost of labor; $2,200 monthly mortgage payment; $250 cost of electricity to run the printing presses;
$800 for ink and paper; and $200 in city property taxes (based on the value of the building and land).
Its total variable costs are:
a.
$8,950.
b.
$8,750.
c.
$6,550.
d.
$6,300.
e.
$5,500.
113. The total cost curve is the sum of the:
a.
total fixed and total variable cost curves.
b.
total fixed and marginal cost curves.
c.
marginal cost and total variable cost curves.
d.
none of these.
114. Which of the following is true if the total cost curve is rising?
a.
Total fixed cost is decreasing.
c.
Marginal cost is decreasing.
b.
Total fixed cost is increasing.
d.
Marginal cost is increasing.
115. What is the shape of the average fixed cost curve for a firm in the short run?
a.
U-shaped.
b.
A curve that constantly increases as output expands and eventually approaches infinity at
high rates of output.
c.
A vertical line.
d.
A curve that declines as output expands and approaches the horizontal-axis when output is
large.
116. Which of the following will become smaller and smaller as the firm expands output?
a.
average total cost.
c.
marginal cost.
b.
average fixed cost .
d.
total fixed cost.
117. The average fixed cost of a firm equal:
a.
implicit costs divided by output.
b.
explicit costs divided by output.
c.
total cost minus variable cost.
d.
total cost minus total variable cost divided by output.
118. When costs that vary with the level of output are divided by the output, you have calculated:
a.
total changing cost.
c.
average fixed cost.
b.
total fixed cost.
d.
average variable cost.
119. If fixed cost is $200,000 and variable cost is $30 per unit over the relevant range of output, when
10,000 units are produced, the average total cost will be:
a.
$20.
c.
$50.
b.
$30.
d.
$70.
120. Use the table below to answer the following question.
Units of
Total Fixed
Total Variable
Output
Cost (dollars)
Cost (dollars)
1
1,000
1,200
2
1,000
2,400
3
1,000
3,600
4
1,000
5,000
5
1,000
6,600
What is the average total cost at an output level of four units?
a.
$1,200.
c.
$1,500.
b.
$1,400.
d.
$2,000.
121. What is the shape of the average total cost curve for a firm in the short run?
a.
U-shaped.
c.
A vertical line.
b.
A horizontal line.
d.
A curve that slopes upward to the right.
122. Which of the following explains most accurately why the firm’s short-run marginal cost curve will
eventually rise?
a.
As more of the variable factor is used, its price will rise.
b.
When diminishing marginal returns set in, it will take ever-larger quantities of the variable
resources to produce an additional unit of output.
c.
As the variable factor is used more intensely, its marginal product will rise, causing an
increase in marginal costs.
d.
As the size of the firm increases, the operational efficiency of the firm declines, causing an
increase in marginal costs.
123. Marginal cost is best defined as:
a.
a cost that does not vary with the rate of output.
b.
the difference between fixed and variable cost at any level of output.
c.
the amount added to total cost when one more unit of output is produced.
d.
the difference between price and average total cost at the profit-maximizing level of
output.
124. The change in total cost that results from the production of one additional unit is called:
a.
marginal revenue.
c.
marginal cost.
b.
average variable cost.
d.
average total cost.
125. Marginal cost is defined as the increase in total cost resulting from an increase in:
a.
one unit of output.
c.
a firm’s plant size.
b.
output of 100 units.
d.
one unit of labor.
126. The minimum point on the marginal cost curve corresponds to the:
a.
maximum point on the total cost curve.
b.
minimum point on the total cost curve.
c.
inflection point on the total variable cost curve.
d.
midpoint of the total cost curve.
127. If both the marginal cost and the average variable cost curves are U-shaped. At the minimum point on
the average variable cost curve, the marginal cost must be:
a.
greater than the average variable cost.
b.
less than the average variable cost.
c.
equal to the average variable cost.
d.
at its minimum.
128. Which of the following is true at the point where diminishing returns set in?
a.
Both marginal product and marginal cost are at a maximum.
b.
Both marginal product and marginal cost are at a minimum.
c.
Marginal product is at a maximum and marginal cost is at a minimum.
d.
Marginal product is at a minimum and marginal cost is at a maximum.
129. Suppose the fixed cost of building a nuclear power plant is $1 billion. Suppose also that the only
variable cost is the labor of Homer Simpson, and he earns $10 per hour. If the plant generates 1,000
kilowatts each hour, and has already generated 1 billion kilowatts, what can you say about the
marginal cost of the next kilowatt?
a.
b and e.
b.
The marginal cost is equal to $.01.
c.
The marginal cost is equal to $1.01.
d.
The marginal cost is rising.
e.
The marginal cost is falling.
130. The marginal cost is the:
a.
b and c.
b.
change in total cost as the quantity changes by one unit.
c.
change in total variable cost as the quantity changes by one unit.
d.
change in total fixed cost as the quantity changes by one unit.
e.
same as the fixed cost when average fixed cost is at a minimum.
131. American Airlines makes numerous nonstop flights from Chicago’s O’Hare Airport to the airport at
Dallas-Fort Worth. The distance between those two cities is 1,000 miles. The only variable cost, fuel,
costs $.06 for each passenger-mile it flies. Bob, on his way to an emergency business meeting, buys a
ticket in coach class for $1,300 at the very last minute. The marginal cost of flying Bob from Chicago
to Dallas-Fort Worth is:
a.
b and e.
b.
higher than the average cost of previous passengers.
c.
$600.
d.
$160.
e.
$60.
132. When the cost curves have U-shapes, at the point where marginal cost equals average total cost:
a.
b and c.
b.
marginal cost is rising.
c.
average total cost is at its minimum.
d.
average variable cost is falling.
e.
the fixed cost has been fully depreciated.
133. At the point where marginal cost equals average variable cost,
a.
b and c.
b.
marginal cost is rising.
c.
average total cost is at its minimum.
d.
average variable cost is falling.
e.
there is no total cost.
134. When marginal cost is below average total cost:
a.
total cost is falling.
b.
total cost is rising.
c.
average total cost is falling.
d.
average fixed cost is rising.
e.
total variable cost is falling.
135. A bus is mostly filled with passengers and ready to travel from Los Angeles to San Francisco. At the
last minute, a person comes running up to the bus and takes a seat. The change in the bus company’s
total cost as a result of transporting one more passenger on this trip is called:
a.
marginal cost.
b.
average total cost.
c.
variable cost.
d.
fixed cost.
e.
opportunity cost.
136. A firm estimates that when output is 10, its total costs are $900. It also finds that when output is 11, its
total costs are $920. The marginal cost of the eleventh unit of output is:
a.
$1.
b.
$20.
c.
$90.
d.
$900.
e.
$920.
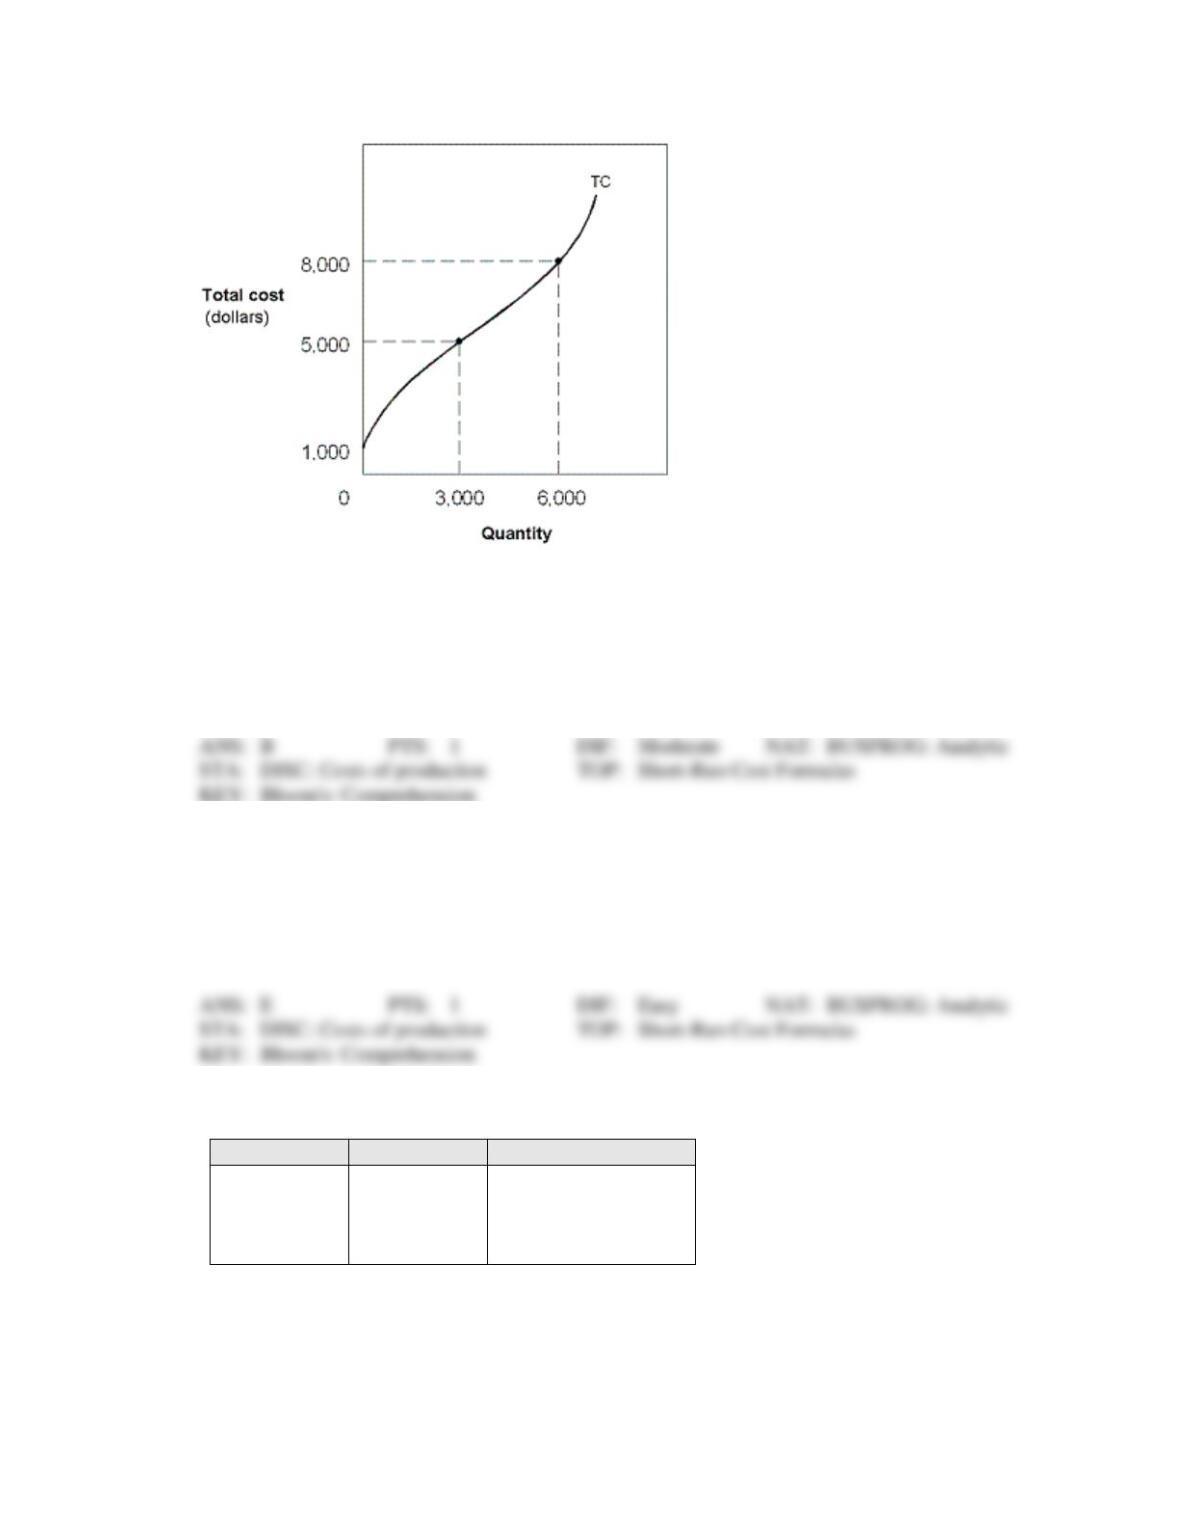
Exhibit 7-6 Total cost curves
137. In Exhibit 7-6, the total fixed cost is:
a.
0.
b.
1,000.
c.
3,000.
d.
5,000.
e.
6,000.
138. In Exhibit 7-6, the total cost of producing 6,000 units of output is:
a.
1,000.
b.
3,000.
c.
5,000.
d.
6,000.
e.
8,000.
Exhibit 7-7 Cost schedule for a firm
Quantity
Total Cost
Marginal Cost
0
$ 200
1
900
2
$900
3
3,000
139. In Exhibit 7-7, by filling in the blanks it can be determined that the fixed costs are:
a.
0.
b.
200.
c.
900.
d.
1,000.
e.
3,000.
140. In Exhibit 7-7, by filling in the blanks it can be determined that the total cost of the second unit of
output is:
a.
0.
b.
700.
c.
1,000.
d.
1,200.
e.
1,800.
141. In Exhibit 7-7, by filling in the blanks it can be determined that the marginal cost of the first unit of
output is:
a.
200.
b.
700.
c.
900.
d.
1,000.
e.
3,000.
142. In Exhibit 7-7, by filling in the blanks, it can be determined that the marginal cost of the third unit of
output is:
a.
0.
b.
200.
c.
700.
d.
1,200.
e.
2,000.
Exhibit 7-8 Costs schedules for producing pizza
Pizzas
Fixed
Cost
Variable
Cost
Total
Cost
Marginal
Cost
0
$
$
$
$
1
5
2
13
3
10
4
100
140
5
20
6
85
7
215
143. By filling in the blanks in Exhibit 7-8, the fixed cost of producing 6 pizzas is shown to be equal to:
a.
$100.
b.
$150.
c.
$200.
d.
$185.
e.
$85.
144. By filling in the blanks in Exhibit 7-8, the total cost of producing zero pizzas is shown to be equal to:
a.
zero.
b.
$100.
c.
$5.
d.
$105.
e.
$95.
145. By filling in the blanks in Exhibit 7-8, the total cost of producing 3 pizzas is shown to be equal to:
a.
$100.
b.
$105.
c.
$113.
d.
$123.
e.
$23.
146. By filling in the blanks in Exhibit 7-8, the total cost of producing 5 pizzas is shown to be equal to:
a.
$100.
b.
$105.
c.
$113.
d.
$123.
e.
$160.
147. By filling in the blanks in Exhibit 7-8, the variable cost of producing 4 pizzas is shown to be equal to:
a.
$100.
b.
$40.
c.
$60.
d.
$85.
e.
$185.
148. By filling in the blanks in Exhibit 7-8, the average variable cost of producing 4 pizzas is shown to be
equal to:
a.
$10.
b.
$15.
c.
$20.
d.
$40.
e.
$85.
149. By filling in the blanks in Exhibit 7-8, the average total cost of producing 5 pizzas is shown to be equal
to:
a.
$12.
b.
$15.
c.
$32.
d.
$85.
e.
$160.
150. By filling in the blanks in Exhibit 7-8, the marginal cost of the fourth pizza is shown to be equal to:
a.
$10.
b.
$15.
c.
$17.
d.
$23.
e.
$40.
151. By filling in the blanks in Exhibit 7-8, the marginal cost of the sixth pizza is shown to be equal to:
a.
$10.
b.
$15.
c.
$20.
d.
$25.
e.
$85.
Exhibit 7-9 Cost schedule for firm X
Output
Quantity
Total Fixed
Cost
Total Variable
Cost
0
$100
$ 0
1
100
50
2
100
84
3
100
108
4
100
127
5
100
150
152. As shown in Exhibit 7-9, the total cost of producing 4 units is:
a.
zero.
c.
$250.
b.
$227.
d.
$100.
153. As shown in Exhibit 7-9, the total cost of producing 5 units is:
a.
zero.
c.
$250.
b.
$227.
d.
$100.
154. As shown in Exhibit 7-9, the marginal cost of producing the third unit is:
a.
$50.
c.
$24.
b.
$16.
d.
$23.
Exhibit 7-10 Short-run cost schedule for book publisher’s hourly production
Total
Output
Total
Variable Cost
Total
Cost
0 cases of books
$ 0
$200
1
100
300
2
150
350
3
250
450
4
450
650
155. In Exhibit 7-10, the publisher’s fixed cost is equal to:
a.
$50.
c.
$200.
b.
$100.
d.
$300.
156. In Exhibit 7-10, the average variable cost of producing 2 cases of books is:
a.
$50 per case.
c.
$100 per case.
b.
$75 per case.
d.
$150 per case.
157. In Exhibit 7-10, the marginal cost of increasing production from 2 to 3 cases of books is:
a.
$100.
c.
$450.
b.
$150.
d.
$800.
Exhibit 7-11 Short-run cost curves schedule for pizzeria’s hourly production
Total
Product
Total
Variable Cost
Total
Cost
0 pizzas
$ 0
$ 20
10
50
70
20
80
100
30
130
150
40
230
250
158. In Exhibit 7-11, the pizzeria’s fixed cost is equal to:
a.
$20.
c.
$50.
b.
$30.
d.
$70.
159. In Exhibit 7-11, the average total cost or producing 40 pizzas per hour is equal to:
a.
$5 per pizza.
c.
$6.25 per pizza.
b.
$5.75 per pizza.
d.
$10 per pizza.
160. In Exhibit 7-11, what is the marginal cost of increasing production from 10 to 20 pizzas per hour?
a.
$2 per pizza.
c.
$4 per pizza.
b.
$3 per pizza.
d.
$5 per pizza.
Exhibit 7-12 Cost schedule for producing pizza
Pizzas
Fixed
Cost
Variable
Cost
Total
Cost
0
$
$
$
1
48
2
17
3
27
4
78
5
40
6
64
7
80
161. By filling in the blanks in Exhibit 7-12, the AFC of 4 pizzas is shown to be equal to:
a.
$10.
b.
$9.50.
c.
$19.50.
d.
$40.
e.
$78.
162. By filling in the blanks in Exhibit 7-12, the AFC of 3 pizzas is shown to be equal to:
a.
$10.
b.
$13.33.
c.
$9.
d.
$22.33.
e.
$40.
163. By filling in the blanks in Exhibit 7-12, the AVC of 4 pizzas is shown to be equal to:
a.
$10.
b.
$9.50.
c.
$19.50.
d.
$40.
e.
$78.
164. By filling in the blanks in Exhibit 7-12, the AVC of 3 pizzas is shown to be equal to:
a.
$10.
b.
$13.33.
c.
$9.
d.
$22.33.
e.
$40.
165. By filling in the blanks in Exhibit 7-12, the ATC of 3 pizzas is shown to be equal to:
a.
$10.
b.
$13.33.
c.
$9.
d.
$22.33.
e.
$40.
166. By filling in the blanks in Exhibit 7-12, the ATC of 4 pizzas is shown to be equal to:
a.
$10.
b.
$9.50.
c.
$19.50.
d.
$40.
e.
$78.
167. By filling in the blanks in Exhibit 7-12, the marginal cost of the fourth pizza is shown to be equal to:
a.
$10.
b.
$11.
c.
$12.
d.
$13.
e.
$14.
168. By filling in the blanks in Exhibit 7-12, the marginal cost of the third pizza is shown to be equal to:
a.
$10.
b.
$11.
c.
$12.
d.
$13.
e.
$14.
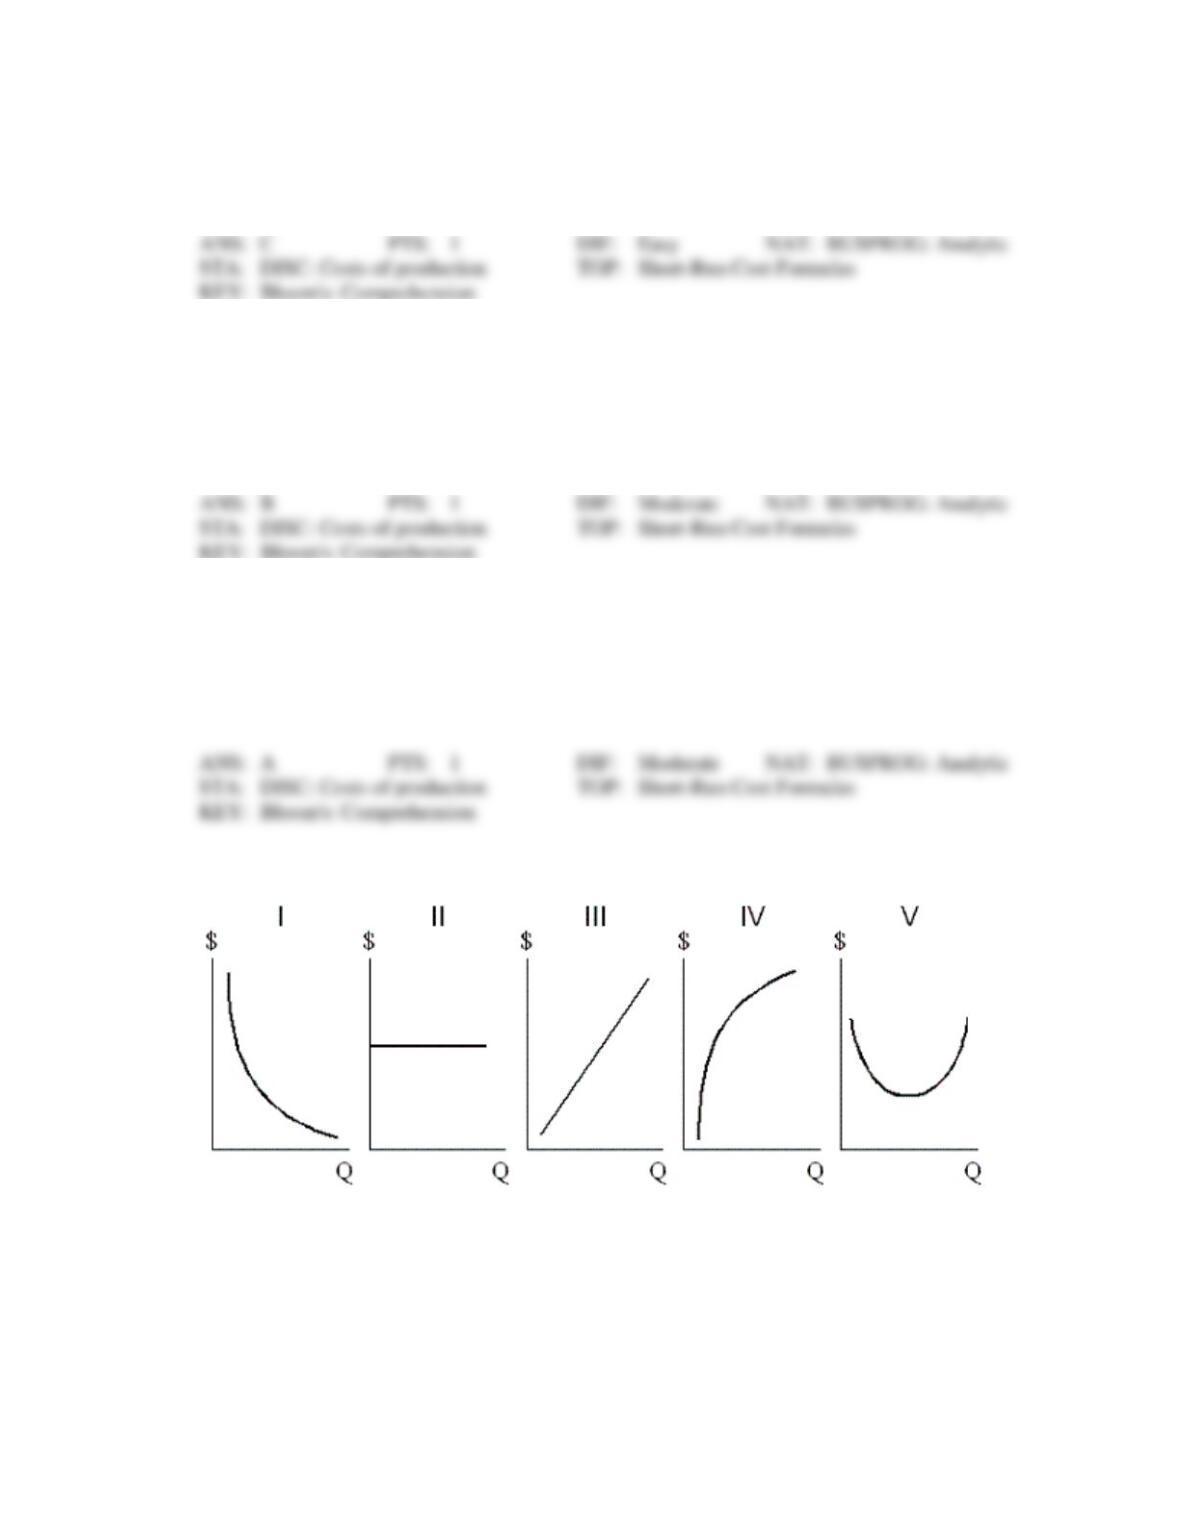
Exhibit 7-13 Cost curves
169. In Exhibit 7-13, TFC is shown by the graph labeled:
a.
I.
b.
II.
c.
III.
d.
IV.
e.
V.