1972 Consumers, Producers, and the Efficiency of Markets
Problems
1.
What do economists call the highest amount a consumer will pay to purchase a good?
2.
If John’s willingness to pay for a good is $20 and the price of the good is $15, how much is John’s
consumer surplus
from purchasing the good?
Table 7-18
The following table shows the willingness to pay for a good for the only four consumers in a
market.
Consumer
Willingness to Pay
A
$25
B
$40
C
$15
D
$30
3.
Refer to Table 7-18. If the price of the good is $20, how many units will be demanded?
4.
Refer to Table 7-18. If the price of the good is $20, how much is the total consumer surplus?
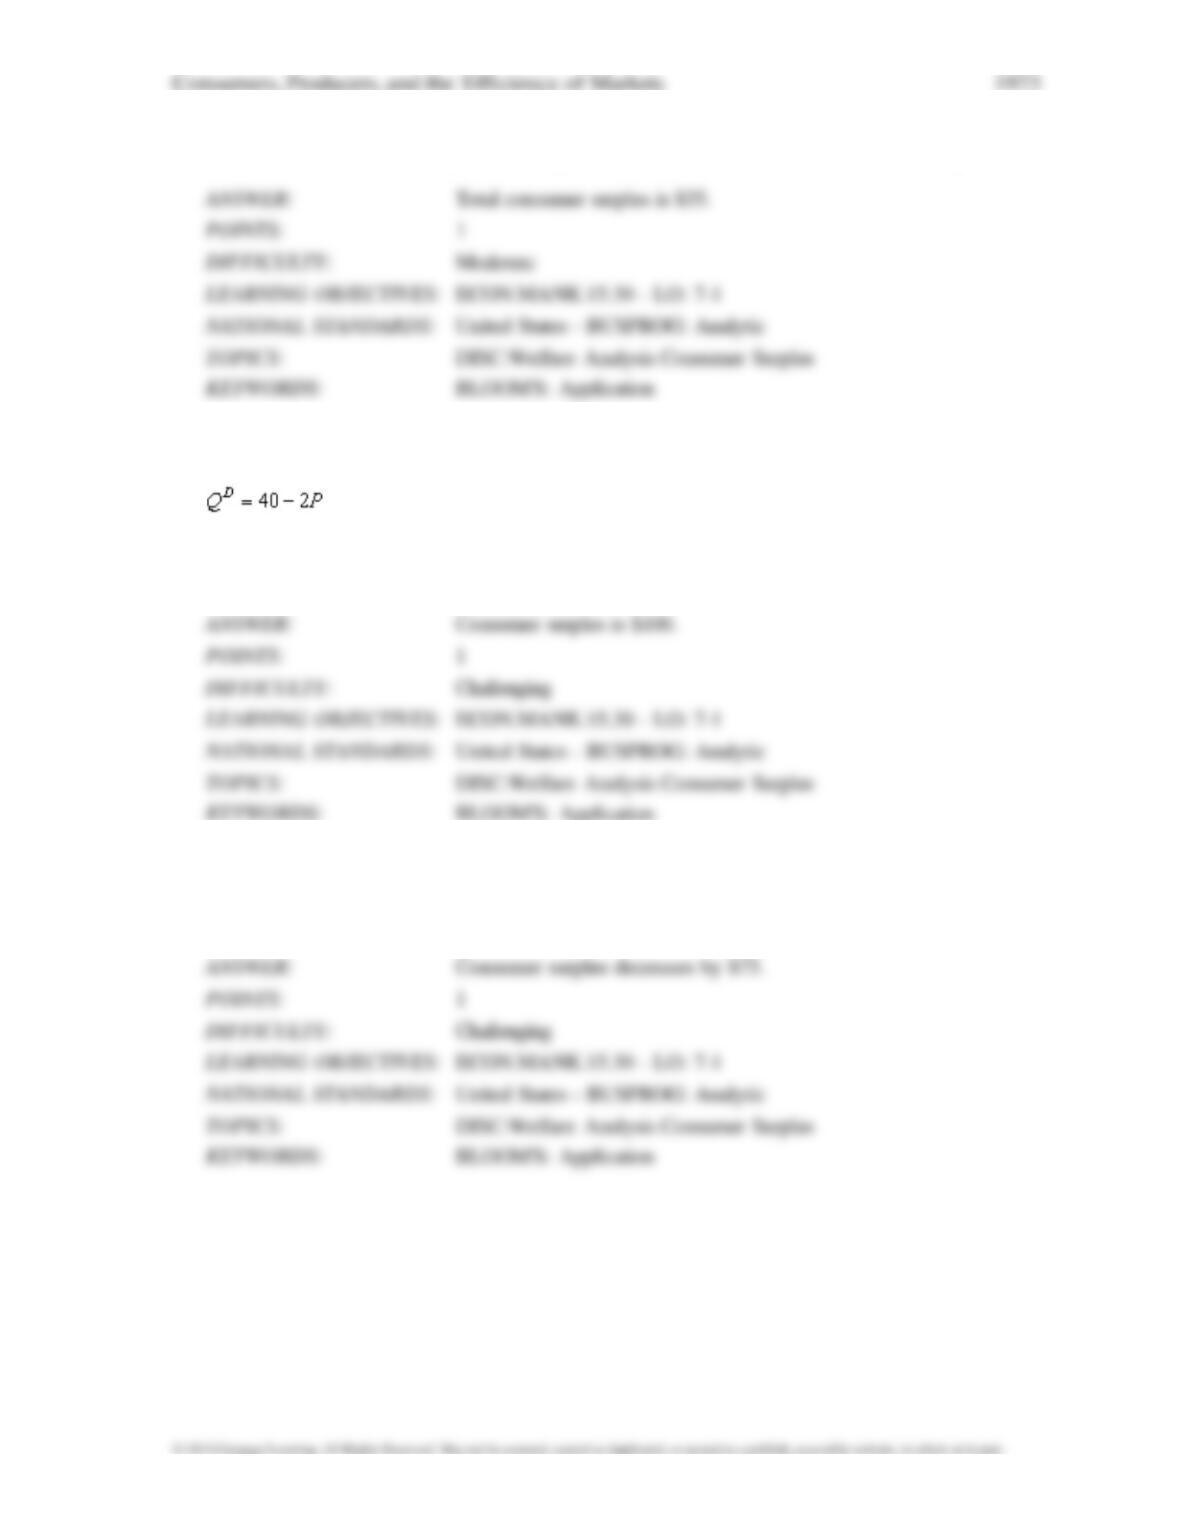
Scenario 7-1
Suppose market demand is given by the equation
5.
Refer to Scenario 7-1. If the market equilibrium price is $10, how much is total consumer surplus
in this market?
6.
Refer to Scenario 7-1. If the market equilibrium price rises from $10 to $15, what is the change
in total consumer
surplus in the market?
7.
Refer to Scenario 7-1. If the market equilibrium price falls from $10 to $5, what is the change in
total consumer
surplus in the market?
8.
Refer to Scenario 7-1. If the market equilibrium price falls from $10 to $5, how much additional
consumer surplus
do consumers initially in the market at the $10 price receive?
9.
Refer to Scenario 7-1. If the market equilibrium price falls from $10 to $5, how much consumer
surplus do
consumers entering the market after the price drop receive?
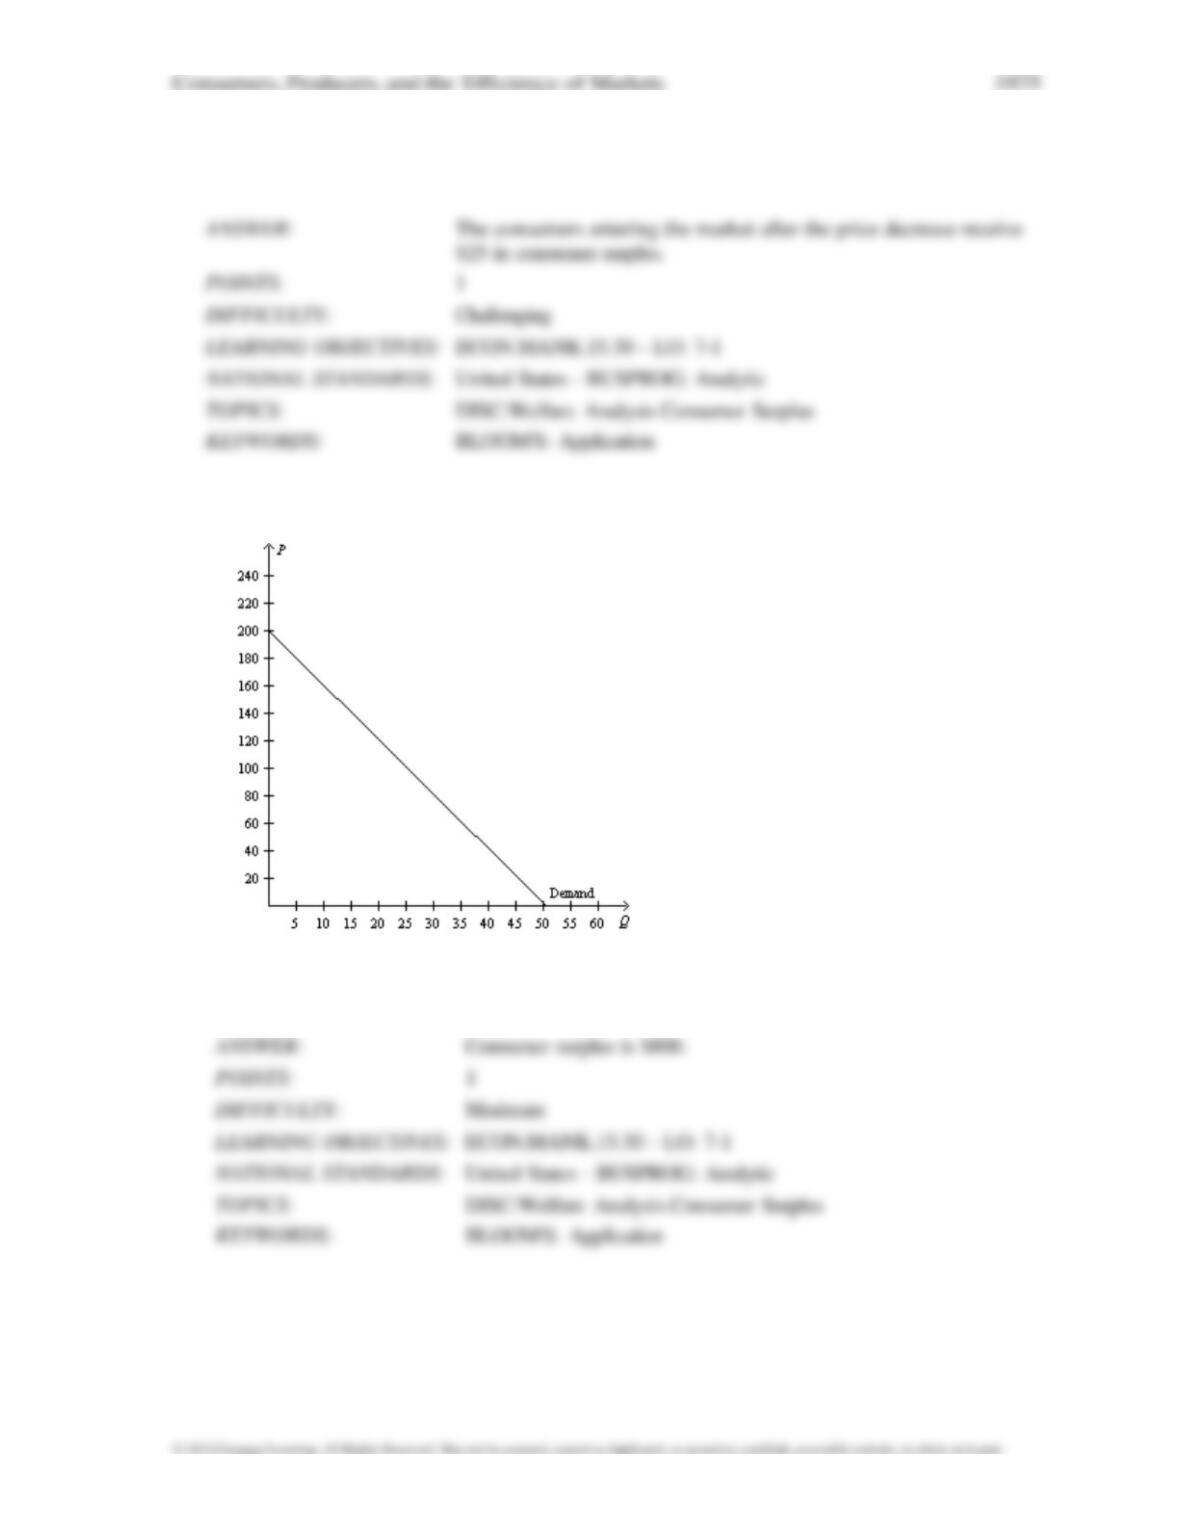
Figure 7–30
10.
Refer to Figure 7-30. If the market equilibrium price is $120, how much is total consumer
surplus?
11.
Refer to Figure 7-30. If the market equilibrium price falls from $120 to $80, how much is the
change in total
consumer surplus in the market?
12.
Refer to Figure 7-30. If the market equilibrium price falls from $120 to $80, how much is the
increase in consumer
surplus to the consumers who were initially in the market at the $120 price?
13.
Refer to Figure 7-30. If the market equilibrium price falls from $120 to $80, how much
consumer surplus do
consumers entering the market after the price drop receive?
14.
Suppose John’s cost for performing some carpentry work is $120. If John is paid $200 for the
carpentry work, what
is his producer surplus?
Table 7-19
The following table shows the cost of producing a good for the only four producers in a market.
Producer
Cost
W
$40
X
$30
Y
$20
Z
$10
15.
Refer to Table 7–19. If the market price is $28, which producers will supply units in the market?
16.
Refer to Table 7–19. If the market equilibrium price is $28, what is total producer surplus in the
market?
17.
Refer to Table 7-19. If these four producers bid in an auction to supply one unit to a consumer,
at what price will
the good be sold?
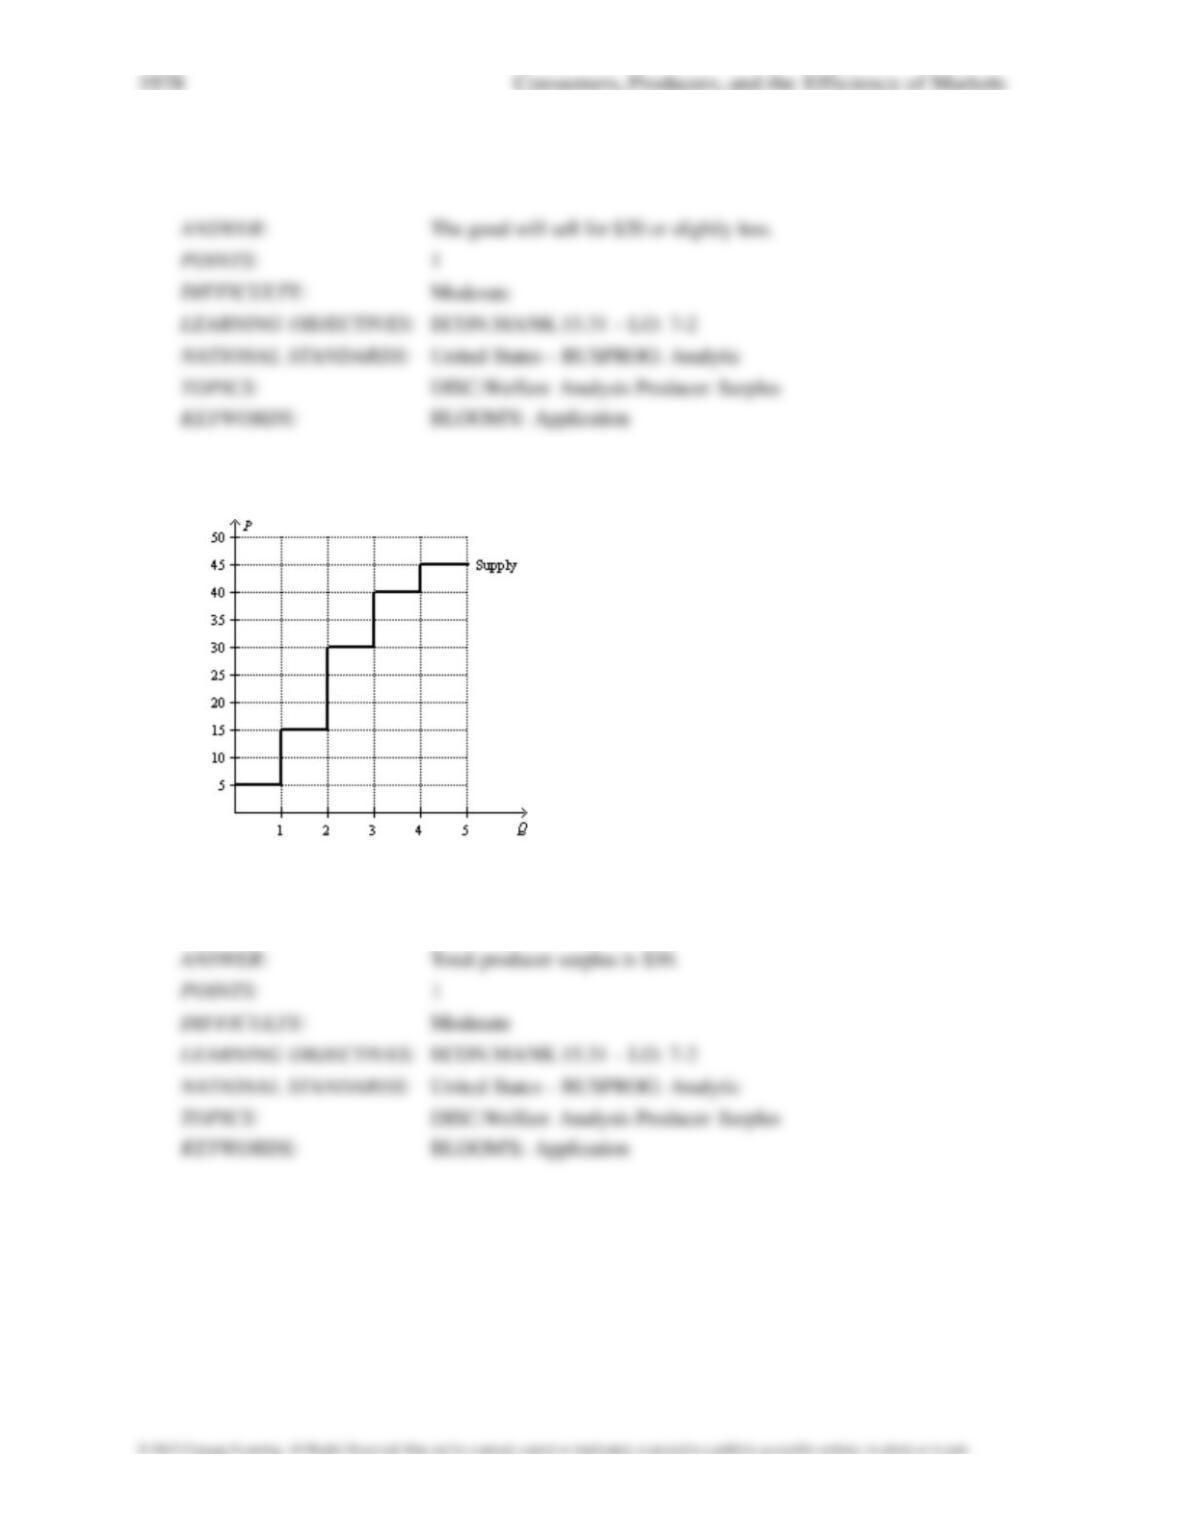
Figure 7–31
18.
Refer to Figure 7–31. If the market equilibrium price is $25, how much is total producer surplus
in this market?
19.
Refer to Figure 7–31. If the market equilibrium price is $35, how much is total producer surplus
in this market?
20.
Refer to Figure 7–31. If the market equilibrium price rises from $25 to $35, how much is the
increase in producer
surplus to the producers supplying units at the initial $25 price?
21.
Refer to Figure 7–31. If the market equilibrium price rises from $25 to $35, how much is the
producer surplus for
the producers entering the market after the price increase?
1980 Consumers, Producers, and the Efficiency of Markets
Table 7-20
22.
Refer to Table 7-20. How much is total consumer surplus at the equilibrium price in this
market?
23.
Refer to Table 7-20. How much is total producer surplus at the equilibrium price in this market?
24.
Refer to Table 7-20. How much is total surplus at the equilibrium price in this market?
Buyer
Willingness to Pay ($)
Seller
Cost
($)
A
15
W
10
B
30
X
20
C
45
Y
30
D
60
Z
40
Consumers, Producers, and the Efficiency of Markets 1981
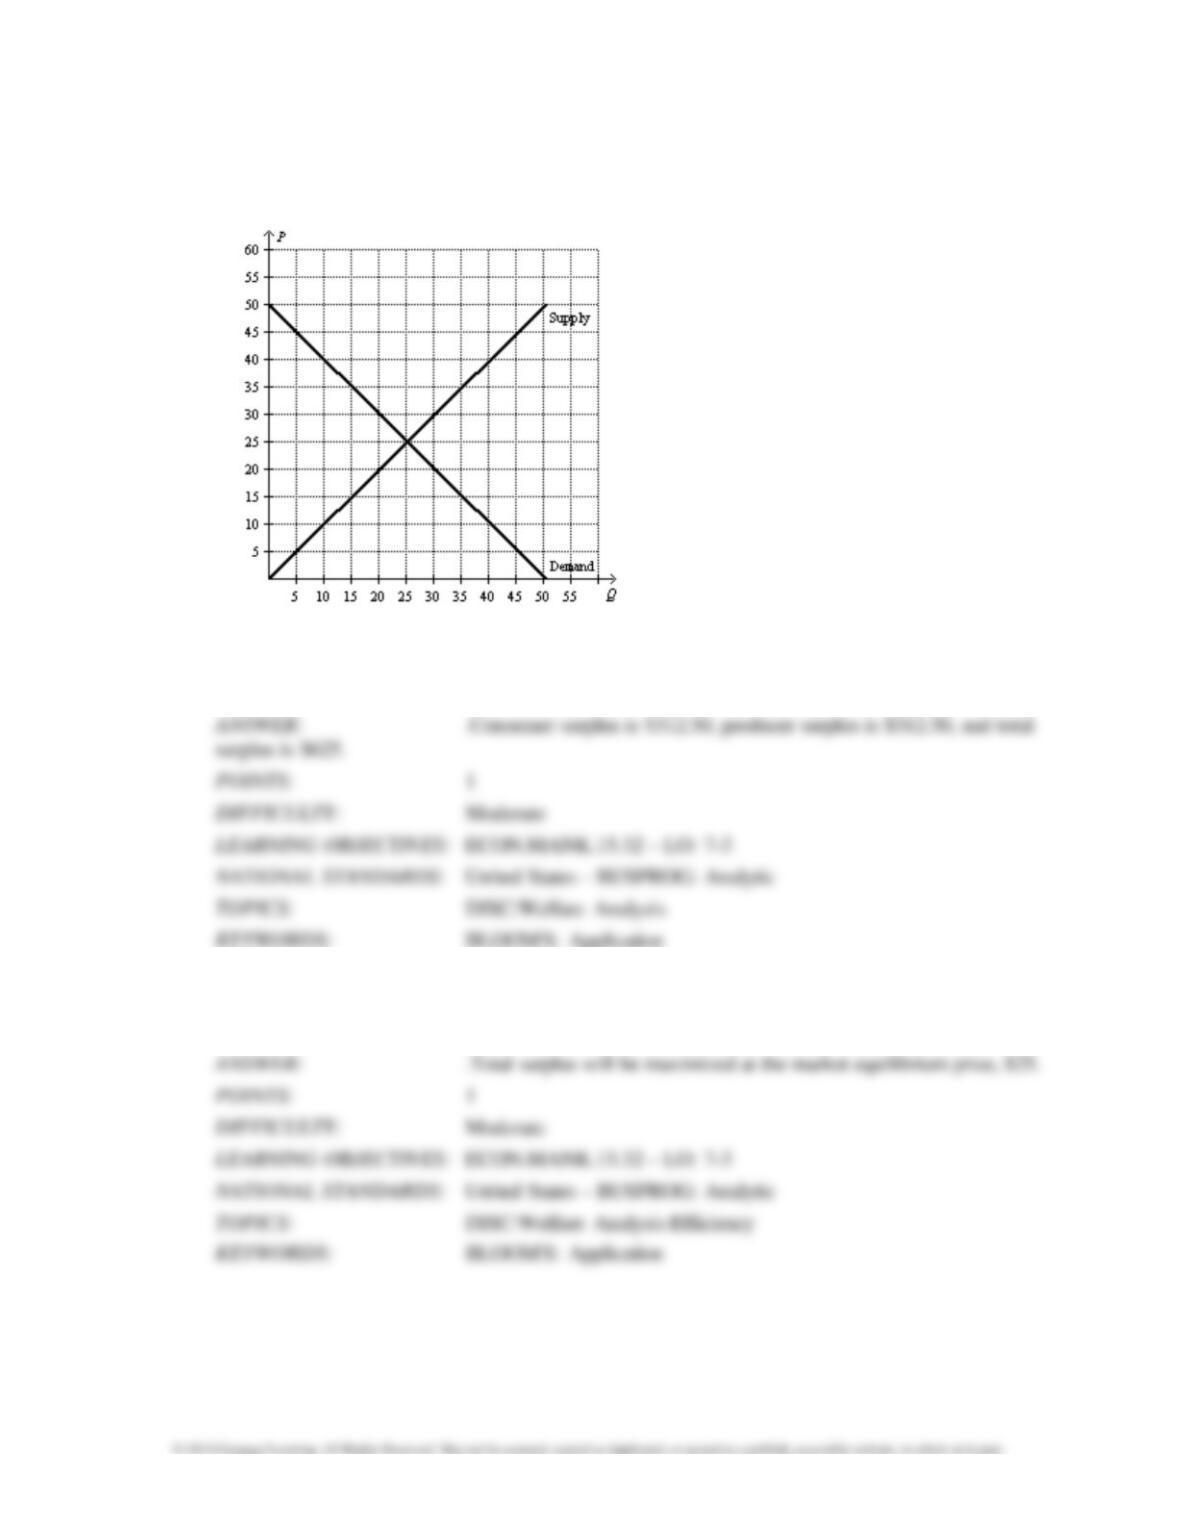
Figure 7–32
25.
Refer to Figure 7-32. How much are consumer surplus, producer surplus, and total surplus at
the market
equilibrium price?
26.
Refer to Figure 7–32. At what price will total surplus be maximized in this market?
27.
Refer to Figure 7-32. If the government imposed a price floor at $35 in this market, how much
is consumer
surplus?
28.
Refer to Figure 7–32. If the government imposed a price ceiling at $20 in this market, how
much are consumer
surplus, producer surplus, and total surplus?
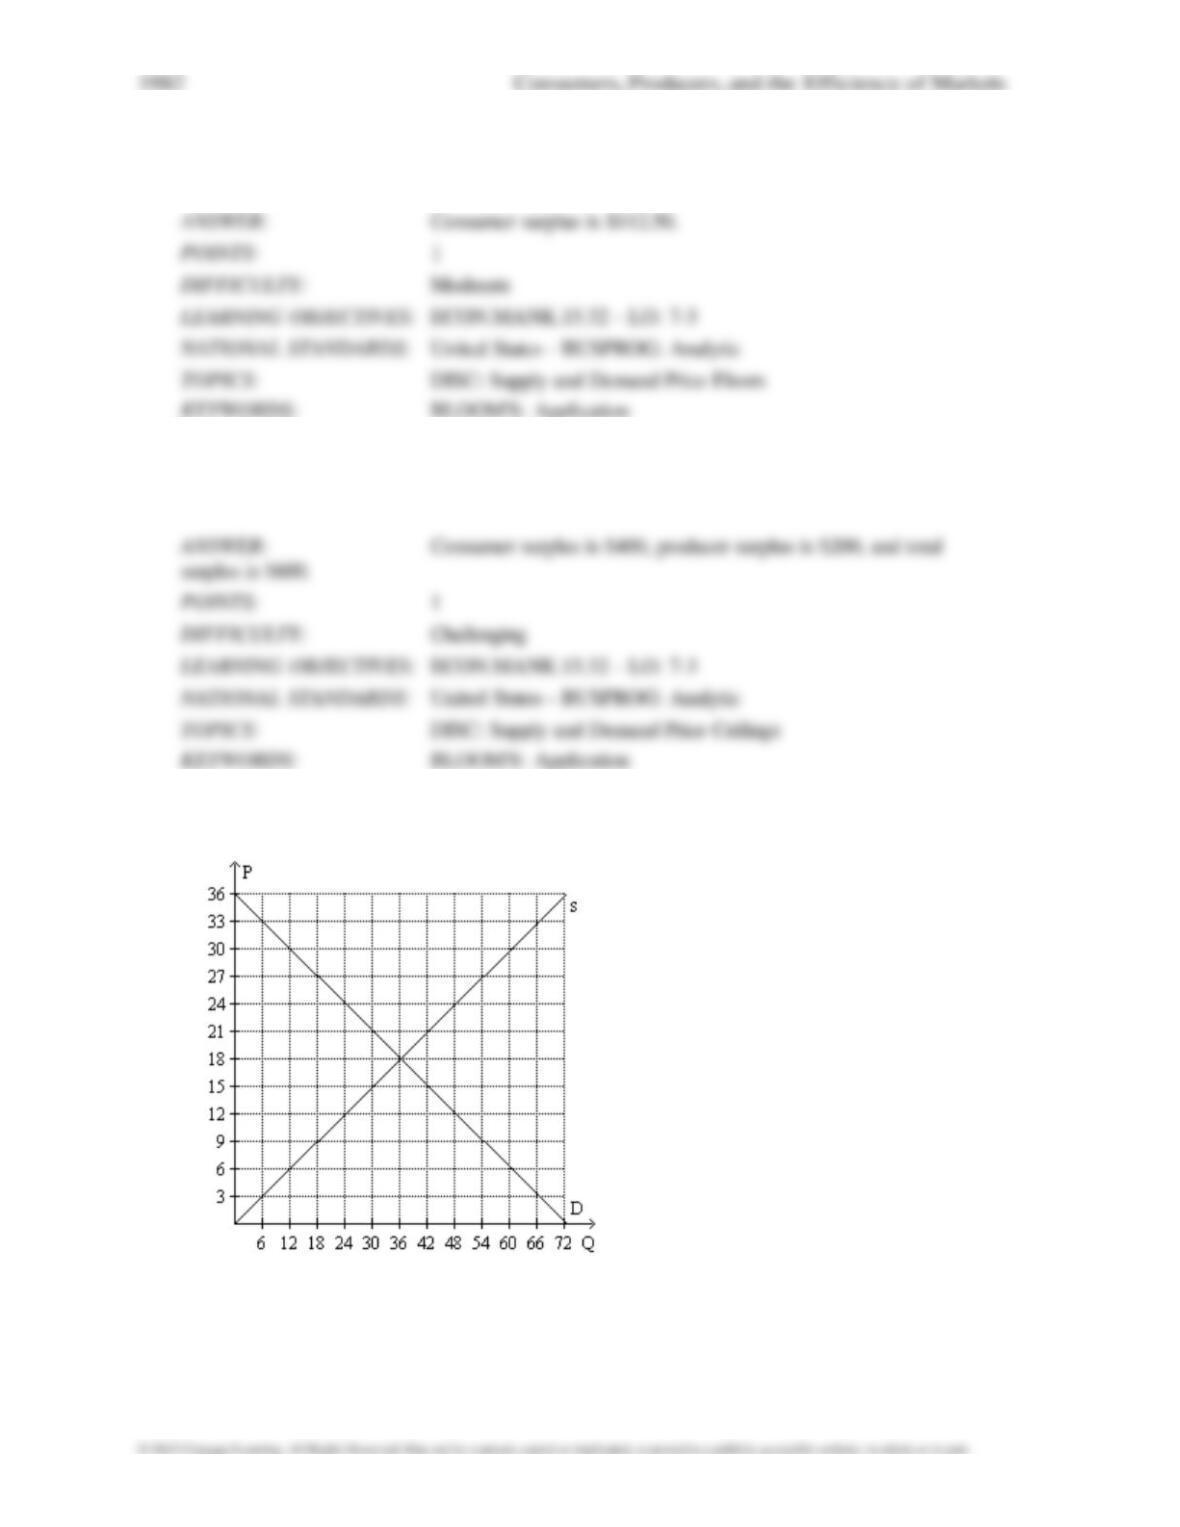
Figure 7–33
29.
Refer to Figure 7-33. How much is total consumer surplus in this market at the equilibrium
price?
30.
Refer to Figure 7-33. How much is total producer surplus in this market at the equilibrium
price?
31.
Refer to Figure 7-33. How much is total surplus in this market at the equilibrium price?
32.
Refer to Figure 7-33. Suppose demand shifts such that consumers wish to purchase 12 fewer
units at every price.
How much is total consumer surplus in this market at the new equilibrium price?
33.
Refer to Figure 7-33. Suppose demand shifts such that consumers wish to purchase 12 fewer
units at every price.
How much is total producer surplus in this market at the new equilibrium price?
34.
Refer to Figure 7-33. Suppose demand shifts such that consumers wish to purchase 12 fewer
units at every price.
How much is total surplus in this market at the new equilibrium price?
Consumers, Producers, and the Efficiency of Markets 1985
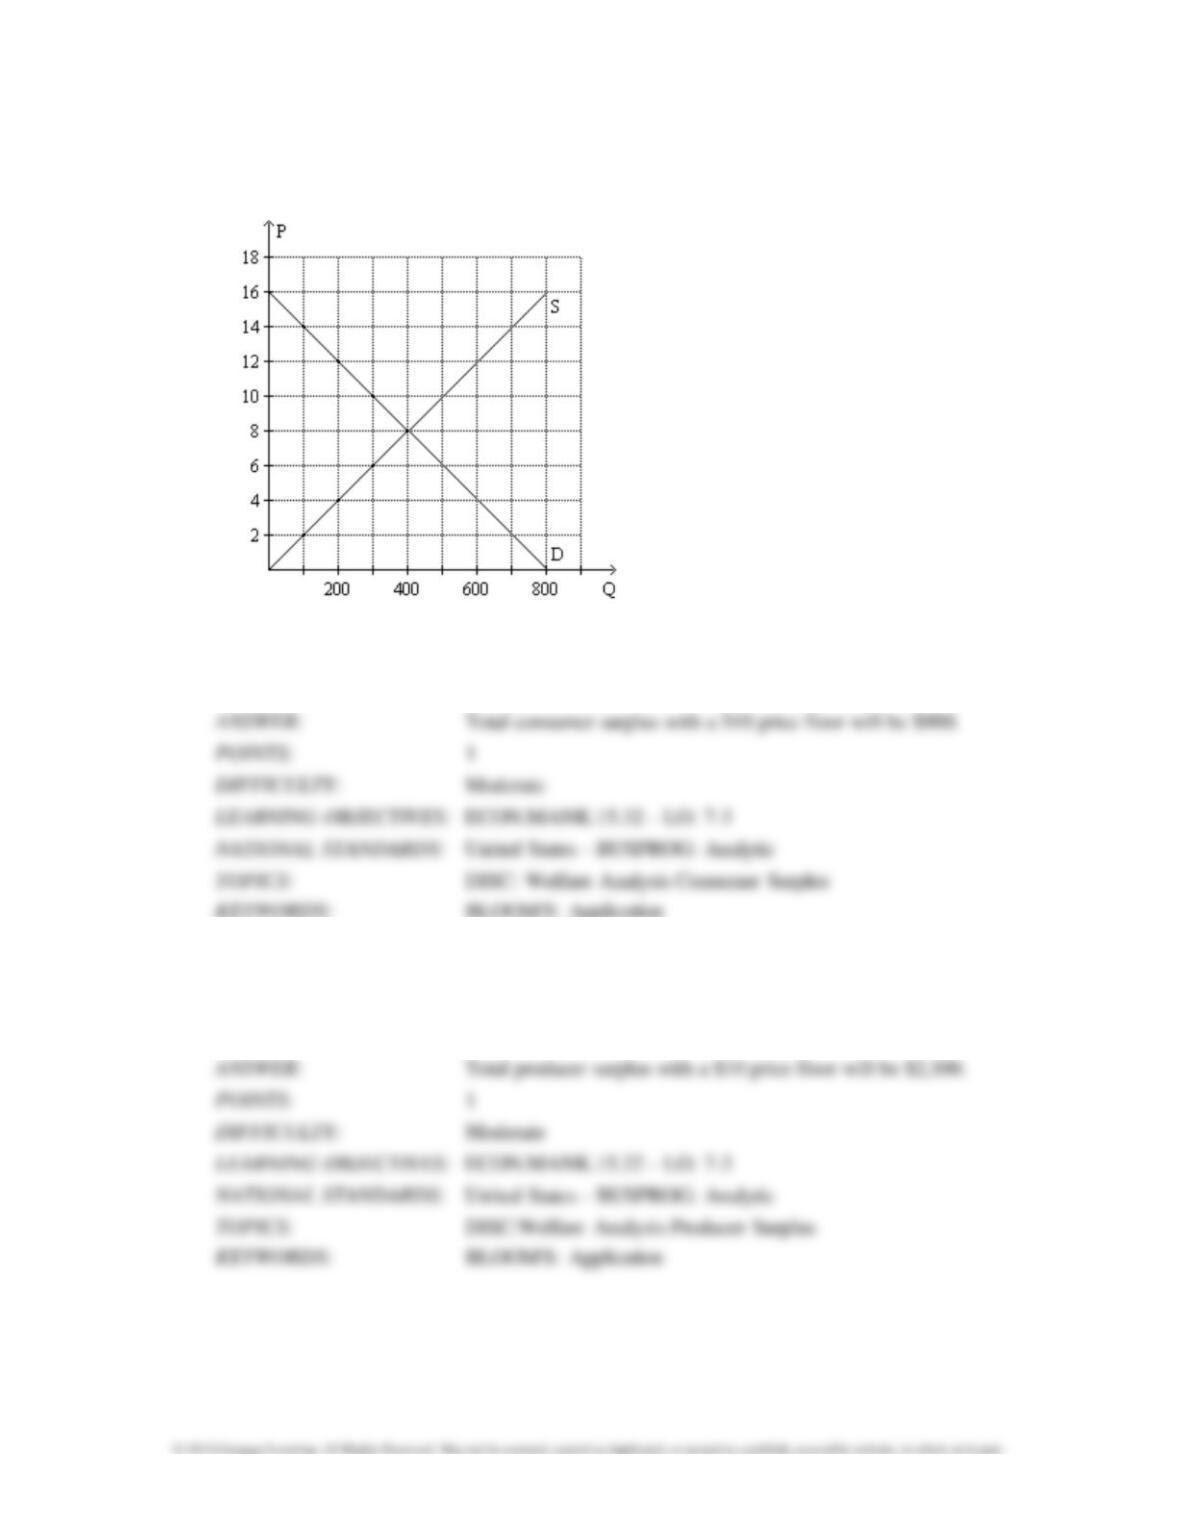
Figure 7–34
35.
Refer to Figure 7-34. Suppose the government imposes a price floor at $10 per unit in this
market. With the price
floor, how much is total consumer surplus?
36.
Refer to Figure 7-34. Suppose the government imposes a price floor at $10 per unit in this
market. With the price
floor, how much is total producer surplus assuming those producers with
the lowest cost are the ones who supply the
market?
37.
Refer to Figure 7-34. Suppose there is initially a price floor set at $10 in this market. If the
government removed
the price floor, by how much would total consumer surplus increase?
38.
Refer to Figure 7-34. Suppose there is initially a price floor set at $10 in this market. If the
government removed
the price floor, by how much would total consumer surplus increase for
those consumers who were purchasing the
good when the price floor was in place?
39.
Refer to Figure 7-34. Suppose there is initially a price floor set at $10 in this market. If the
government removed
the price floor, by how much would total consumer surplus increase for
those consumers who enter the market after
the price floor is removed?
40.
Refer to Figure 7-34. Suppose there is initially a price floor set at $10 in this market. If the
government removed
the price floor, by how much would total producer surplus change, assuming
the producers with the lowest cost were
the ones supplying the market when the price floor was in
place?
41.
Refer to Figure 7-34. Suppose there is initially a price ceiling set at $4 in this market. How
much is total producer
surplus with the price ceiling in place?
42.
Refer to Figure 7-34. Suppose there is initially a price ceiling set at $4 in this market. If the
government removed
the price ceiling, by how much would total producer surplus change?
43.
Refer to Figure 7-34. Suppose there is initially a price ceiling set at $4 in this market. If the
government removed
the price ceiling, by how much would total producer surplus increase for
those producers entering the market after
the price ceiling is removed?
Scenario 7-2
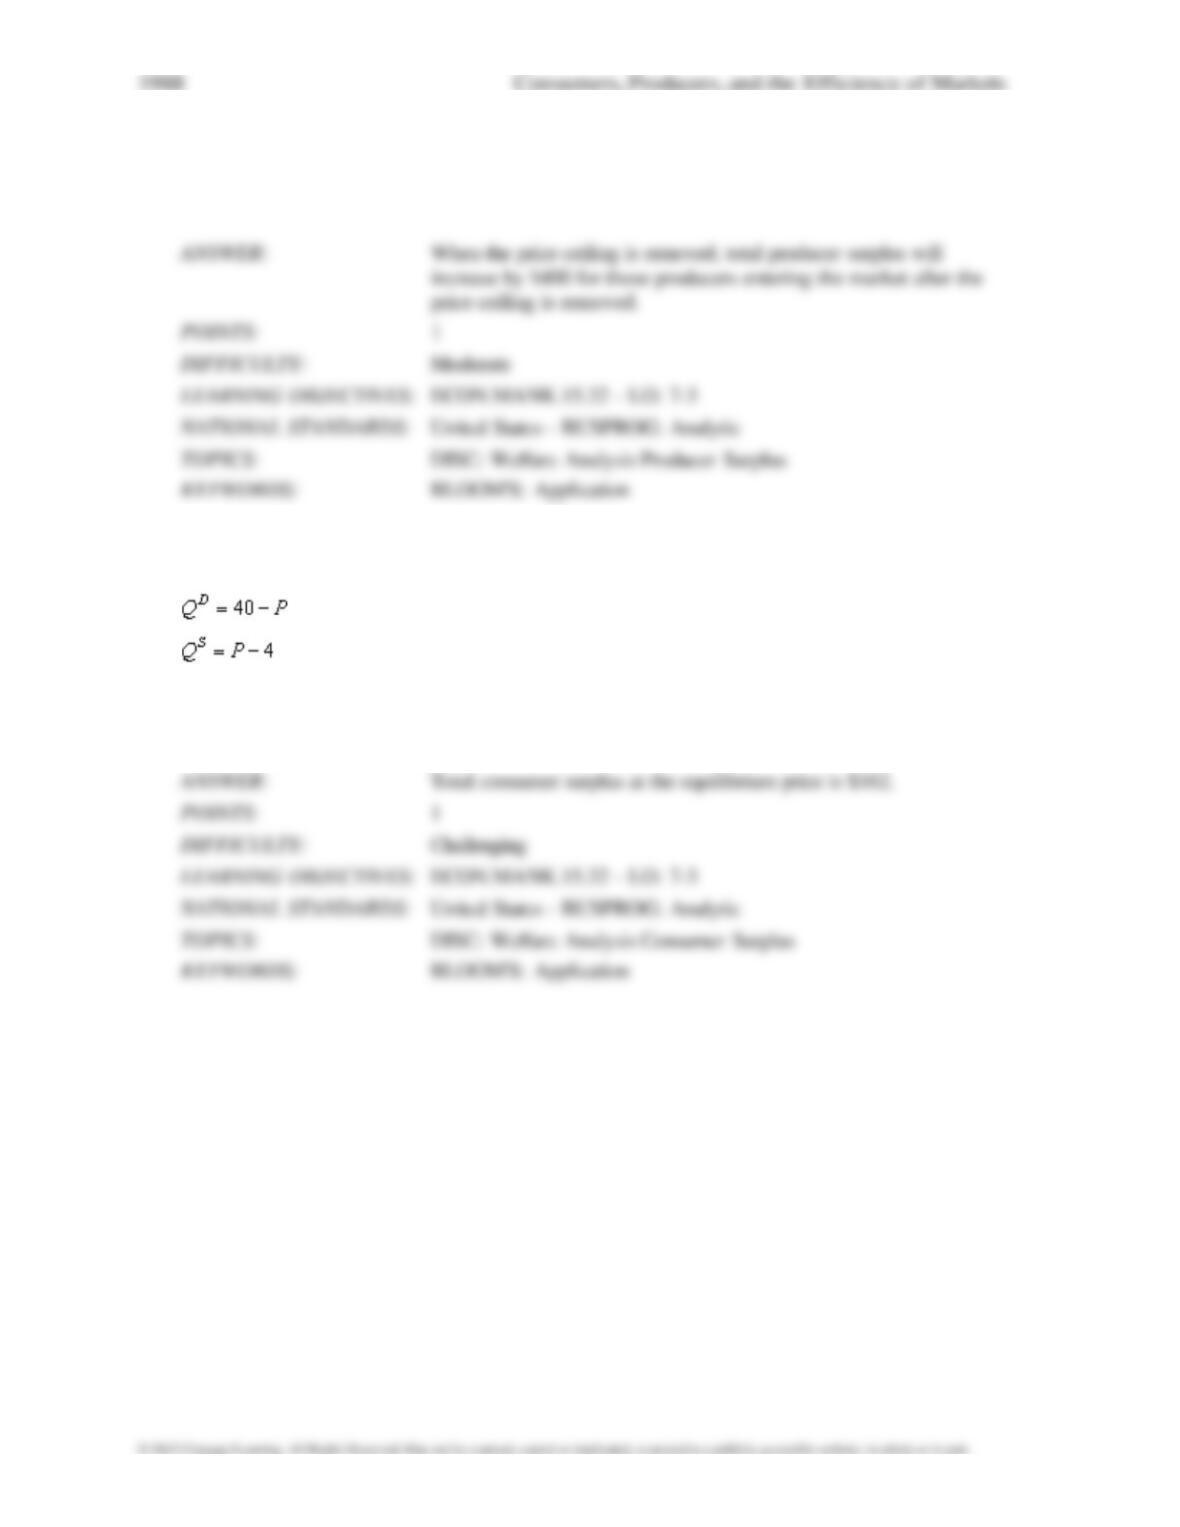
Suppose market demand and market supply are given by the equations:
44.
Refer to Scenario 7-2. How much is total consumer surplus at the equilibrium price in this
market?
45.
Refer to Scenario 7-2. How much is total producer surplus at the equilibrium price in this
market?
46.
Refer to Scenario 7-2. How much is total surplus at the equilibrium price in this market?
47.
Refer to Scenario 7-2. Suppose a reduction in input prices shifts the market supply curve to
By how much does total consumer surplus increase as a result of this supply shift?
48.
Refer to Scenario 7-2. Suppose a reduction in input prices shifts the market supply curve to
By how much does total consumer surplus increase for those consumers who were already willing
to purchase the
good with the original supply curve?
49.
Refer to Scenario 7-2. Suppose a reduction in input prices shifts the market supply curve to
How much total consumer surplus goes to new consumers who enter the market after the supply
curve shifts?
50.
Refer to Scenario 7-2. Suppose a reduction in input prices shifts the market supply curve to
By how much does total producer surplus increase as a result of this supply shift?