Consumers, Producers, and the Efficiency of Markets 1873
22. The distinction between efficiency and equality can be described as follows:
a. Efficiency refers to maximizing the number of trades among buyers and sellers; equality refers
to maximizing the gains from trade among buyers and sellers.
b. Efficiency refers to minimizing the price paid by buyers; equality refers to maximizing the gains
from trade among buyers and sellers.
c. Efficiency refers to maximizing the size of the pie; equality refers to producing a pie of a given
size at the least possible cost.
d. Efficiency refers to maximizing the size of the pie; equality refers to distributing the pie fairly
among members of society.
23. If an allocation of resources is efficient, then
a. consumer surplus is maximized.
b. producer surplus is maximized.
c. all potential gains from trade among buyers are sellers are being realized.
d. the allocation achieves equality as well.
1874 Consumers, Producers, and the Efficiency of Markets
24. Moving production from a high-cost producer to a low–cost producer will
a. lower total surplus.
b. raise total surplus.
c. lower producer surplus.
d. raise producer surplus but lower consumer surplus.
25. Which of the following is correct?
a. Efficiency deals with the size of the economic pie, and equality deals with how fairly the pie is
sliced.
b. Equality can be judged on positive grounds whereas efficiency requires normative judgments.
c. Efficiency is more difficult to evaluate than equality.
d. Equality and efficiency are both maximized in a society when total surplus is maximized.
Consumers, Producers, and the Efficiency of Markets 1875
Table 7-17
Price
Quantity Demanded
Quantity Supplied
$12.00
0
36
$10.00
3
30
$ 8.00
6
24
$ 6.00
9
18
$ 4.00
12
12
$ 2.00
15
6
$ 0.00
18
0
26. Refer to Table 7-17. The equilibrium price is
a. $10.00.
b. $8.00.
c. $6.00.
d. $4.00.
27. Refer to Table 7-17. At a price of $2.00, total surplus is
a. larger than it would be at the equilibrium price.
b. smaller than it would be at the equilibrium price.
c. the same as it would be at the equilibrium price.
d. There is insufficient information to make this determination.

1876 Consumers, Producers, and the Efficiency of Markets
28. Refer to Table 7-17. Both the demand curve and the supply curve are straight lines. At
equilibrium, consumer surplus is
a. $24.
b. $36.
c. $42.
d. $48.
29. Refer to Table 7-17. Both the demand curve and the supply curve are straight lines. At
equilibrium, producer surplus is
a. $24.
b. $32.
c. $48.
d. $64.
Consumers, Producers, and the Efficiency of Markets 1877
30. Refer to Table 7-17. Both the demand curve and the supply curve are straight lines. At
equilibrium, total surplus is
a. $44.
b. $56.
c. $72.
d. $96.
31. Refer to Table 7-17. Both the demand curve and the supply curve are straight lines. If the price
is $4 but only 6 units are bought and sold, consumer surplus will be
a. $21.
b. $28.
c. $36.
d. $42.

1878 Consumers, Producers, and the Efficiency of Markets
32. Refer to Table 7-17. Both the demand curve and the supply curve are straight lines. If the price
is $4 but only 6 units are bought and sold, producer surplus will be
a. $16.
b. $18.
c. $24.
d. $26.
33. Refer to Table 7-17. Both the demand curve and the supply curve are straight lines. If the price
is $4 but only 6 units are bought and sold, total surplus will be
a. $42.
b. $48.
c. $54.
d. $60.
Consumers, Producers, and the Efficiency of Markets 1879
34. Refer to Table 7-17. Both the demand curve and the supply curve are straight lines. If 6 units
are bought and sold, then total surplus is
a. $18 lower than it would be if the equilibrium number of units were bought and sold.
b. $22 lower than it would be if the equilibrium number of units were bought and sold.
c. $26 lower than it would be if the equilibrium number of units were bought and sold.
d. $6 higher than it would be if the equilibrium number of units were bought and sold.
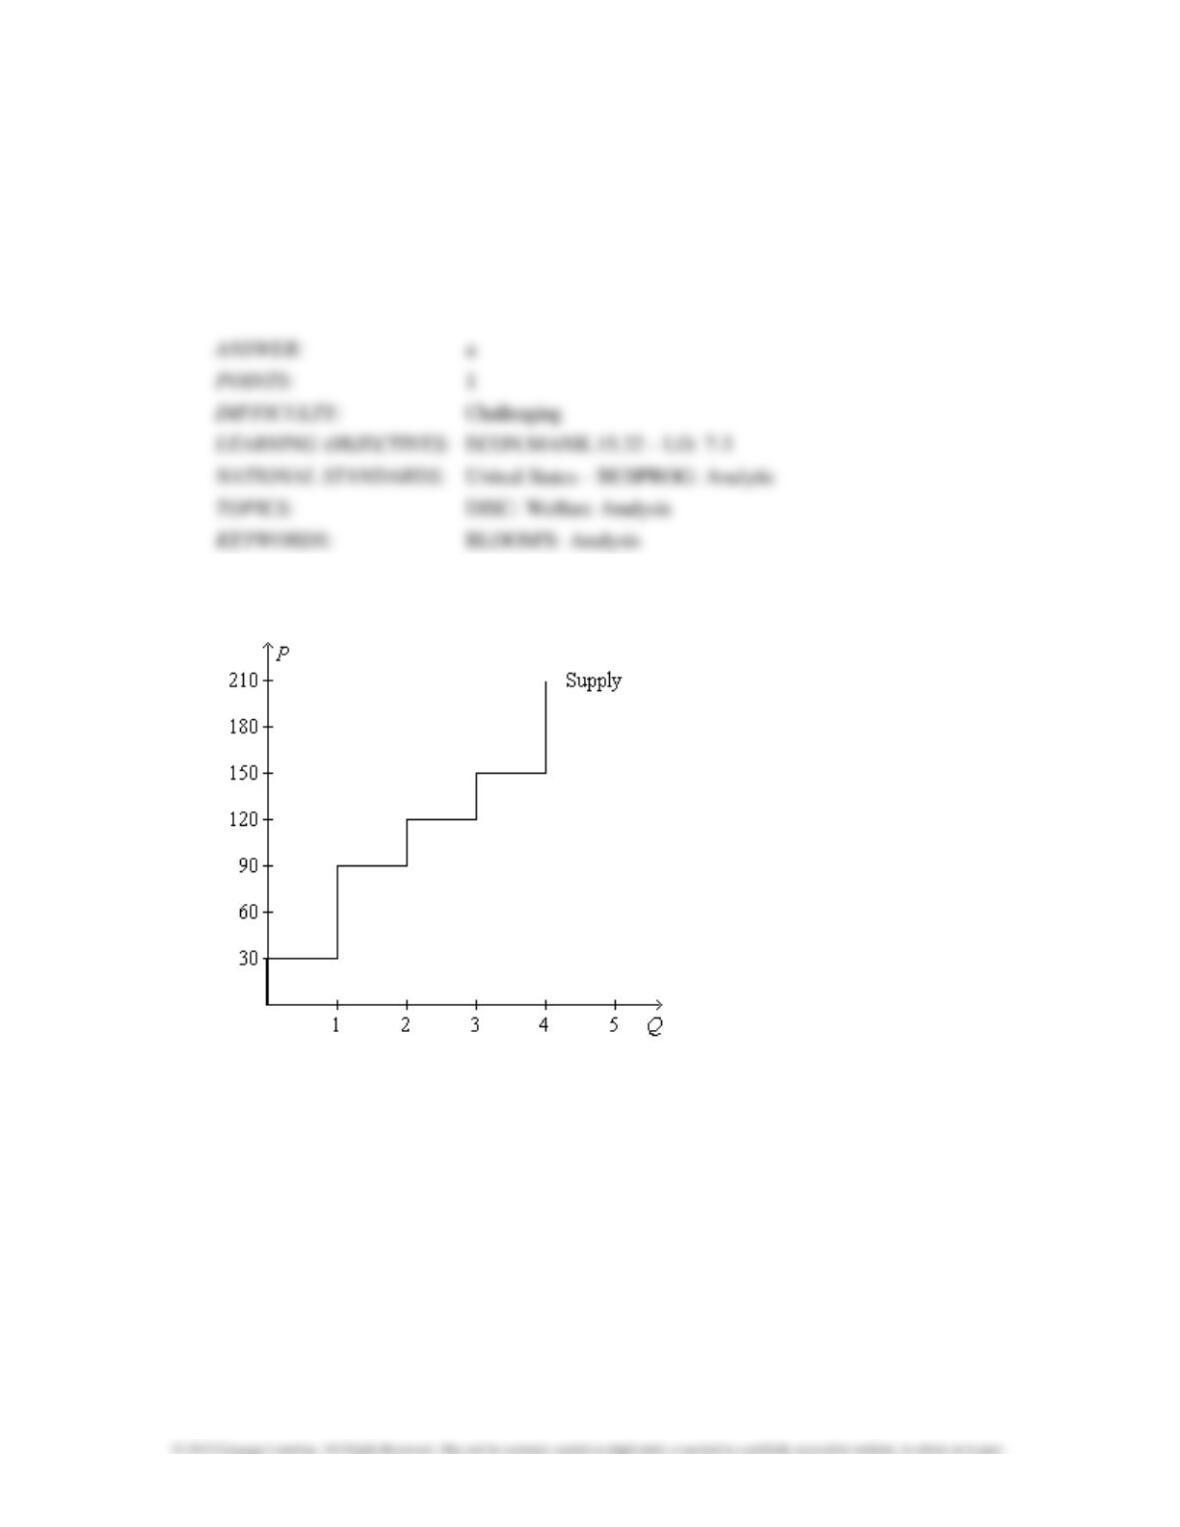
Figure 7-18
1880 Consumers, Producers, and the Efficiency of Markets
35. Refer to Figure 7-18. Suppose the willingness to pay of the marginal buyer of the 3rd unit is
$125. Then total surplus is maximized if
a. 1 unit of the good is produced and sold.
b. 2 units of the good are produced and sold.
c. 3 units of the good are produced and sold.
d. 4 units of the good are produced and sold.
36. Refer to Figure 7-18. If total surplus is $240 and consumer surplus is
a. $100, then the price of the good is $130.
b. $130, then the price of the good is $120.
c. $160, then the price of the good is $100.
d. $120, then the price of the good is $90.
Consumers, Producers, and the Efficiency of Markets 1881
37. Refer to Figure 7-18. Total surplus amounts to $500 if consumer surplus amounts to
a. $290 and if the price of the good is $150.
b. $300 and if the price of the good is $130.
c. $275 and if the price of the good is $160.
d. $400 and if the price of the good is $100.
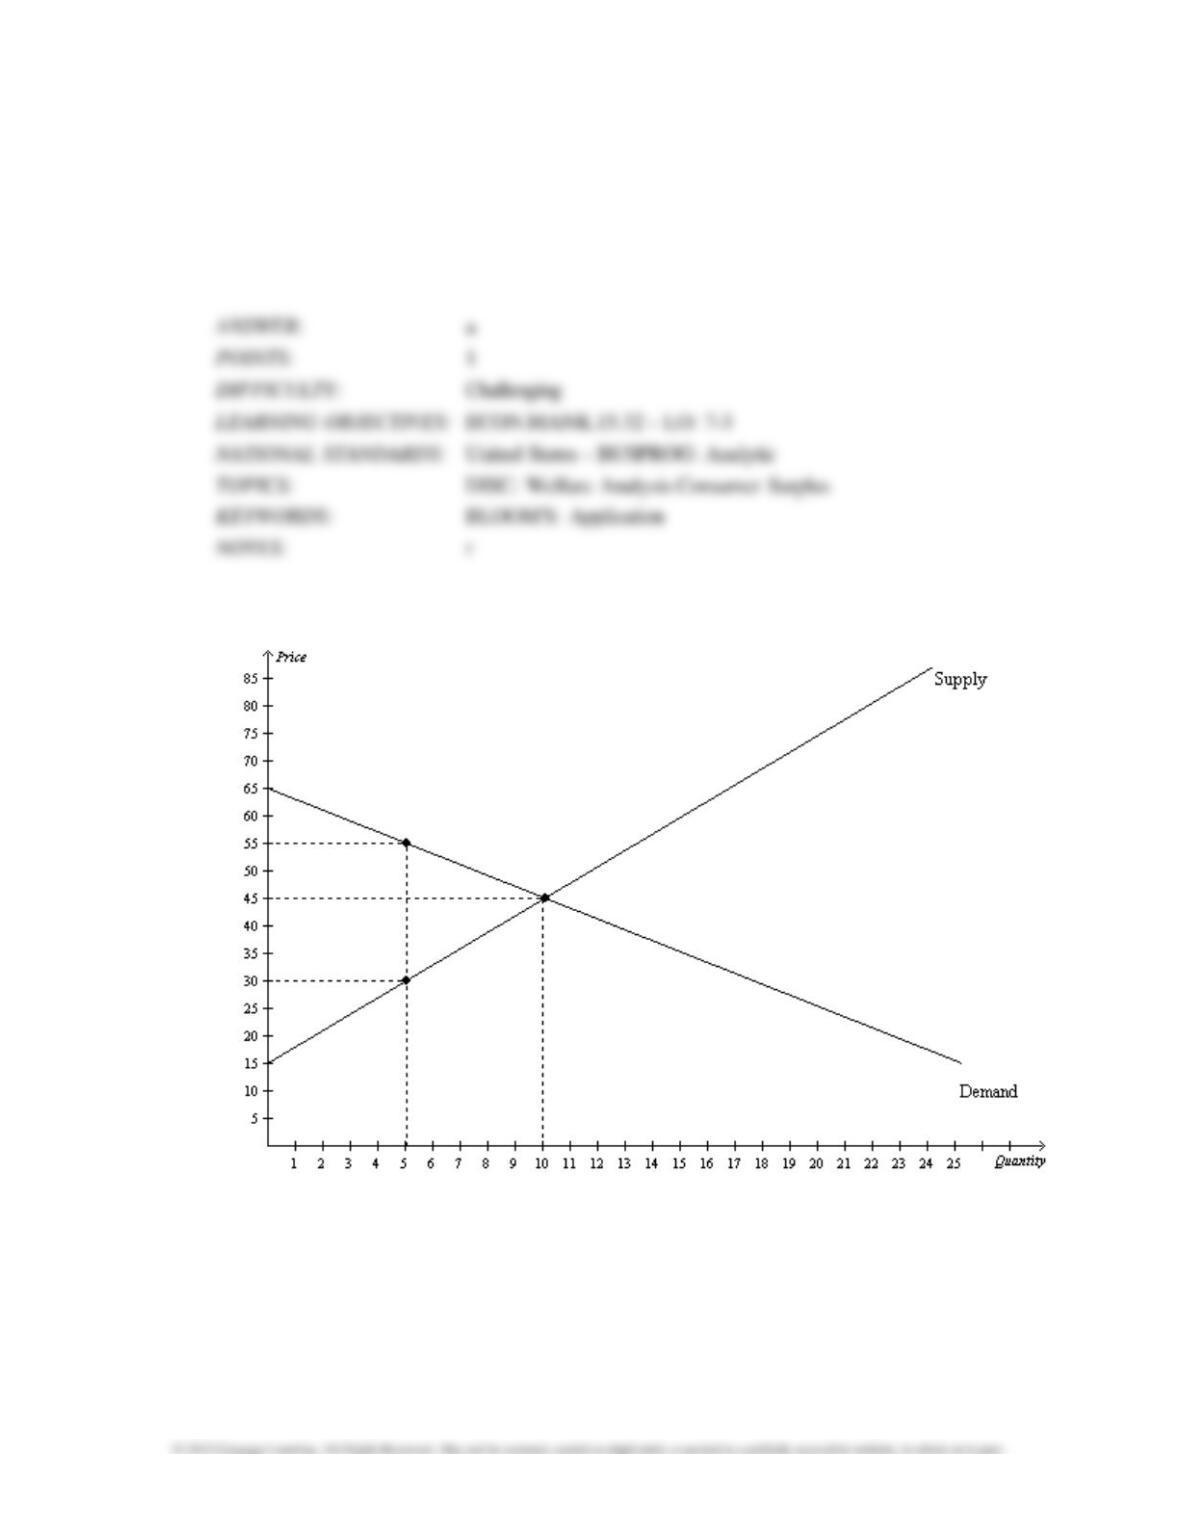
Figure 7-19
1882 Consumers, Producers, and the Efficiency of Markets
38. Refer to Figure 7-19. At the equilibrium price, consumer surplus is
a. $100.
b. $200.
c. $50.
d. $450.
39. Refer to Figure 7-19. At the equilibrium price, producer surplus is
a. $300.
b. $150.
c. $450.
d. $125.
Consumers, Producers, and the Efficiency of Markets 1883
40. Refer to Figure 7-19. At the equilibrium price, total surplus is
a. $125.
b. $450.
c. $250.
d. $500.
41. Refer to Figure 7-19. If the government imposes a price ceiling of $55 in this market, then total
surplus will be
a. $187.50.
b. $125.00.
c. $250.00.
d. $266.67.
1884 Consumers, Producers, and the Efficiency of Markets
42. Refer to Figure 7–19. If the government imposes a price floor of $55 in this market, then total
surplus will be
a. $100.00 higher than it would be without the price floor.
b. $50.00 lower than it would be without the price floor.
c. $125.00 lower than it would be without the price floor.
d. $62.50 lower than it would be without the price floor.
43. Refer to Figure 7–19. If the government imposes a price floor of $55 in this market, then total
surplus will be
a. $137.50.
b. $125.00.
c. $187.50.
d. $275.00.
Consumers, Producers, and the Efficiency of Markets 1885
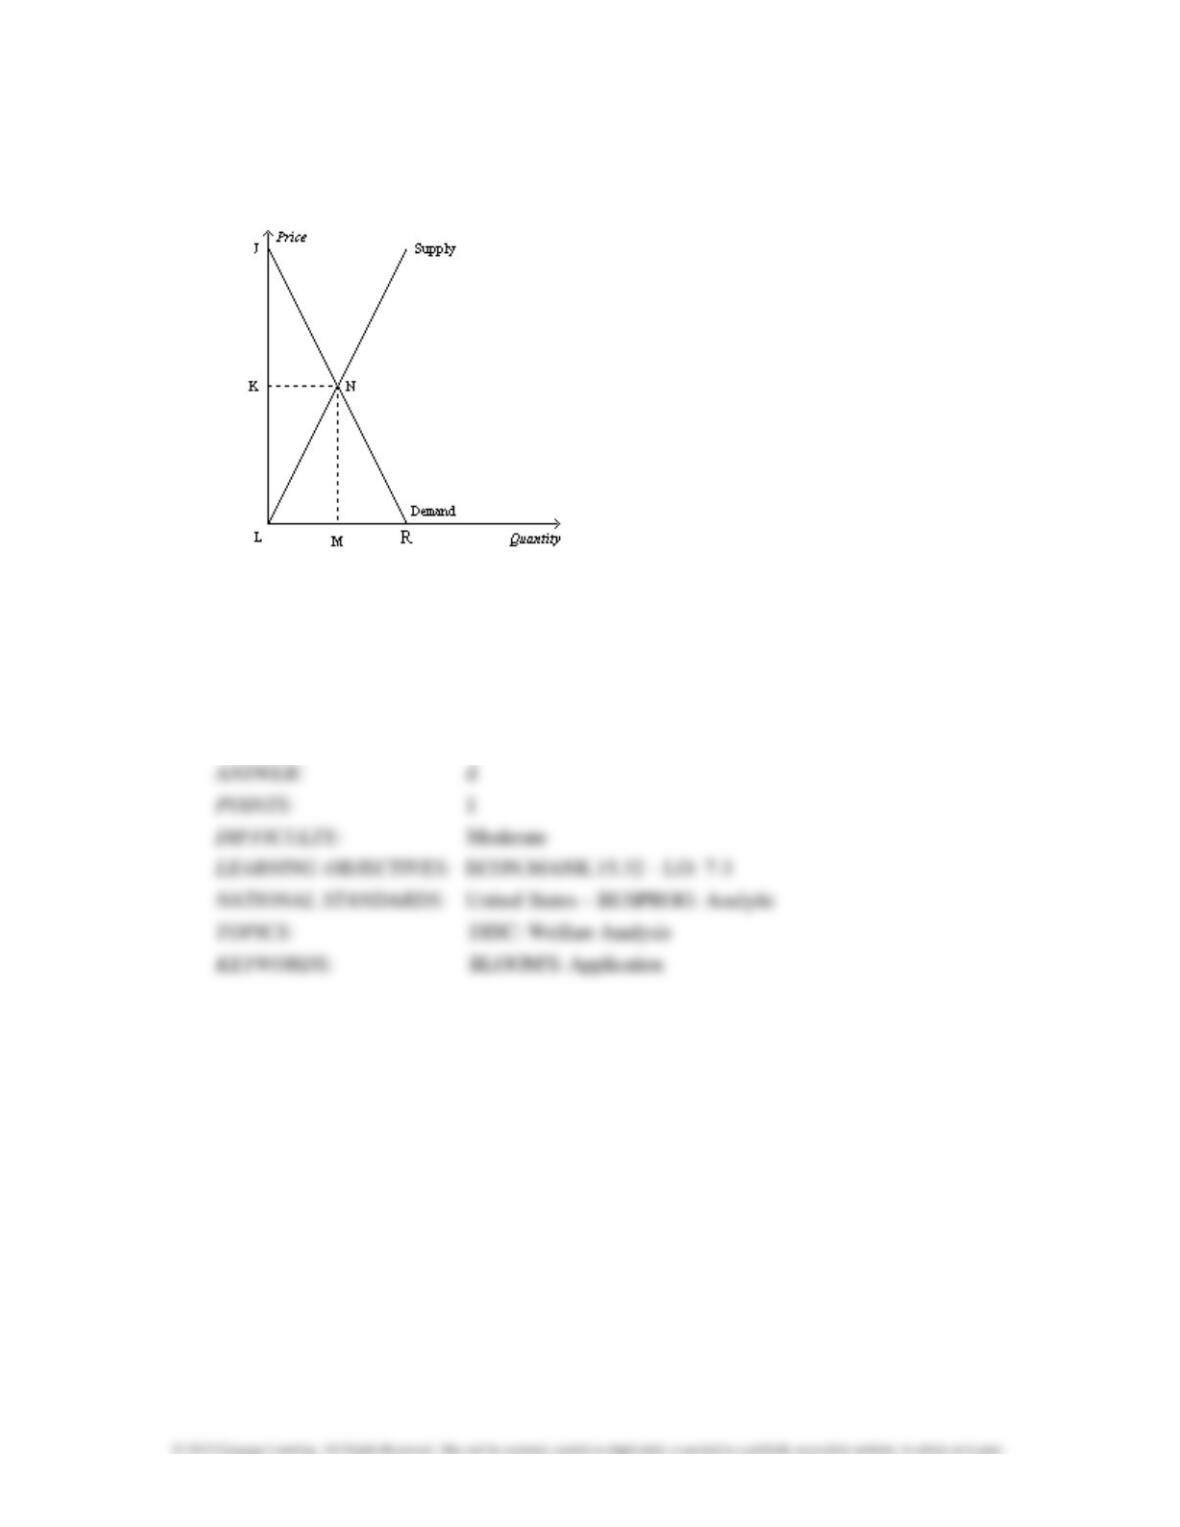
Figure 7-20
44. Refer to Figure 7-20. Total surplus can be measured as the area
a. JNK.
b. JNML.
c. JRL.
d. JNL.
1886 Consumers, Producers, and the Efficiency of Markets
45. Refer to Figure 7-20. For quantities less than M, the value to the marginal buyer is
a. greater than the cost to the marginal seller, so increasing the quantity increases total surplus.
b. less than the cost to the marginal seller, so increasing the quantity increases total surplus.
c. greater than the cost to the marginal seller, so decreasing the quantity increases total surplus.
d. less than the cost to the marginal seller, so decreasing the quantity increases total surplus.
46. Refer to Figure 7-20. For quantities greater than M, the value to the marginal buyer is
a. greater than the cost to the marginal seller, so increasing the quantity increases total surplus.
b. less than the cost to the marginal seller, so increasing the quantity increases total surplus.
c. greater than the cost to the marginal seller, so decreasing the quantity increases total surplus.
d. less than the cost to the marginal seller, so decreasing the quantity increases total surplus.
Consumers, Producers, and the Efficiency of Markets 1887
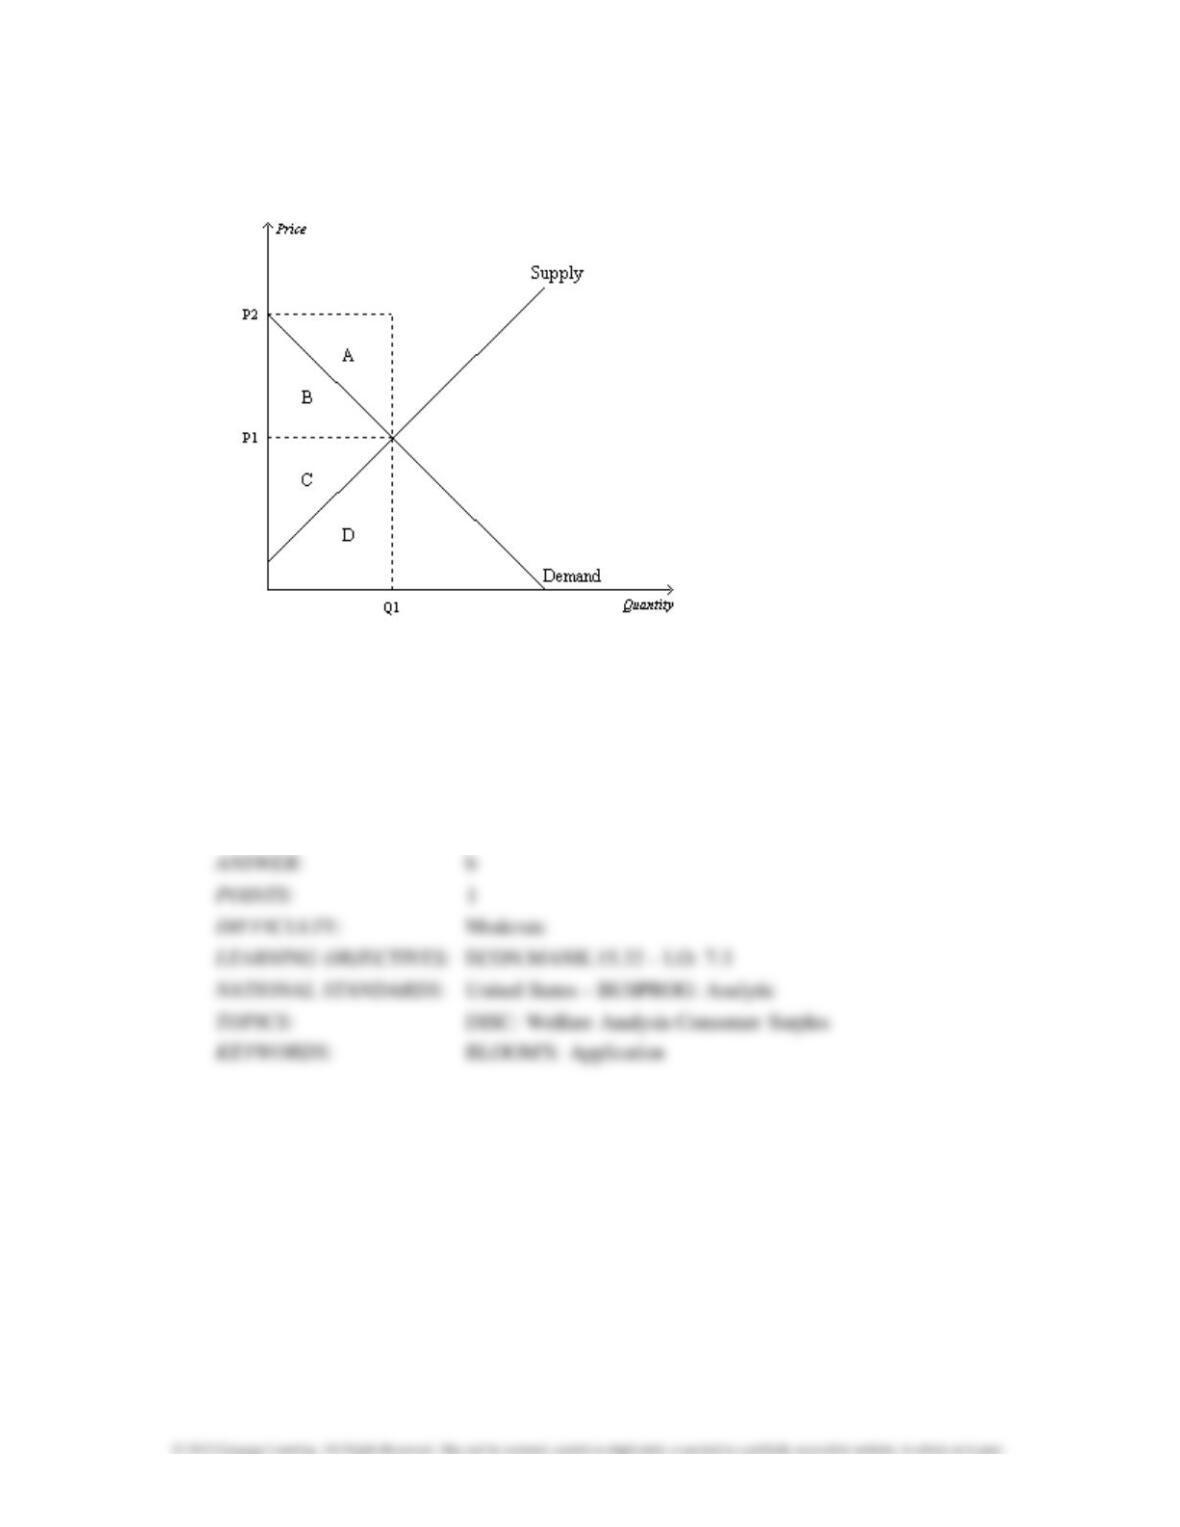
Figure 7-21
47. Refer to Figure 7-21. Which area represents consumer surplus when the price is P1?
a. A
b. B
c. C
d. D
1888 Consumers, Producers, and the Efficiency of Markets
48. Refer to Figure 7-21. When the price is P1, area B represents
a. total surplus.
b. producer surplus.
c. consumer surplus.
d. profits.
49. Refer to Figure 7–21. Which area represents producer surplus when the price is P1?
a. A
b. B
c. C
d. D
50. Refer to Figure 7–21. When the price is P1, area C represents
a. total benefit.
b. producer surplus.
c. consumer surplus.
d. None of the above is correct.
Consumers, Producers, and the Efficiency of Markets 1889
51. Refer to Figure 7–21. When the price is P1, area A represents
a. total benefit.
b. producer surplus.
c. consumer surplus.
d. None of the above is correct.
52. Refer to Figure 7-21. When the price is P1, area B+C represents
a. total surplus.
b. producer surplus.
c. consumer surplus.
d. None of the above is correct.
1890 Consumers, Producers, and the Efficiency of Markets
53. Refer to Figure 7-21. Which area represents total surplus in the market when the price is P1?
a. A+B
b. B+C
c. C+D
d. A+B+C+D
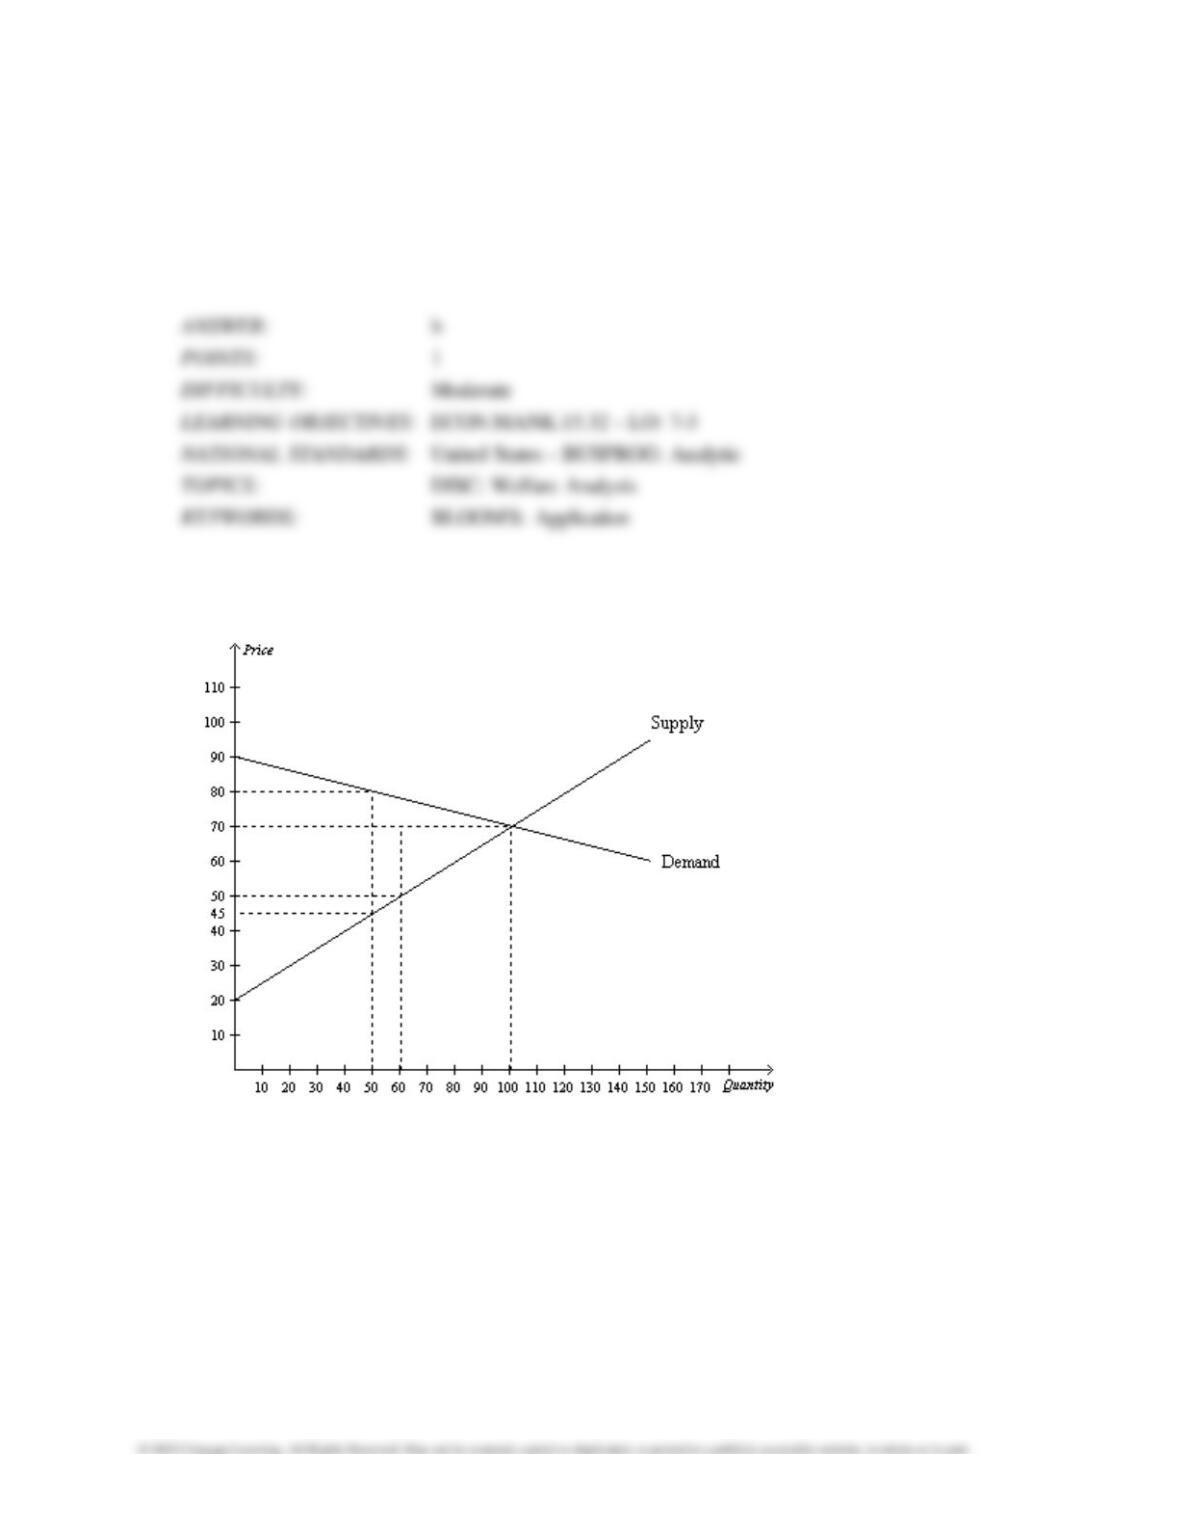
Figure 7-22
Consumers, Producers, and the Efficiency of Markets 1891
54. Refer to Figure 7-22. At the equilibrium price, consumer surplus is
a. $1,000.
b. $2,000.
c. $3,500.
d. $500.
55. Refer to Figure 7-22. If the price decreases from $80 to $70 due to a shift in the supply curve,
consumer surplus increases by
a. $250.
b. $750.
c. $1000.
d. $500.

1892 Consumers, Producers, and the Efficiency of Markets
56. Refer to Figure 7-22. At the equilibrium price, producer surplus is
a. $5,000.
b. $2,500.
c. $3,500.
d. $1,750.
57. Refer to Figure 7-22. At the equilibrium price, total surplus is
a. $2,500.
b. $1,000.
c. $3,500.
d. $7,000.