Chapter 7
34.
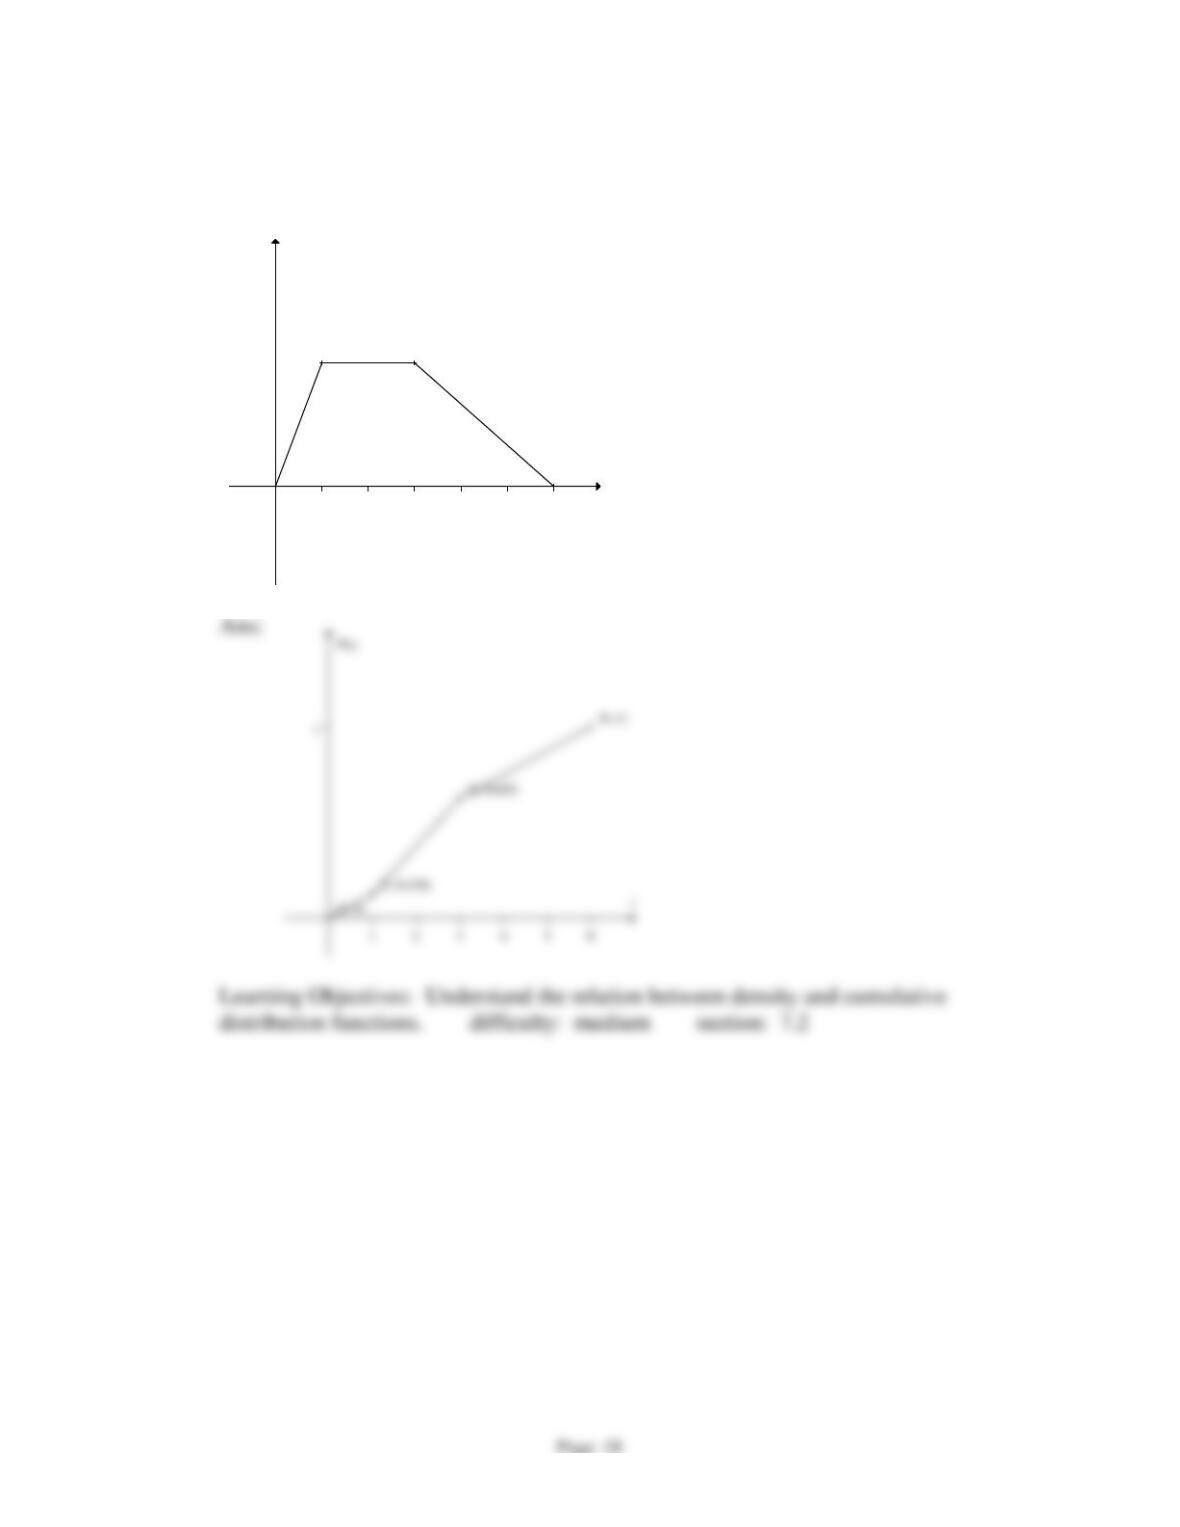
The graph of a probability density function is given. Sketch a graph of the cumulative
distribution function.
(0, 0)
(1, 0.25)(1, 0.25) (3, 0.25)(3, 0.25)
(6, 0)
1 2 3 4 5 6
t
p(t)
Chapter 7
35.
A banana plant typically has about 40 leaves that emerge over a period of 238 days (8
months). Younger leaves emerge more rapidly than later leaves. If you randomly
select a banana leaf, the probability density function for the month of emergence is
given by
( ) 0.294 0.088(1.016 )
t
pt =−
. If you select a banana leaf at random, what is
the probability that it emerged in the first 4 months?
A)
0.69
B)
0.23
C)
0.87
D)
0.55
distribution functions. difficulty: easy section: 7.2
36.
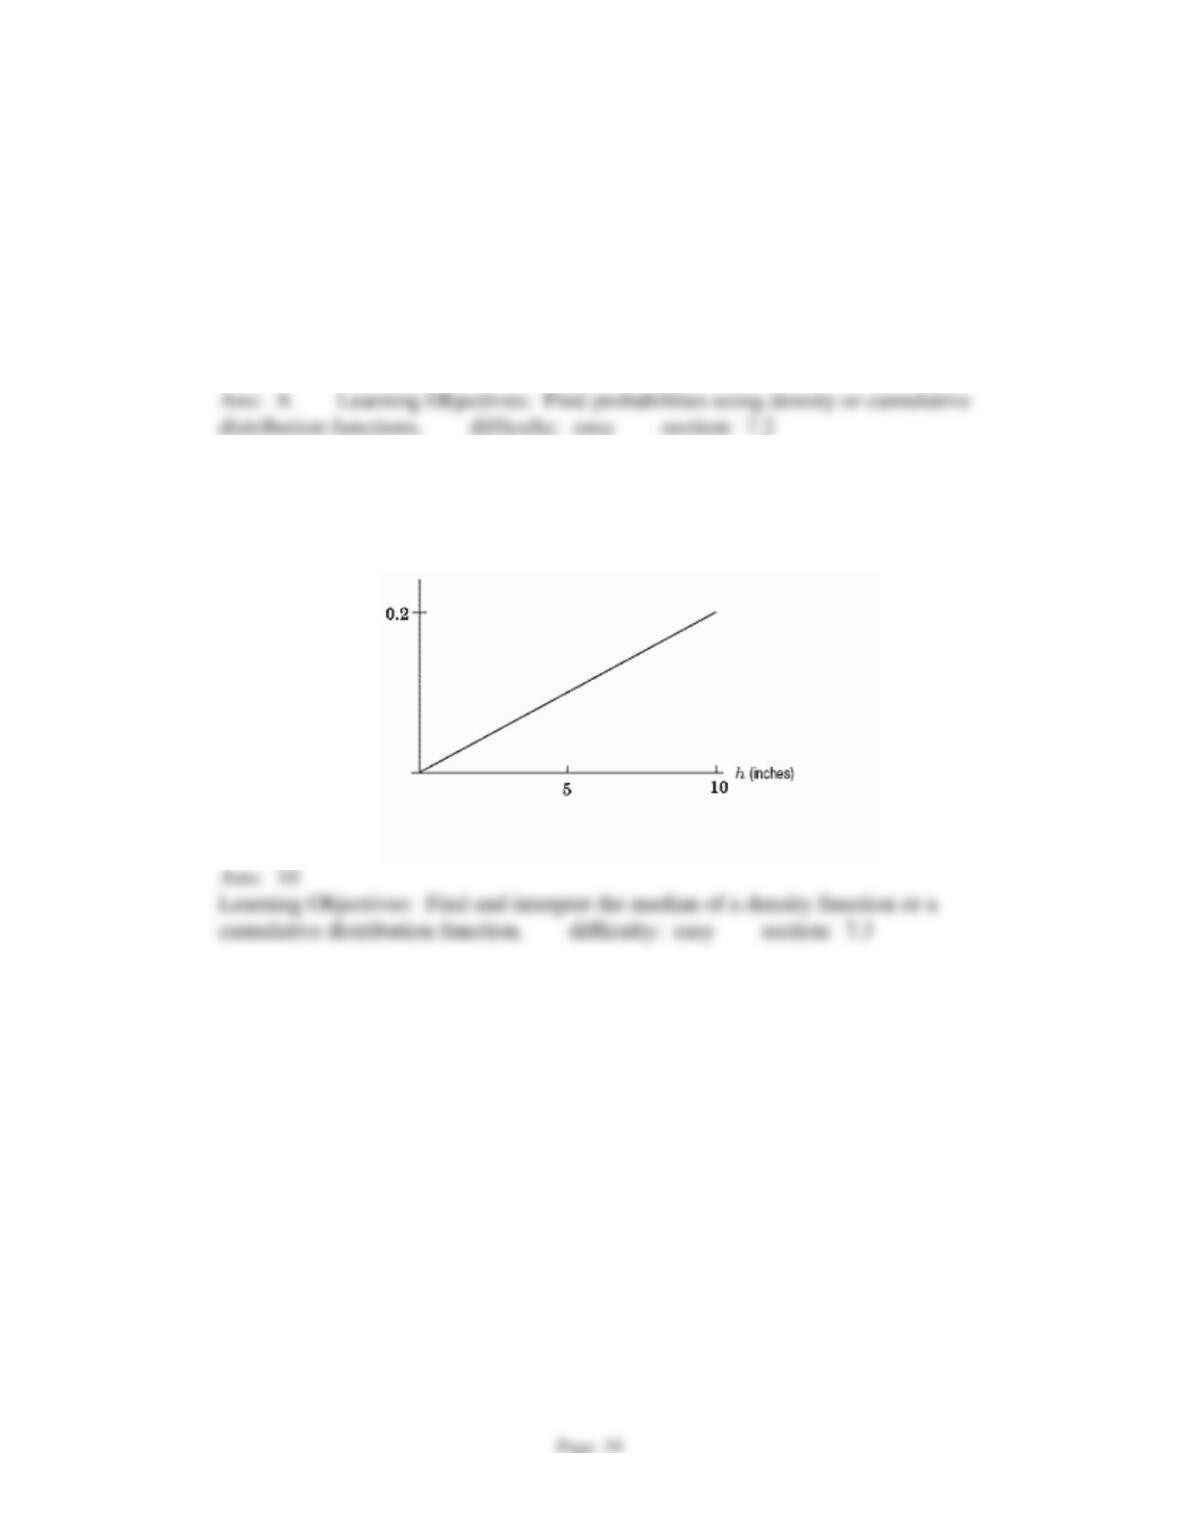
The heights, in inches, of flowers in a garden have the density function shown in the
following figure. How many inches tall is the tallest flower?
Ans:
10
cumulative distribution function. difficulty: easy section: 7.3
Chapter 7
37.
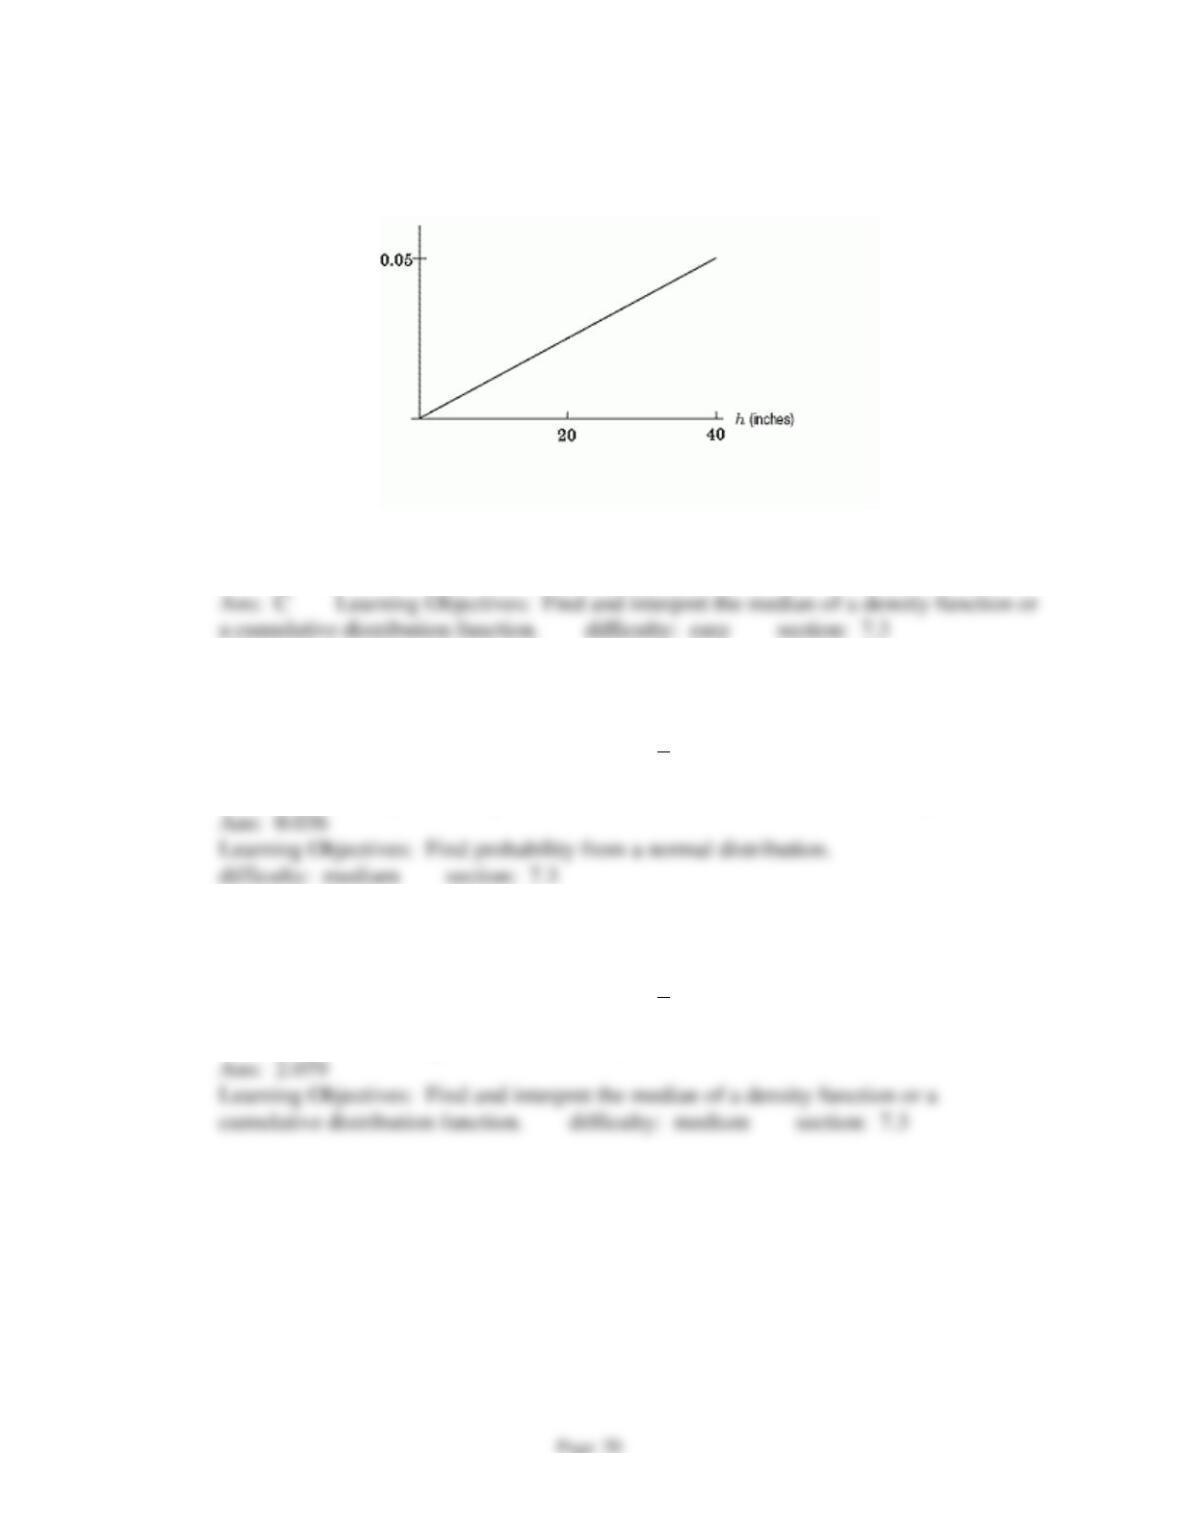
The heights, in inches, of flowers in a garden have the density function shown in the
following figure. The median height is
A)
less than 20 inches.
B)
equal to 20 inches.
C)
greater than 20 inches.
a cumulative distribution function. difficulty: easy section: 7.3
38.
The probability of waiting no more than m minutes for a taxi on a certain street corner is
P(
tm
) =
/3
0
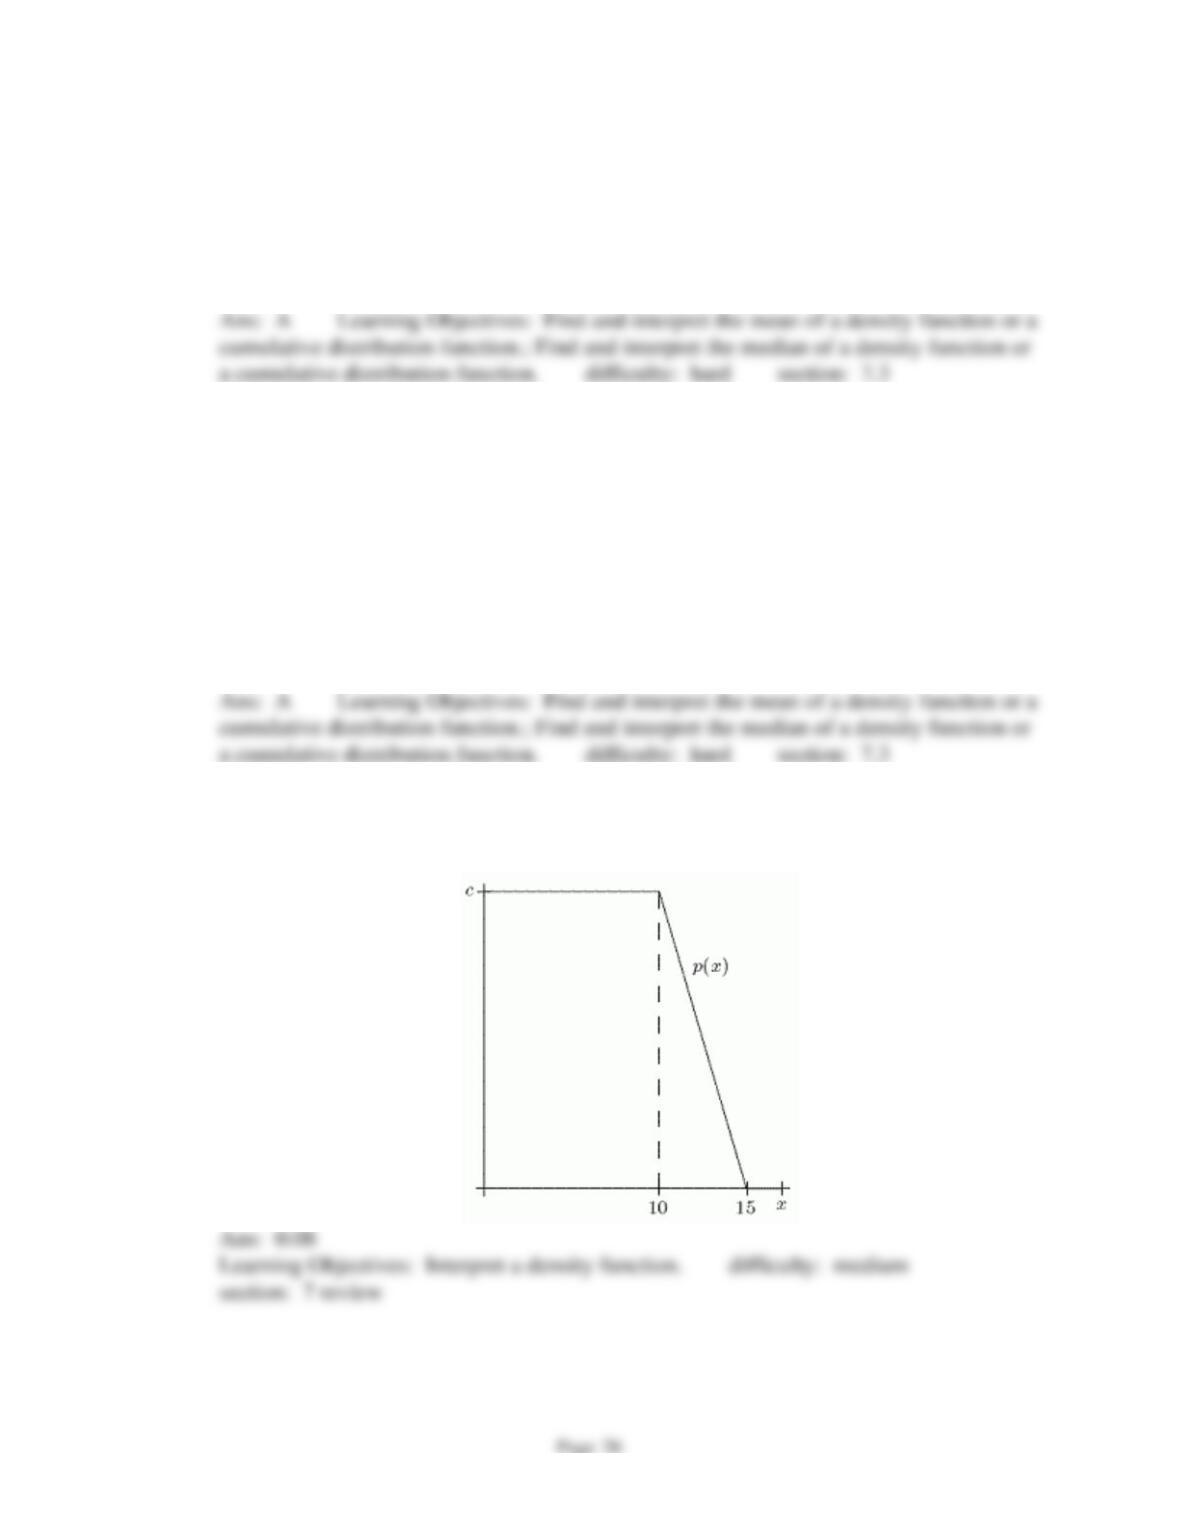
1
3
mt
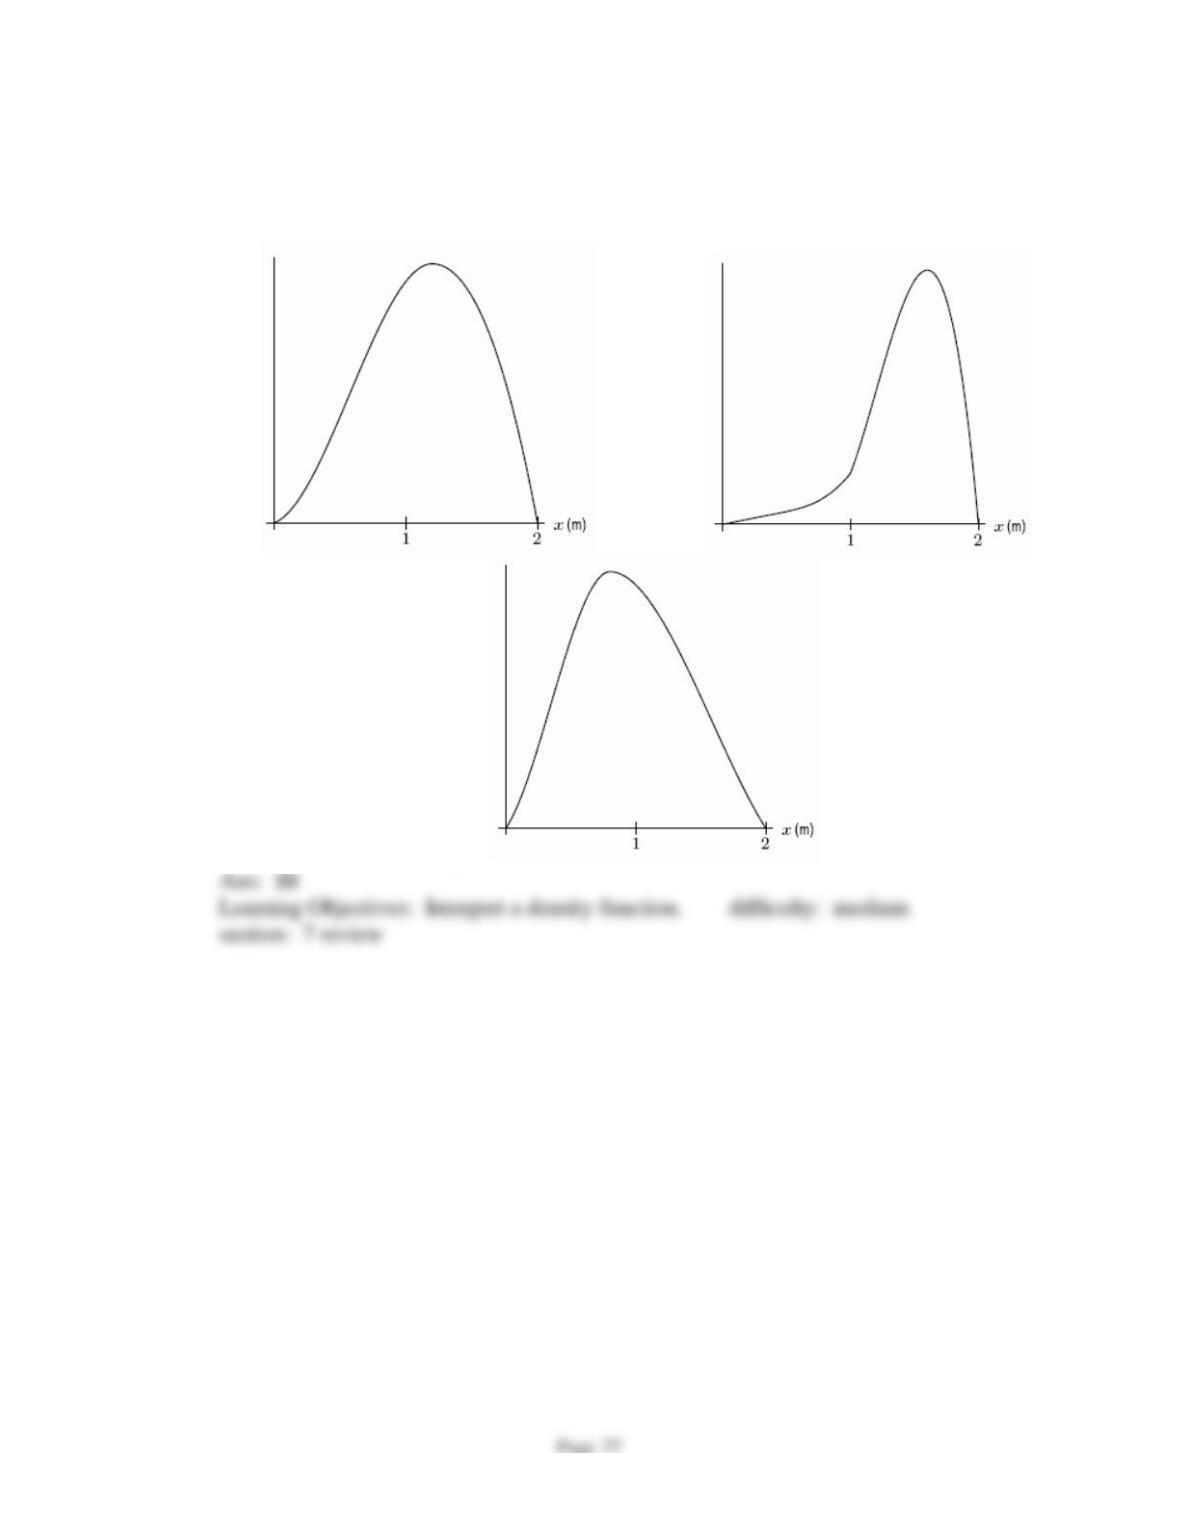
e dt
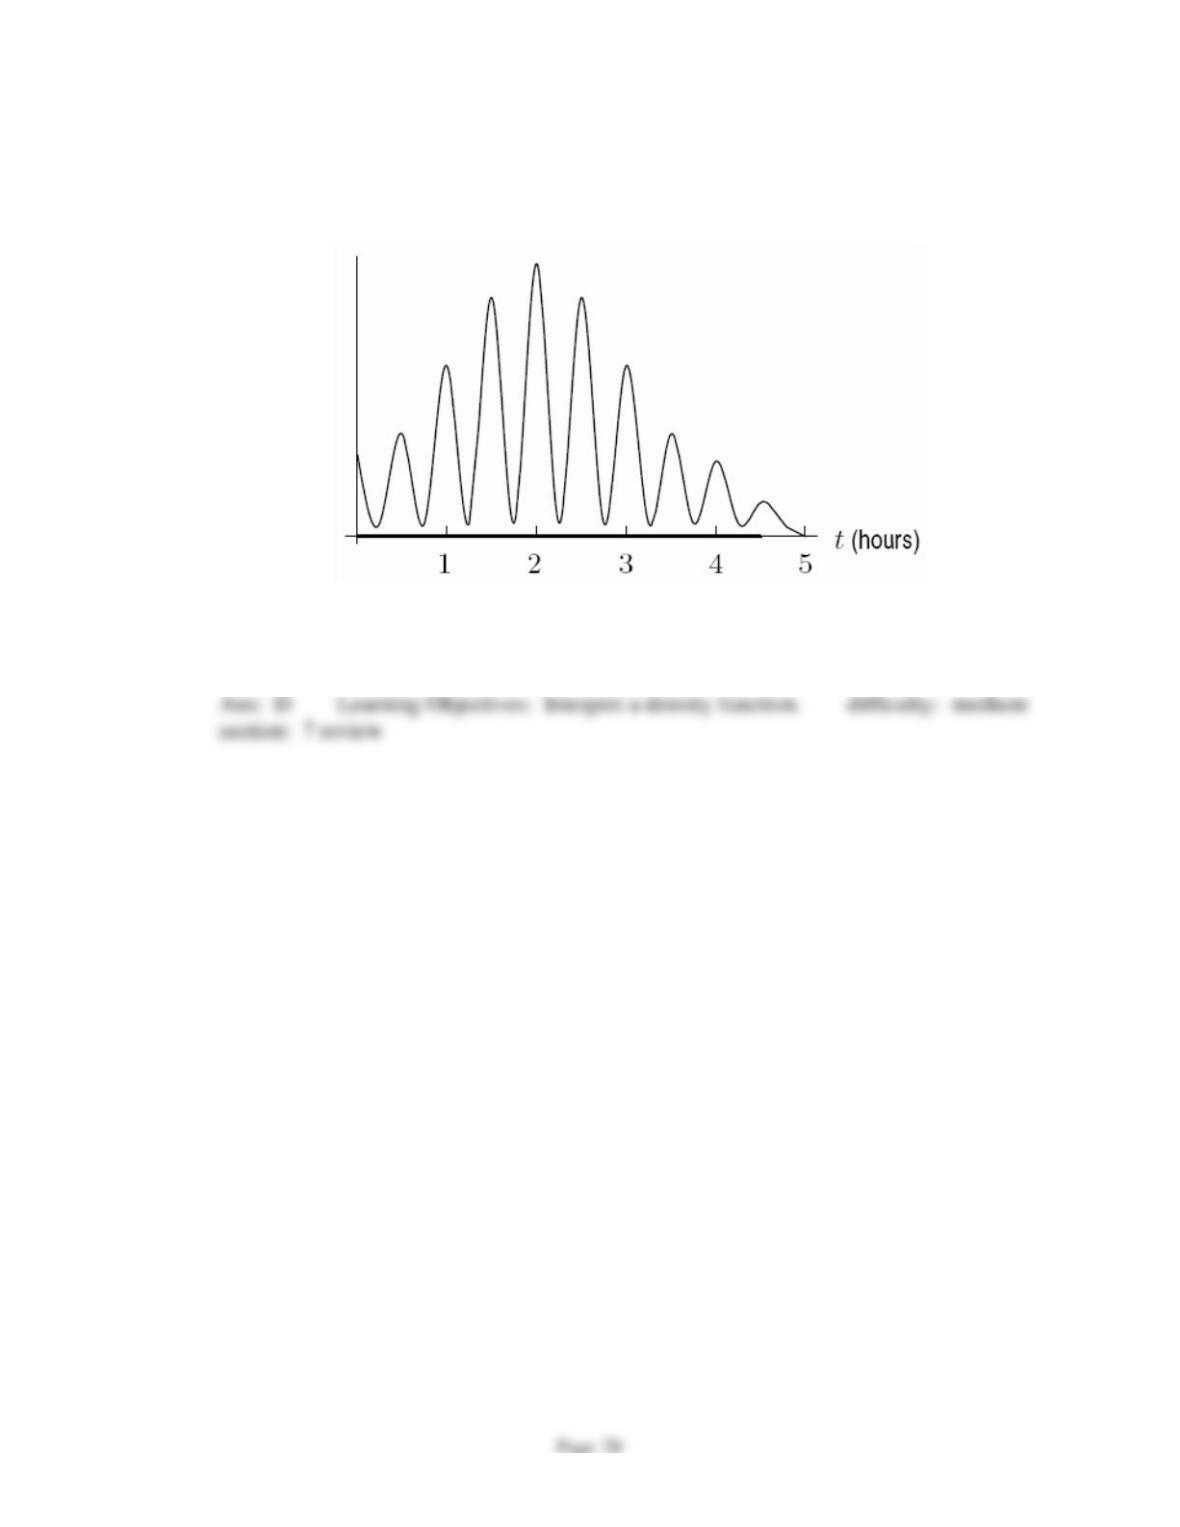
−
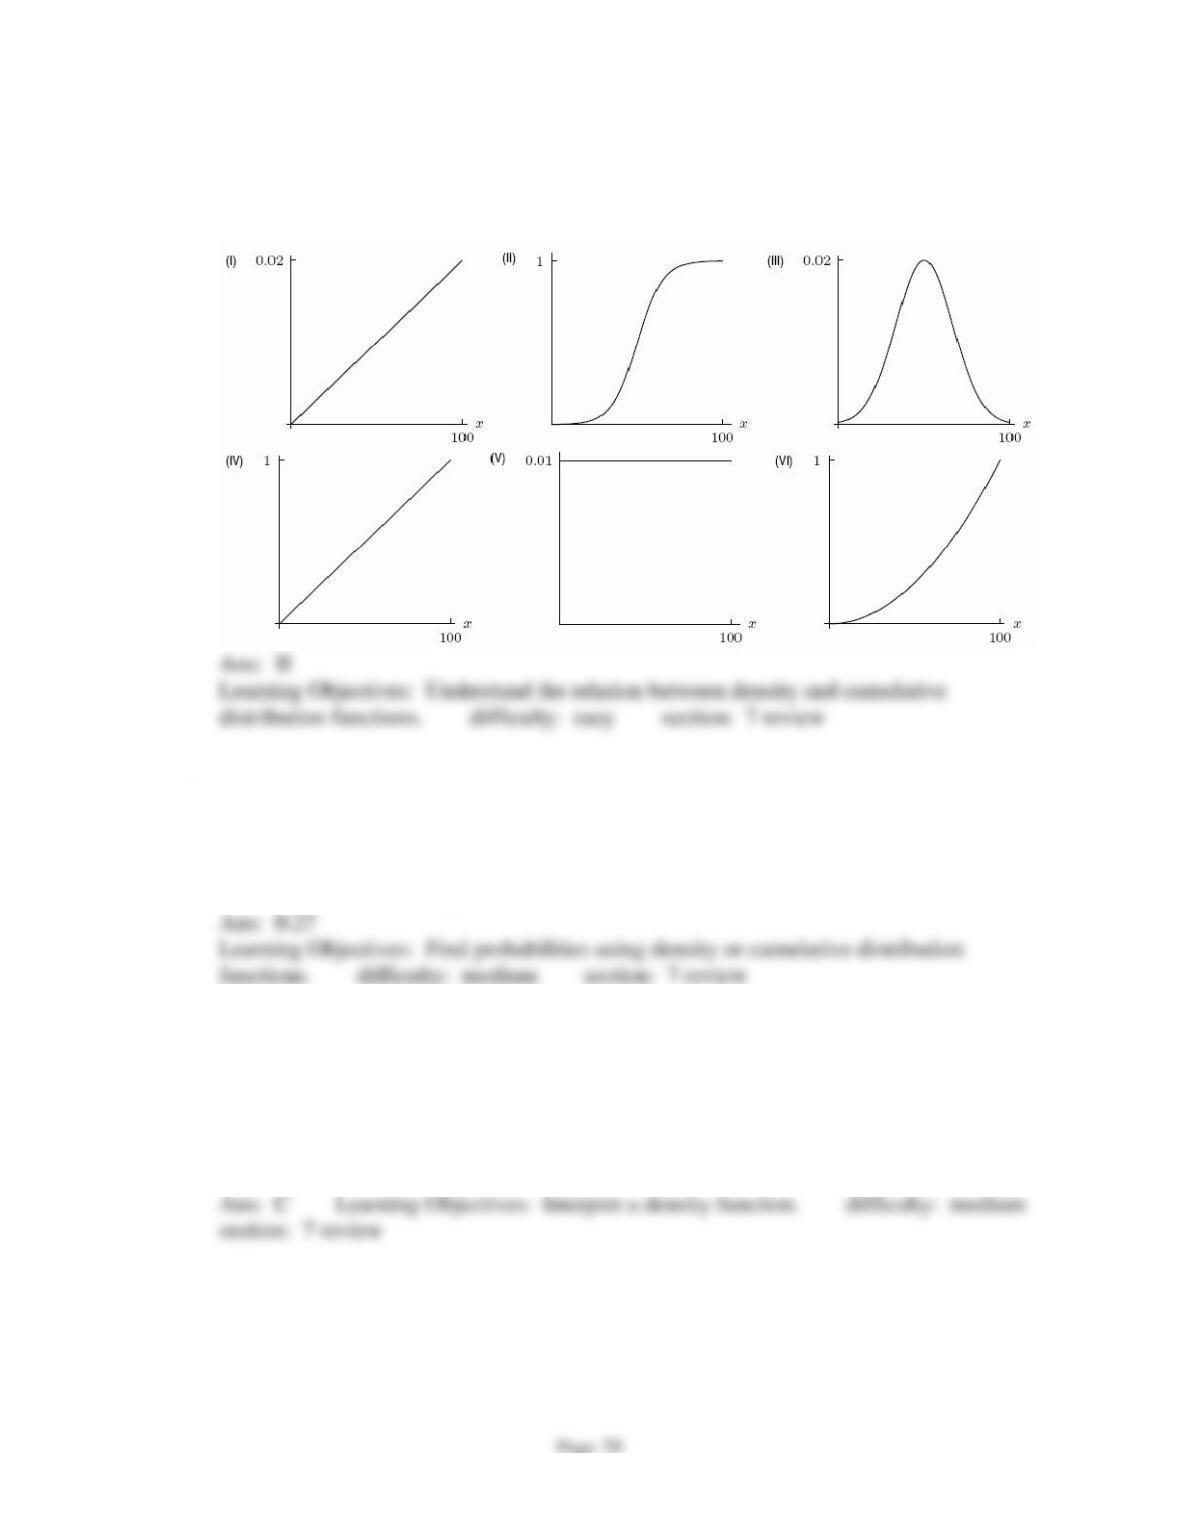
.
Find the probability of waiting more than 10 minutes. Round to 3 decimal places.
Ans:
0.036
difficulty: medium section: 7.3
39.
The probability of waiting no more than m minutes for a taxi on a certain street corner is
P(
tm
) =
/3
0
1
3
mt
e dt
−
.
Find the median waiting time to 3 decimal places.
Ans:
2.079
Chapter 7
Page 21
40.
The probability of waiting no more than m minutes for a taxi on a certain street corner is
P(
tm
) =
/3
0
1
3
mt
e dt
−
.
Find the mean waiting time.
41.
Let
()Px
be the cumulative distribution function for the number of credits taken by
students at a community college. Some values of
()Px
are shown in the following
table. What fraction of the students took between 12 and 18 credits?
number of credits
3
6
9
12
15
18
()Px
0.20
0.32
0.45
0.50
0.81
0.99
42.
Let
()Px
be the cumulative distribution function for the number of credits taken by
students at a community college. Some values of
()Px
are shown in the following
table. What was the median number of credit hours taken by the students?
number of credits
3
6
9
12
15
18
()Px
0.20
0.32
0.45
0.50
0.81
0.99
43.
The density function for lunch time taken by a group of office workers is given by
3
( ) 4p t t=
. The maximum allowable lunch time is 1 hour, so we have
01t
.
A. Find the median number of hours taken, to 2 decimal places.
B. Find the mean number of hours taken, to 2 decimal places.
Chapter 7
Page 22
44.
The density function for the time to complete a certain task is approximately equal to
0.21
( ) 0.21 t
p t e−
=
, where t is time in minutes and
0 50t
.
A. Find the median number of minutes taken, to 2 decimal places.
B. Find the mean number of minutes taken, to 2 decimal places.
45.
The final exam scores for a calculus course were approximately normally distributed
with mean
73
=
and standard deviation
9
=
. The maximum possible score was
100. What is the probability that a randomly selected student received an A grade (90
or higher)? Round to 3 decimal places.
Ans:
0.028
Learning Objectives: Find probability from a normal distribution. difficulty: easy
section: 7.3
46.
The lifespan of a bug is approximately normally distributed with mean
9
=
days and
standard deviation
2.5
=
days. Assume a maximum possible lifespan of 3 weeks.
What is the probability of a randomly selected bug living less than a week? Round to 2
decimal places.
Ans:
0.21
Learning Objectives: Find probability from a normal distribution. difficulty: easy
section: 7.3
Part A:
A. 3.30
Part B:
B. 4.76
distribution function.; Find and interpret the median of a density function or a
cumulative distribution function. difficulty: medium section: 7.3
Chapter 7
47.
The annual rainfall for a desert city is approximately normally distributed with mean 4
and standard deviation 1. Which of the following is the density function for annual
rainfall?
A)
2
( 4)
1
() 2
x
p x e
−−
=
B)
2
( 1) / 4
1
() 2
x
p x e
−−
=
C)
2
( 1) /32
1
() 2
x
p x e
−−
=
D)
2
( 4) / 2
1
() 2
x
p x e
−−
=
Ans: D Learning Objectives: Find probability from a normal distribution.
difficulty: medium section: 7.3
48.
The annual rainfall for a desert city is approximately normally distributed with mean 7
and standard deviation 1. What is the probability that the annual rainfall will be
between 6 and 8 inches? Round to 2 decimal places.
Ans:
0.68
Learning Objectives: Find probability from a normal distribution.
difficulty: medium section: 7.3
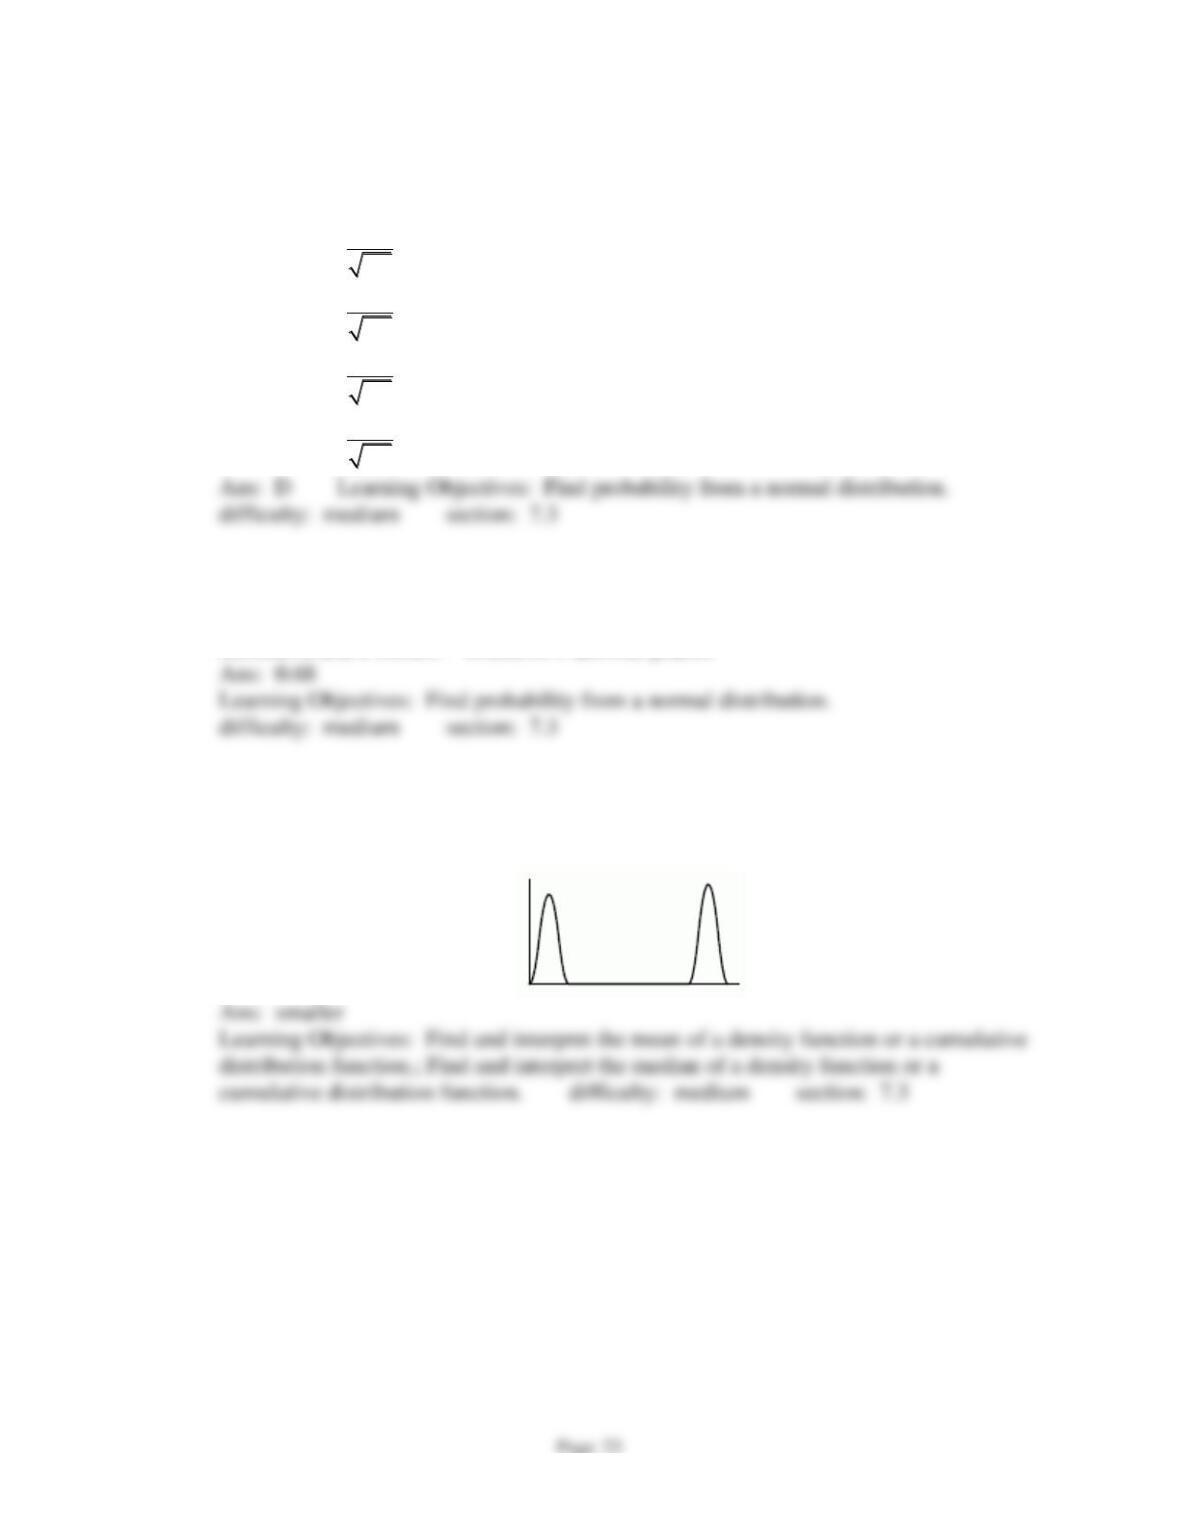
49.
In the following probability density function, is the mean smaller or greater than the
median?
Ans:
smaller
Learning Objectives: Find and interpret the mean of a density function or a cumulative
distribution function.; Find and interpret the median of a density function or a
cumulative distribution function. difficulty: medium section: 7.3
Chapter 7
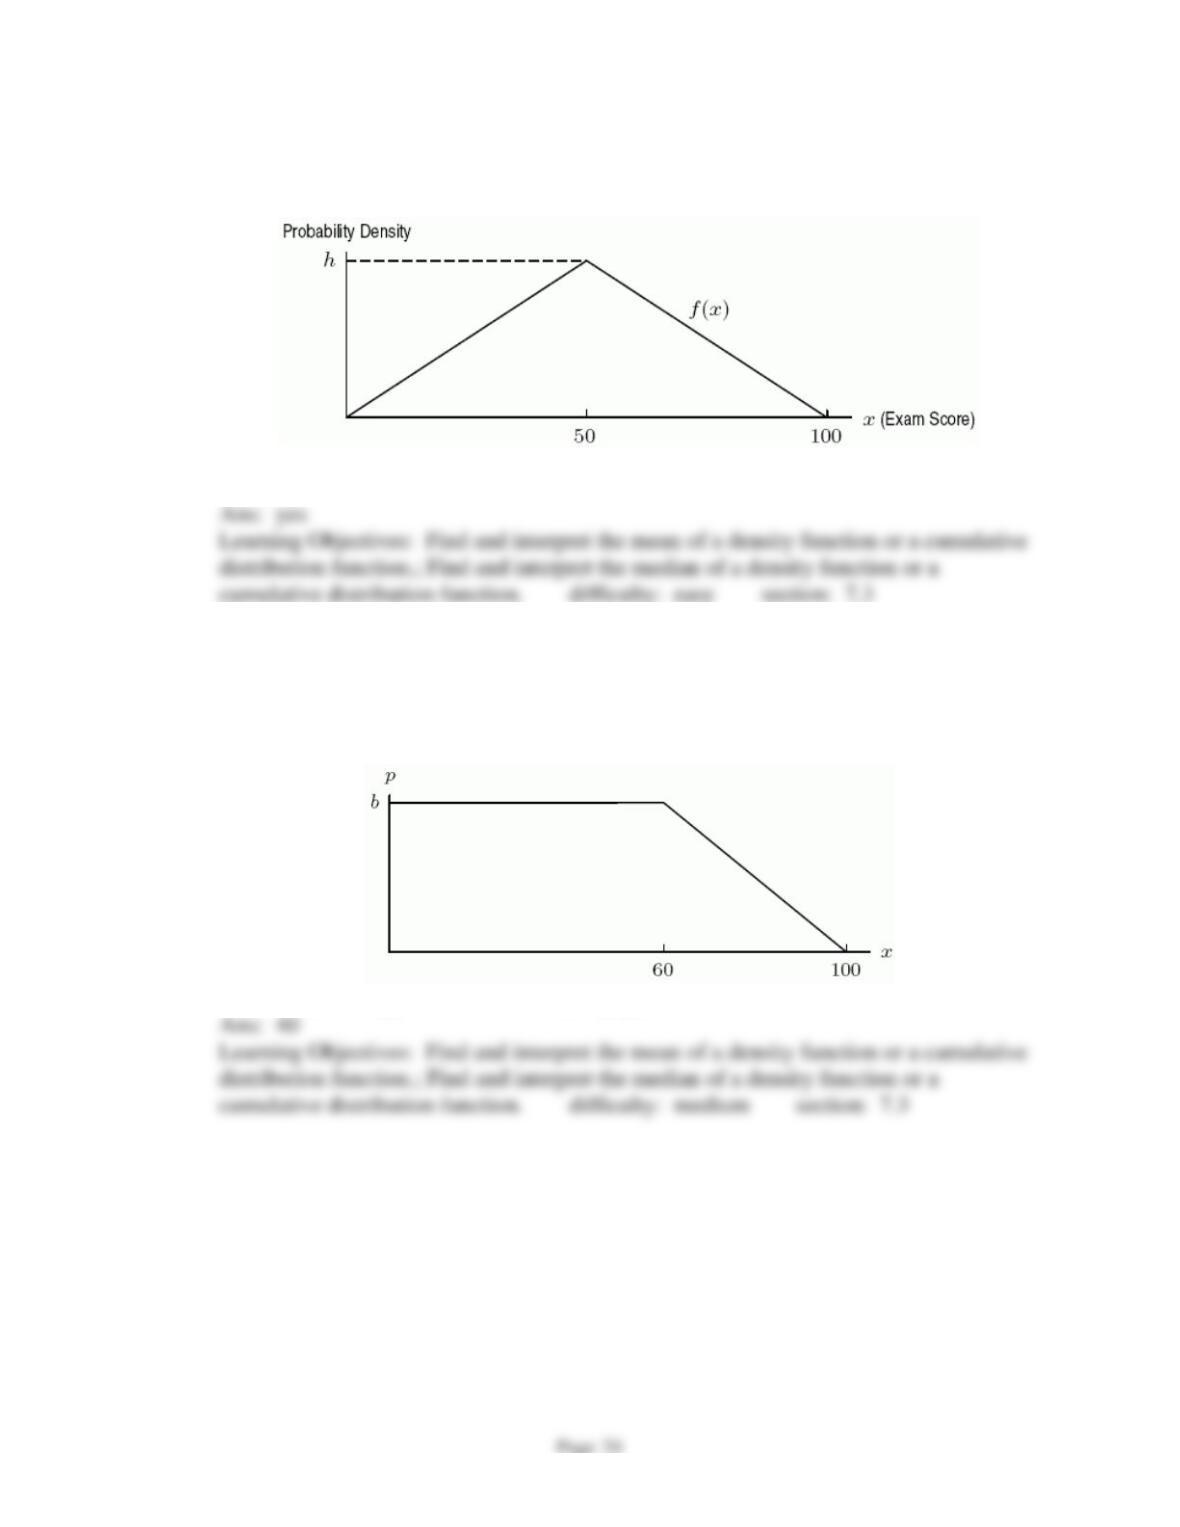
50.
A professor far away from here gives the same 100-point final exam year after year and
discovers that the students’ scores tend to follow the triangular probability density
function f(x) pictured below:
Do the mean and the median both describe the same point on this probability density
function?
51.
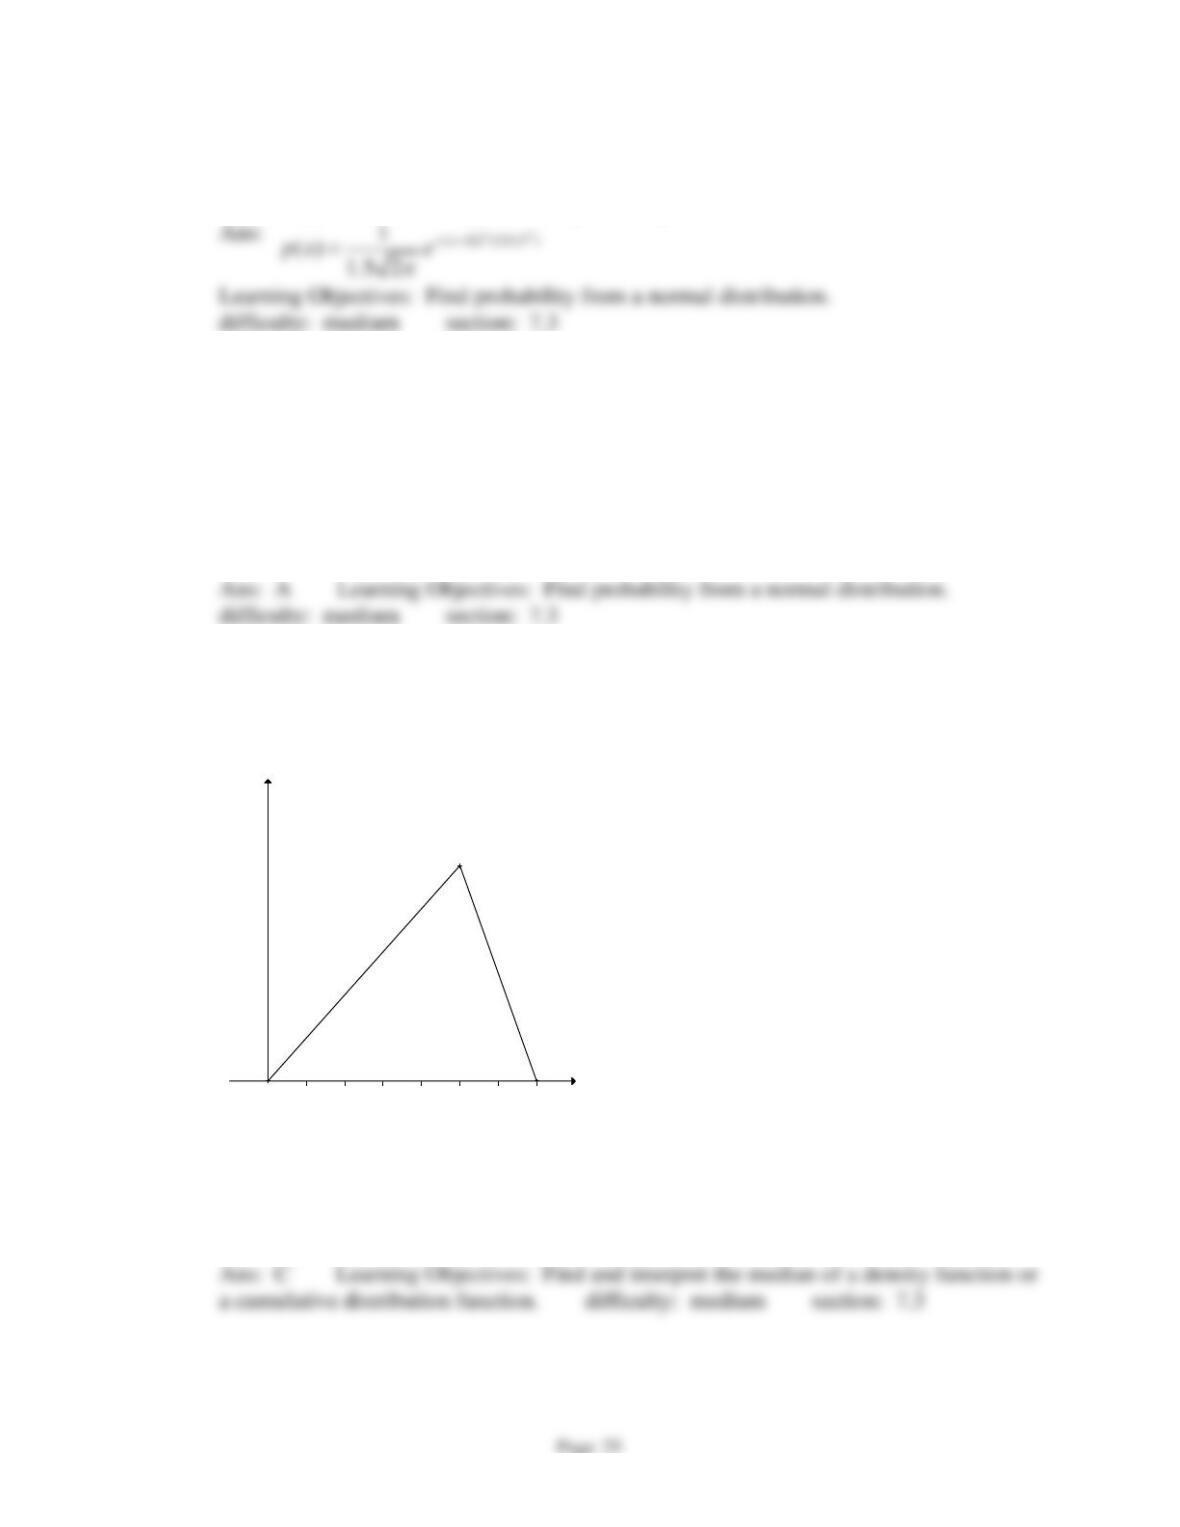
Suppose that the distribution of people’s ages in the United States is essentially constant,
or uniform, from age 0 to age 60, and from there it decreases linearly until age 100. This
distribution p(x) is shown below, where x is age in years, and p measures probability
density. Such a probability distribution is called trapezoidal.
Find the median age of the United States population.
Chapter 7
52.
According to data from 2007, the height of five-year-old girls is normally distributed
with a mean of 42 inches and a standard deviation of 1.5 inches. Write the formula for
the density function for height of five-year-old girls.
Learning Objectives: Find probability from a normal distribution.
difficulty: medium section: 7.3
53.
According to data from 2007, the height of five-year-old girls is normally distributed
with a mean of 42 inches and a standard deviation of 1.5 inches. Use your calculator or
computer to find the percentage of 5-year-old girls between 43 and 44 inches.
A)
25
B)
22
C)
12
D)
83
Ans: A Learning Objectives: Find probability from a normal distribution.
difficulty: medium section: 7.3
54.
The density function for the shelf life, in days, of a product in a grocery store is shown
in the graph.
Estimate the median shelf life of the product.
A)
2.25 days
B)
3.25 days
C)
4.25 days
D)
5.25 days
(0, 0)
(5, 0.286)(5, 0.286)
(7, 0)
1 2 3 4 5 6 7
t
p(t)
Ans: C Learning Objectives: Find and interpret the median of a density function or
a cumulative distribution function. difficulty: medium section: 7.3
Chapter 7
55.
A density function is given by
2
( ) 0.148 ( 3)p t t t=−
for
03t
. Estimate the median
of the distribution.
A)
1.16
B)
1.54
C)
1.02
D)
1.78
a cumulative distribution function. difficulty: hard section: 7.3
56.
A banana plant typically has about 40 leaves that emerge over a period of 238 days (8
months). Younger leaves emerge more rapidly than later leaves. If you randomly
select a banana leaf, the probability density function for the month of emergence is
given by
( ) 0.294 0.088(1.016 )
t
pt =−
. Use a calculator or computer to find the
median time of emergence.
A)
2.7 months
B)
2.4 months
C)
3.3 months
D)
4.0 months
57.
Using the following figure, calculate the value of c if p is a density function.
Ans:
0.08
section: 7 review
Chapter 7
58.
Each of the following density functions represents the heights of a group of people in a
community. Which one most likely represents the heights of a group consisting of only
the children in the community?
I. II.
III.
Chapter 7
59.
The following figure shows the distribution of the number of hours of television viewed
per day by a group of children. Estimate the percent of the children who watched less
than 3 hours per day.
A)
65%
B)
95%
C)
50%
D)
80%
section: 7 review
Chapter 7
60.
Suppose scores from a standardized test measure from 0 to 100. If most scores were in
the middle (with few extremely high or low scores), pick the graph that best represents
the cumulative distribution function.
Ans:
Learning Objectives: Understand the relation between density and cumulative
distribution functions. difficulty: easy section: 7 review
61.
The probability of a plant surviving t days without water is given by
0
t
cx
ce dx
−
for some
constant c. If the probability of the plant surviving 6 days without water is 0.8, what is
c? Round to 2 decimal places.
Ans:
0.27
Learning Objectives: Find probabilities using density or cumulative distribution
functions. difficulty: medium section: 7 review
62.
Which of the following functions makes the most sense as a model for the probability
density function representing a random value chosen between 0 and 1?
A)
( ) 2p t t=
for
01t
B)
( ) 2 2p t t=−
for
01t
C)
( ) 1pt =
for
01t
Ans: C Learning Objectives: Interpret a density function. difficulty: medium
section: 7 review
Chapter 7
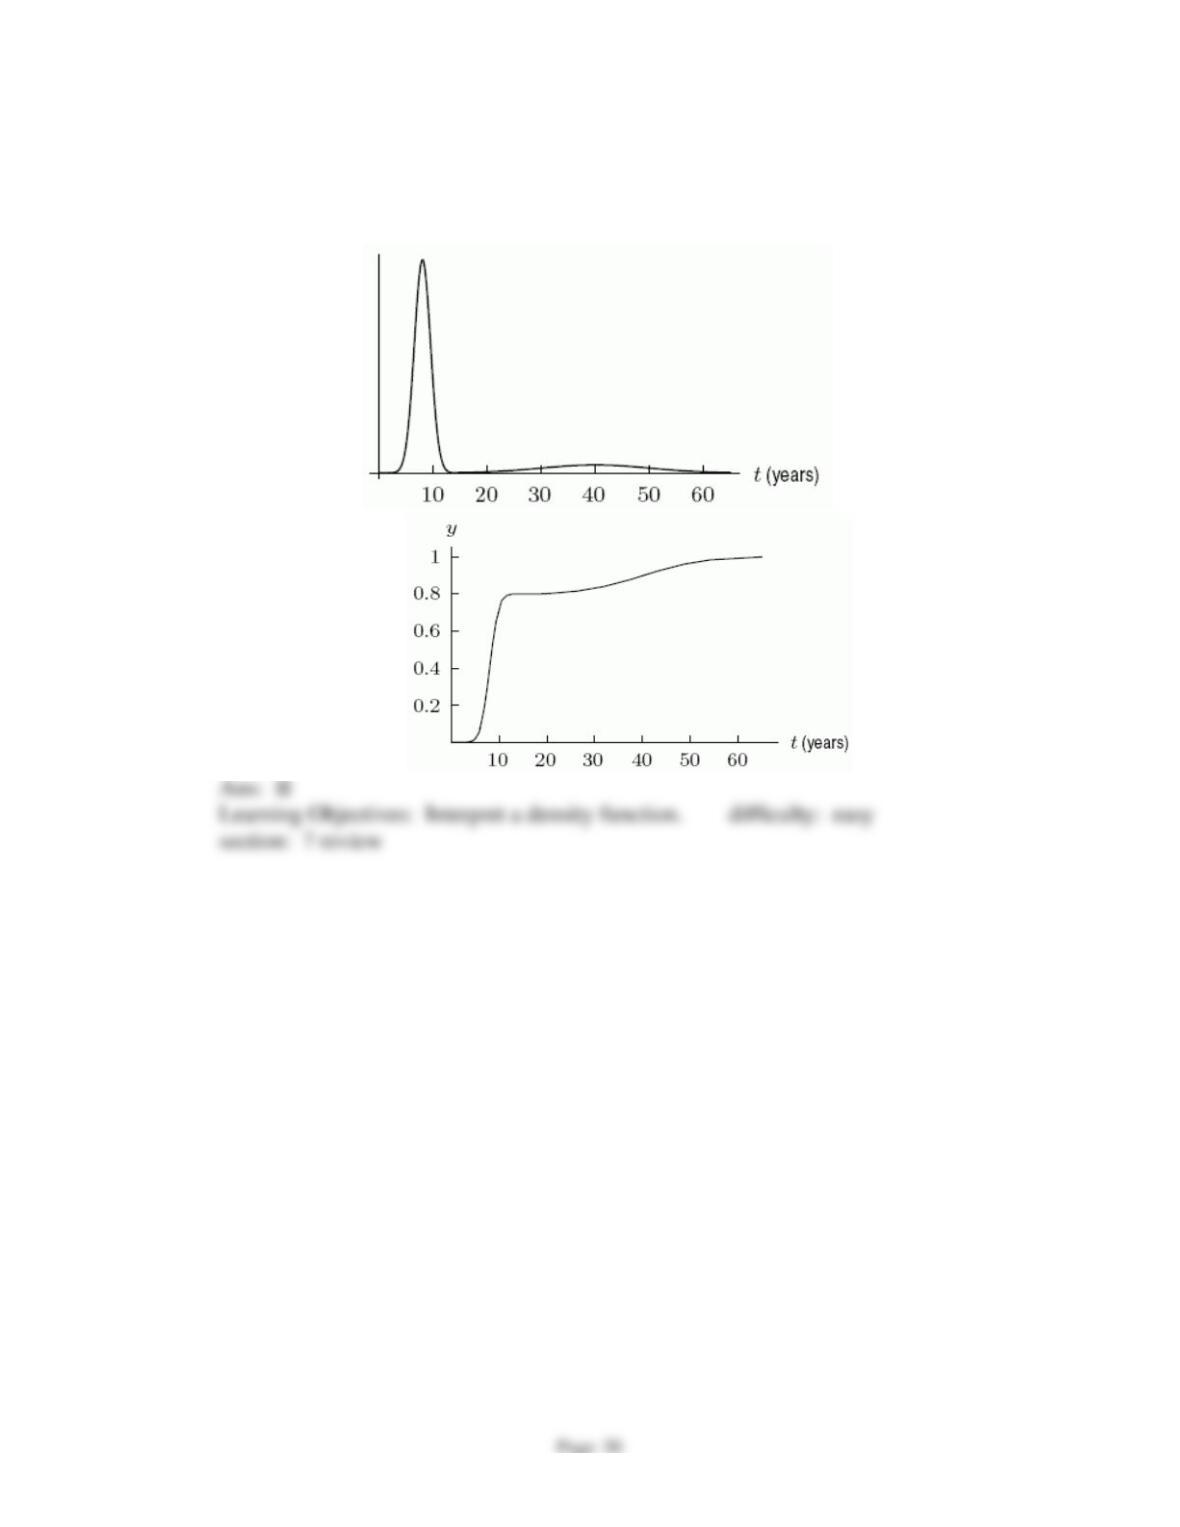
63.
The density function and the cumulative distribution function for the ages of people in
an elementary school are graphed below. Which figure is the cumulative distribution
function?
I. II.
Chapter 7
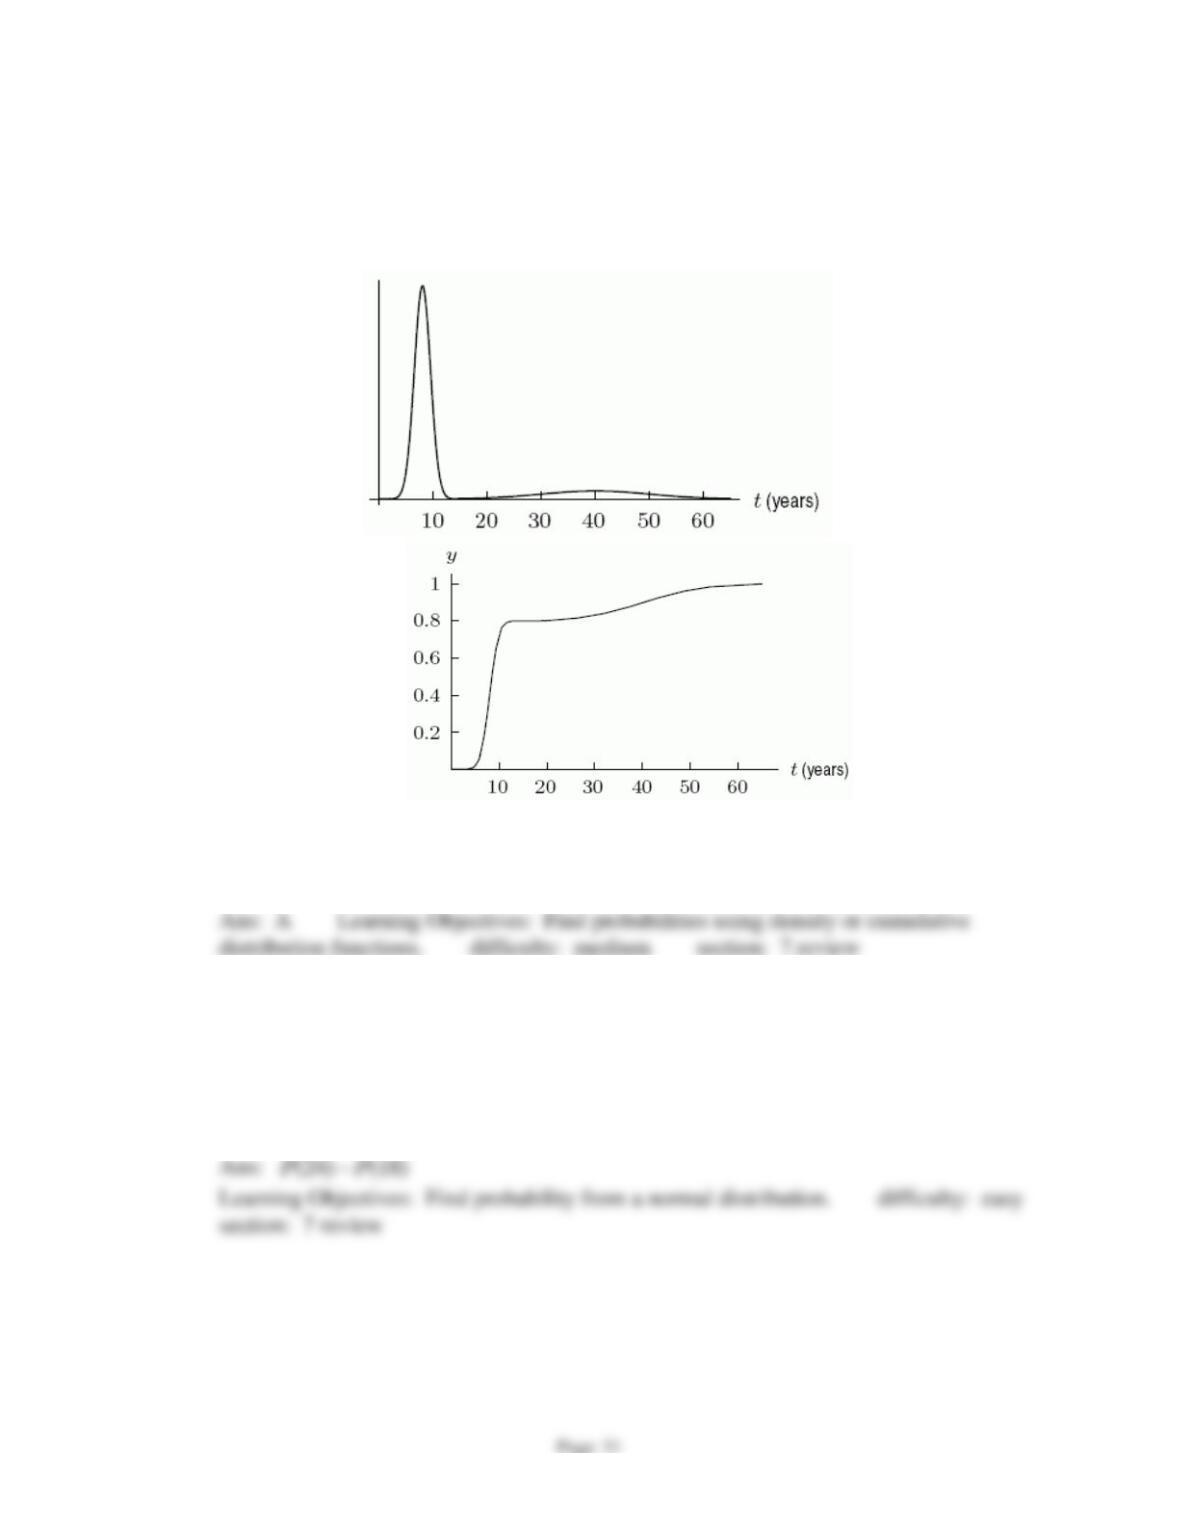
64.
The density function and the cumulative distribution function for the ages of people in
an elementary school are graphed below. About what percent of the people in the school
are adults?
I. II.
A)
20%
B)
40%
C)
60%
D)
80%
distribution functions. difficulty: medium section: 7 review
65.
The race times for a group of cross-country runners are all between 15 and 25 minutes.
They are represented by the density function
()pt
and the corresponding cumulative
distribution function
()Pt
, where t is time in minutes. Express
24
18 ()p x dx
in terms
of
()Pt
.
section: 7 review
Chapter 7
Page 32
66.
Let
0.2
( ) 0.2 t
p t e−
=
be the density function for call-back time by an answering service
with t = time in minutes and
0 30t
. Find the mean, in minutes, to 2 decimal
places.
67.
The number of hours of sleep per night averaged by a group of students is
approximately normally distributed with mean
7
=
and standard deviation
1.2
=
.
What is the probability that a student selected at random had more than 7.5 hours of
sleep? Round to 2 decimal places.
Ans:
0.34
Learning Objectives: Find probability from a normal distribution. difficulty: easy
section: 7 review
68.
Which of the following distributions best describe the density function for annual
popcorn sales by a Cub Scout pack if the sales are approximately normally distributed
and they almost always make between $300 and $500?
A)
22
( 400) / 2(50)
1
() 50 2π
x
p x e−−
=
B)
22
( 400) / 2(150)
1
() 150 2π
x
p x e−−
=
C)
22
( 300) / 2(50)
1
() 50 2π
x
p x e−−
=
D)
22
( 300) / 2(100)
1
() 100 2π
x
p x e−−
=
Ans: A Learning Objectives: Find probability from a normal distribution.;
Interpret a density function. difficulty: hard section: 7 review
69.
The speed of cars on a freeway are approximately normally distributed with mean
78
=
mph and standard deviation
5
=
mph. Assume a maximum speed of 100
mph. If speeding tickets are given to cars traveling faster than 82 mph, what is the
probability that a randomly selected car is going fast enough to get a ticket? Round to
2 decimal places.
Ans:
0.21
Learning Objectives: Find probability from a normal distribution.
difficulty: medium section: 7 review
Ans:
4.91
Learning Objectives: Find probability from a normal distribution.
difficulty: medium section: 7 review
Chapter 7
Page 33
70.
The speed of cars on a freeway are approximately normally distributed with mean
78
=
mph and standard deviation
5
=
mph. Assume a maximum speed of 100
mph. What percent of cars are going between 65 and 70 mph? Round to the nearest
percent.
Ans:
5%
Learning Objectives: Find probability from a normal distribution.
difficulty: medium section: 7 review