Page 1
1.
Which of the following functions would appear as a straight line on a log-log plot?
A)
48+12yx=
B)
2
10yx=
C)
33 1.2x
y=
2.
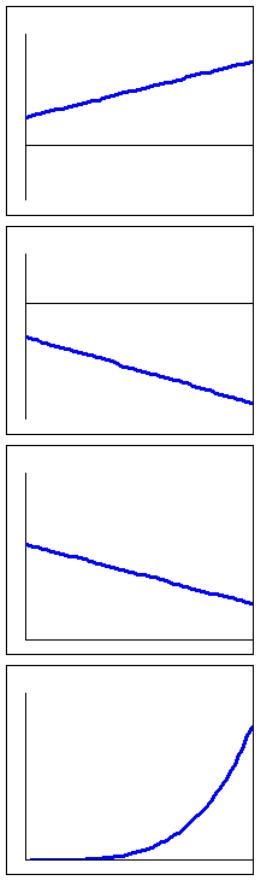
Which of the following is a log-log plot of the function
7
12yx=
A)
B)
C)
D)
3.
Convert the equation to its power function equivalent form,
p
y kx=
.
log( ) log(9) 7log( )yx=+
Page 2
4.
The graph of a power function,
p
y kx=
, on a log-log plot is a line that passes through
the points (–5,49) and (10,–76).
Find the A) m and B) b in the equation of the line, in
Y b mX=+
form, where
log( )Xx=
and
log( )Yy=
.
Then find C) k and D) p in the power function
p
y kx=
.
Round answers to two decimal places, if necessary.
5.
The graph of a power function,
p
y kx=
, on a log-log plot is a line that passes through
the points (–1,10) and (5,–25).
Find the power function
p
y kx=
.
Round values to two decimal places, if necessary.
6.
Convert the power function to its equivalent form,
log( ) log( ) log( )y k p x=+
.
5
4yx=
7.
On a log-log plot, the equation
3
5yx=
would have a slope of:
8.
On a log-log plot, the equation
2
69yx=
would have a y-intercept of:
Round the answer to 2 decimal places if necessary.
Page 3
9.
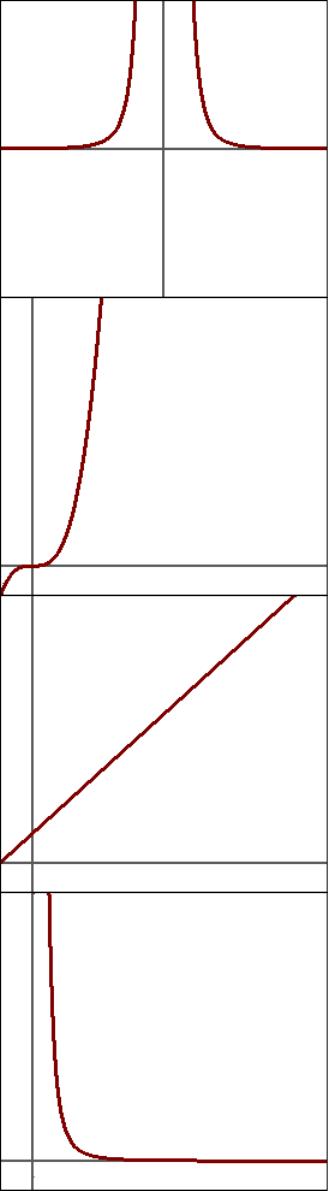
On a log-log plot, the graph of the equation
3
52yx=
would be
A)
B)
C)
D)
Page 4
10.
The log-log plot of an equation of the form
p
y kx=
goes through the points (2, 8) and
(6, 16). Find the power function for this graph.
11.
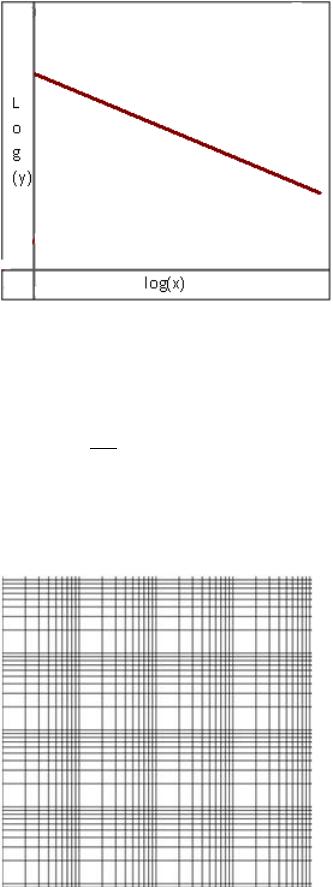
Which equation could be represented by this graph?
A)
5–3yx=
B)
–3
5yx=
C)
( )
–5 3x
y=
D)
3
–5
yx
=
12.
On the log-log plot, plot the equation
2
10yx=
.
Page 5
Answer Key