Fundamentals of Corporate Finance 3e Test Bank
73.
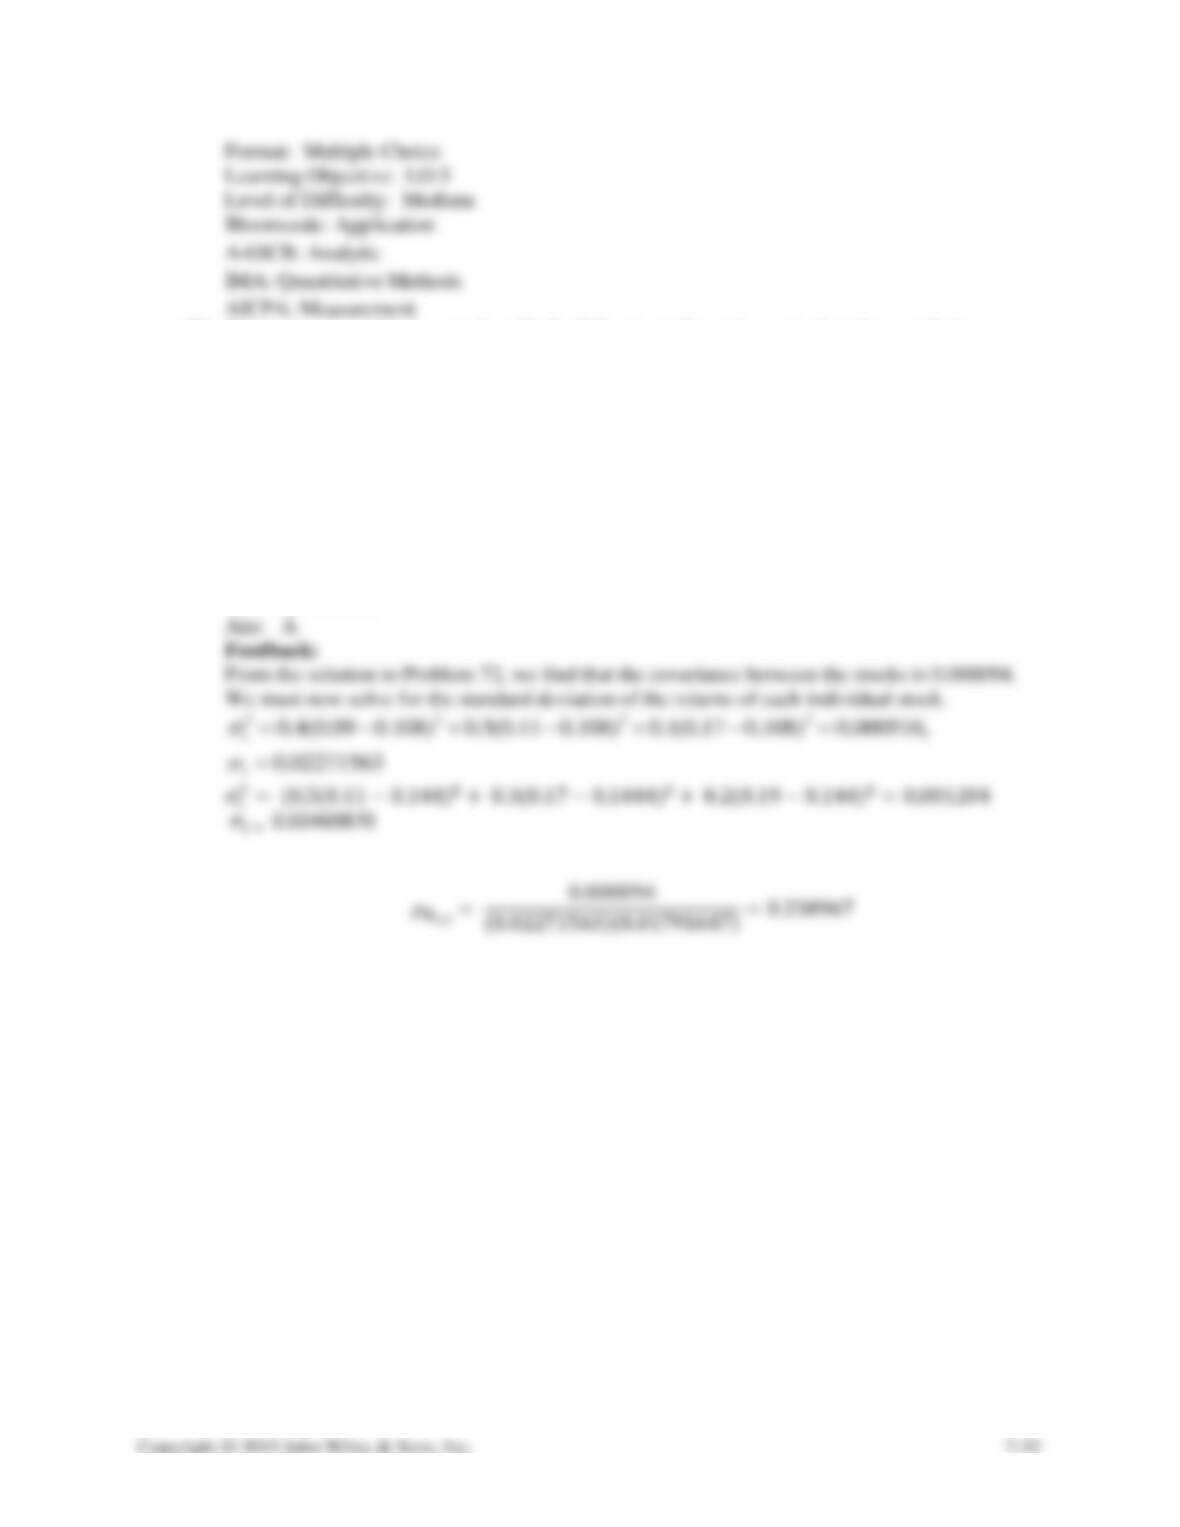
Given the returns for two stocks with the following information, calculate the correlation
coefficient of the returns for the two stocks. Assume the expected return for Stock 1 is 10.8
percent and 9.7 percent for Stock 2. Do not round intermediate computations.
Prob
Stock 1
Stock 2
0.4
0.09
0.11
0.5
0.11
0.08
0.1
0.17
0.13
A)
0.230967
B)
–0.00002548
C)
0.00032100
D)
0.17671455
Ans:
A
Fundamentals of Corporate Finance 3e Test Bank
74.
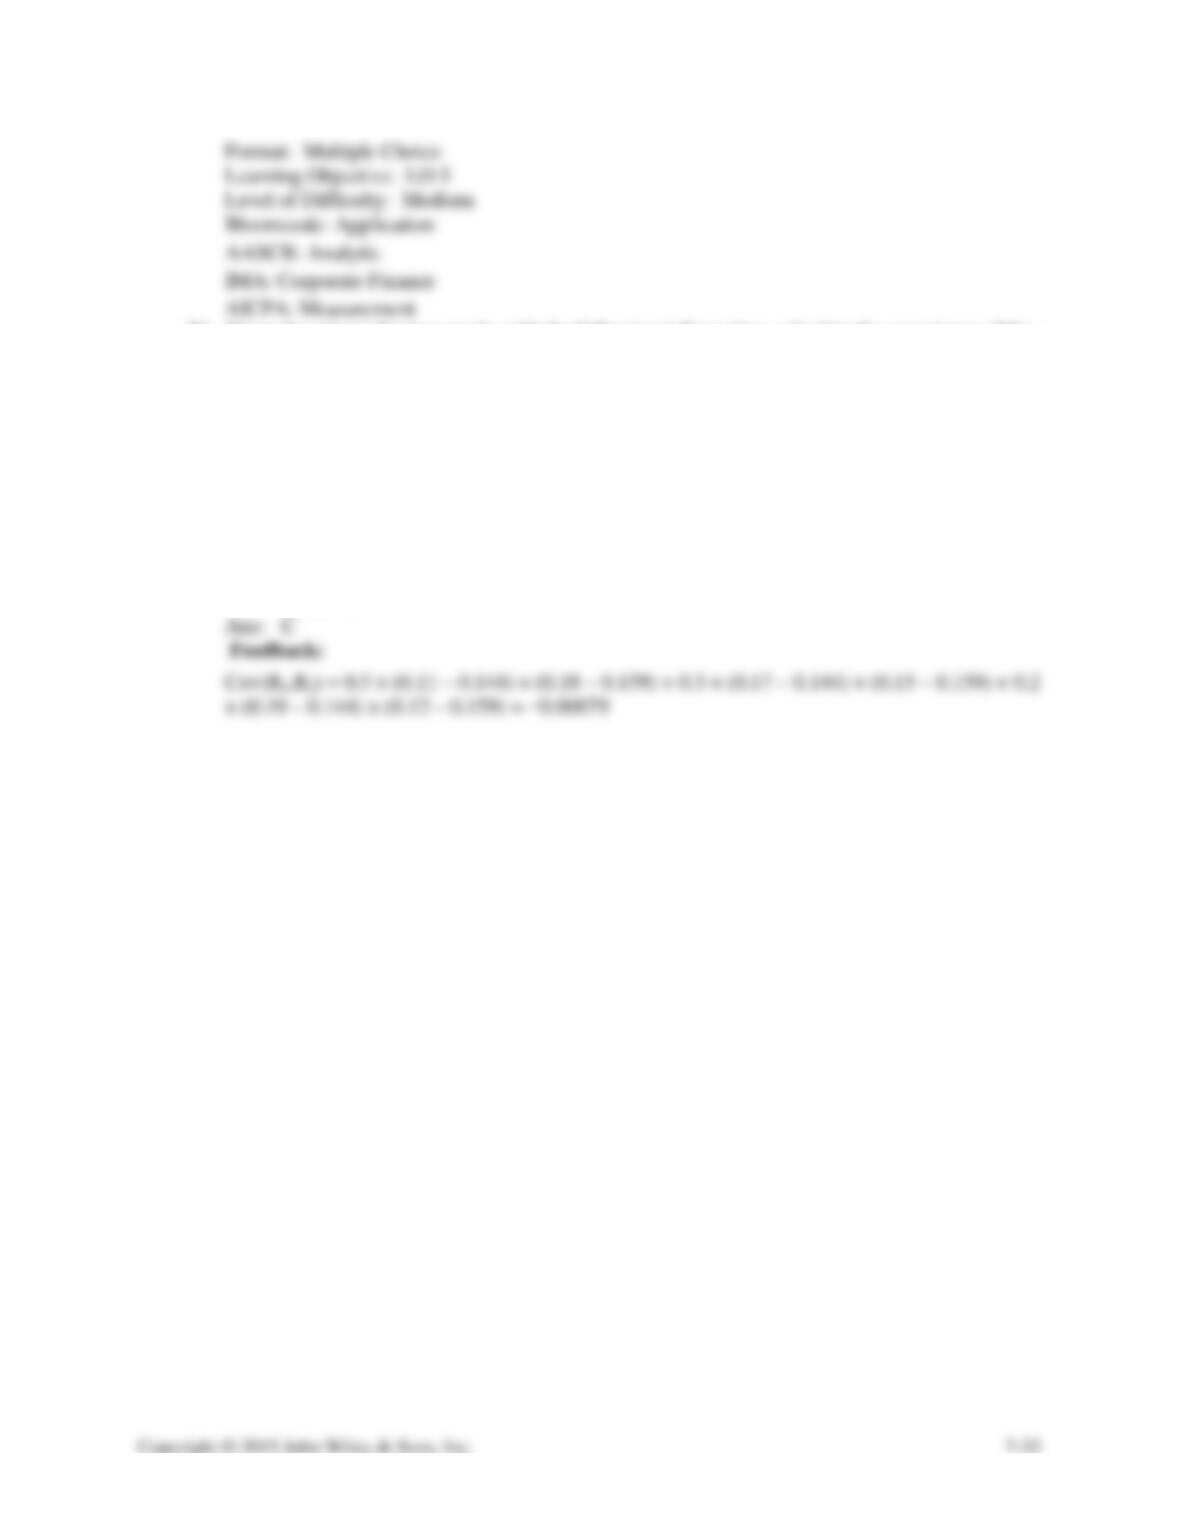
Given the returns for two stocks with the following information, calculate the covariance of the
returns for the two stocks. Assume the expected return is 14.4 percent for Stock 1 and 15.9
percent for Stock 2. Round your final answer to five decimal places.
Prob
Stock 1
Stock 2
0.5
0.11
0.18
0.3
0.17
0.15
0.2
0.19
0.12
A)
0.00120
B)
0.00054
C)
−0.00079
D)
–0.33720
Fundamentals of Corporate Finance 3e Test Bank
75.
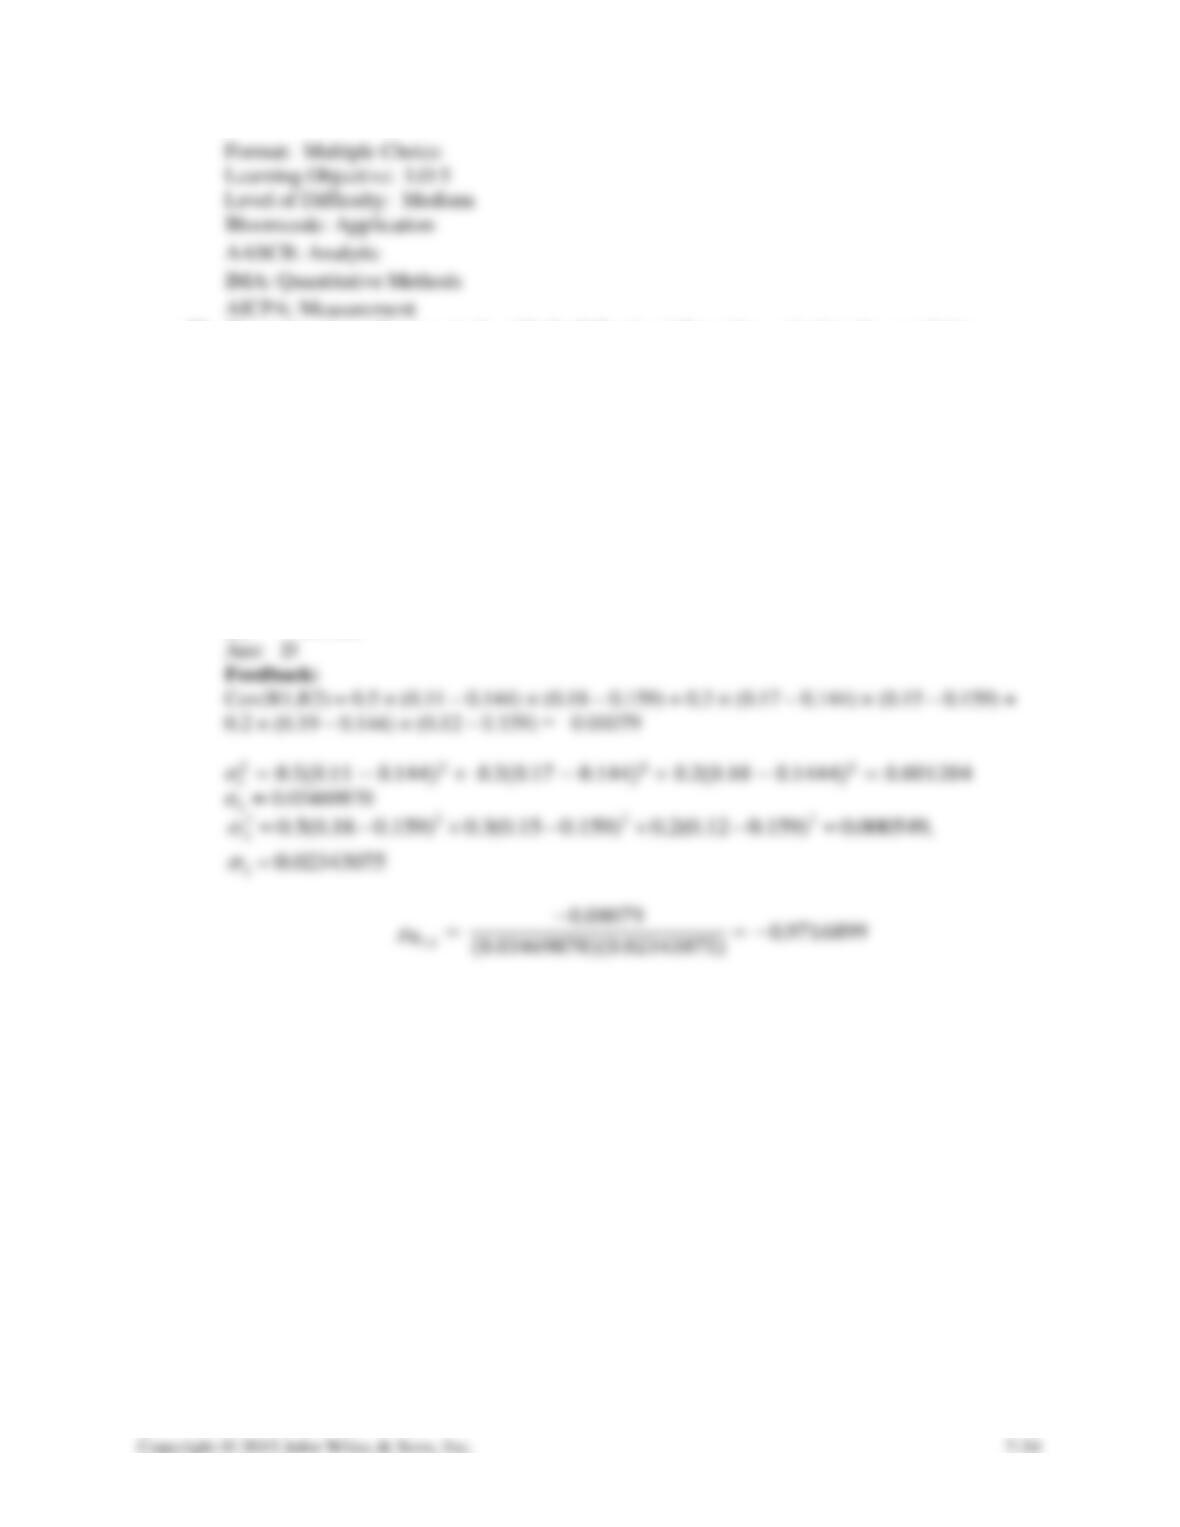
Given the returns for two stocks with the following information, calculate the correlation
coefficient of the returns for the two stocks. Assume the expected return is 14.4 percent for
Stock 1 and 15.9 percent for Stock 2. Do not round intermediate computations.
Prob
Stock 1
Stock 2
0.5
0.11
0.18
0.3
0.17
0.15
0.2
0.19
0.12
A)
0.00120
B)
0.00054
C)
–0.00271
D)
-0.97169
Ans:
D
Fundamentals of Corporate Finance 3e Test Bank
76.
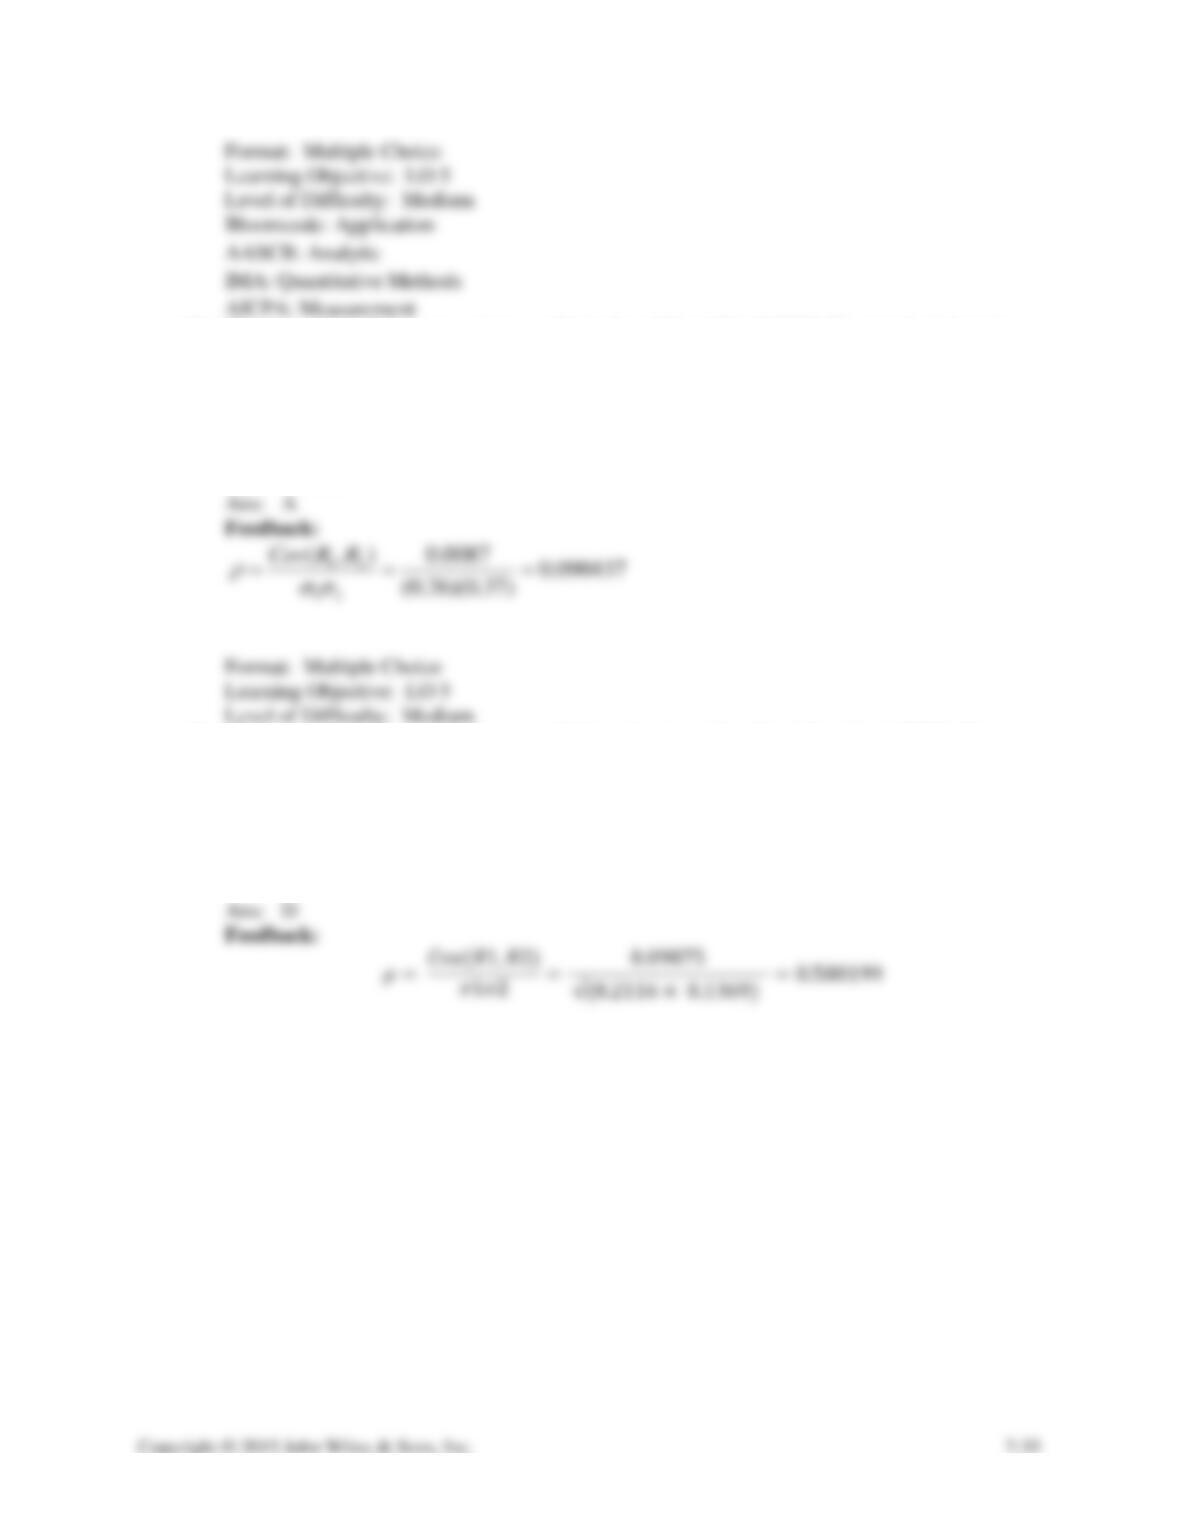
The covariance of the returns between Stock A and Stock B is 0.0087. The standard deviation
of Stock A is 0.26, and the standard deviation of Stock B is 0.37. What is the correlation
coefficient between the returns of the two stocks?
A)
0.090437
B)
0.096200
C)
0.90437
D)
0.96200
Ans:
A
Format: Multiple Choice
77.
The covariance of the returns between Wildcat Stock and Sun Devil Stock is 0.09875. The
variance of Wildcat is 0.2116, and the variance of Sun Devil is 0.1369. What is the correlation
coefficient between the returns of the two stocks?
A)
0.170200
B)
0.293347
C)
0.340823
D)
0.580199
Ans:
D
Fundamentals of Corporate Finance 3e Test Bank
78.
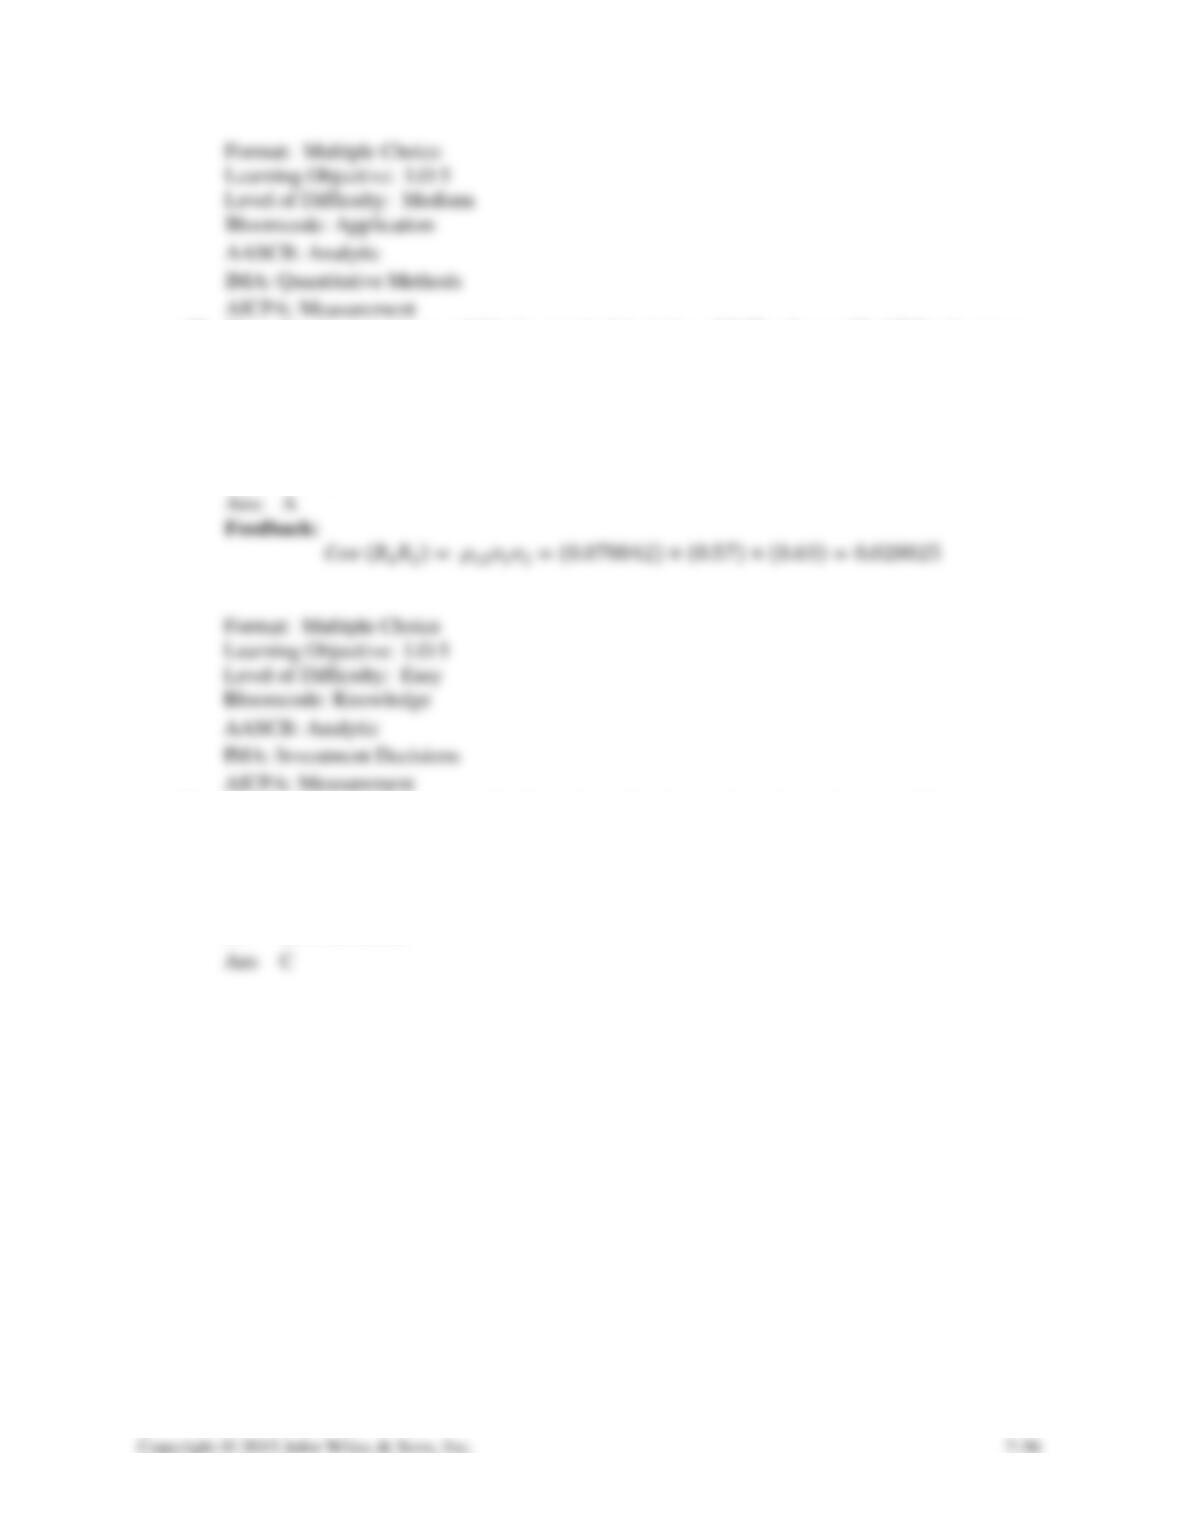
Horse Stock returns have exhibited a standard deviation of 0.57, whereas Mod T Stock returns
have a standard deviation of 0.63. The correlation coefficient between the returns is 0.078042.
What is the covariance of the returns? Round your answer to six decimal places.
A)
0.028025
B)
0.217327
C)
0.359100
D)
0.993094
Ans:
A
79.
Most of the risk-reduction benefits from diversification can be achieved in a portfolio
consisting of
A)
5 to 10 assets.
B)
10 to 15 assets.
C)
15 to 20 assets.
D)
20 to 25 assets.
Ans
C

Fundamentals of Corporate Finance 3e Test Bank
80.
Which of the following investors should be willing to pay the highest price for an asset?
A)
An investor with a single-asset portfolio.
B)
An investor with a diversified portfolio.
C)
An investor who is not completely diversified.
D)
An investor who is so risk-averse that he does not recognize the benefits of
diversification.
Ans:
B
81.
Which of the following is the best measure of the systematic risk in a portfolio?
A)
Variance
B)
Standard deviation
C)
Covariance
D)
Beta
Ans:
D
82.
A portfolio with a level of systematic risk is the same as that of the market has a beta that is
A)
equal to zero.
B)
equal to one.
C)
less than the beta of the risk-free asset.
D)
less than zero.
Ans:
B
Fundamentals of Corporate Finance 3e Test Bank
83.
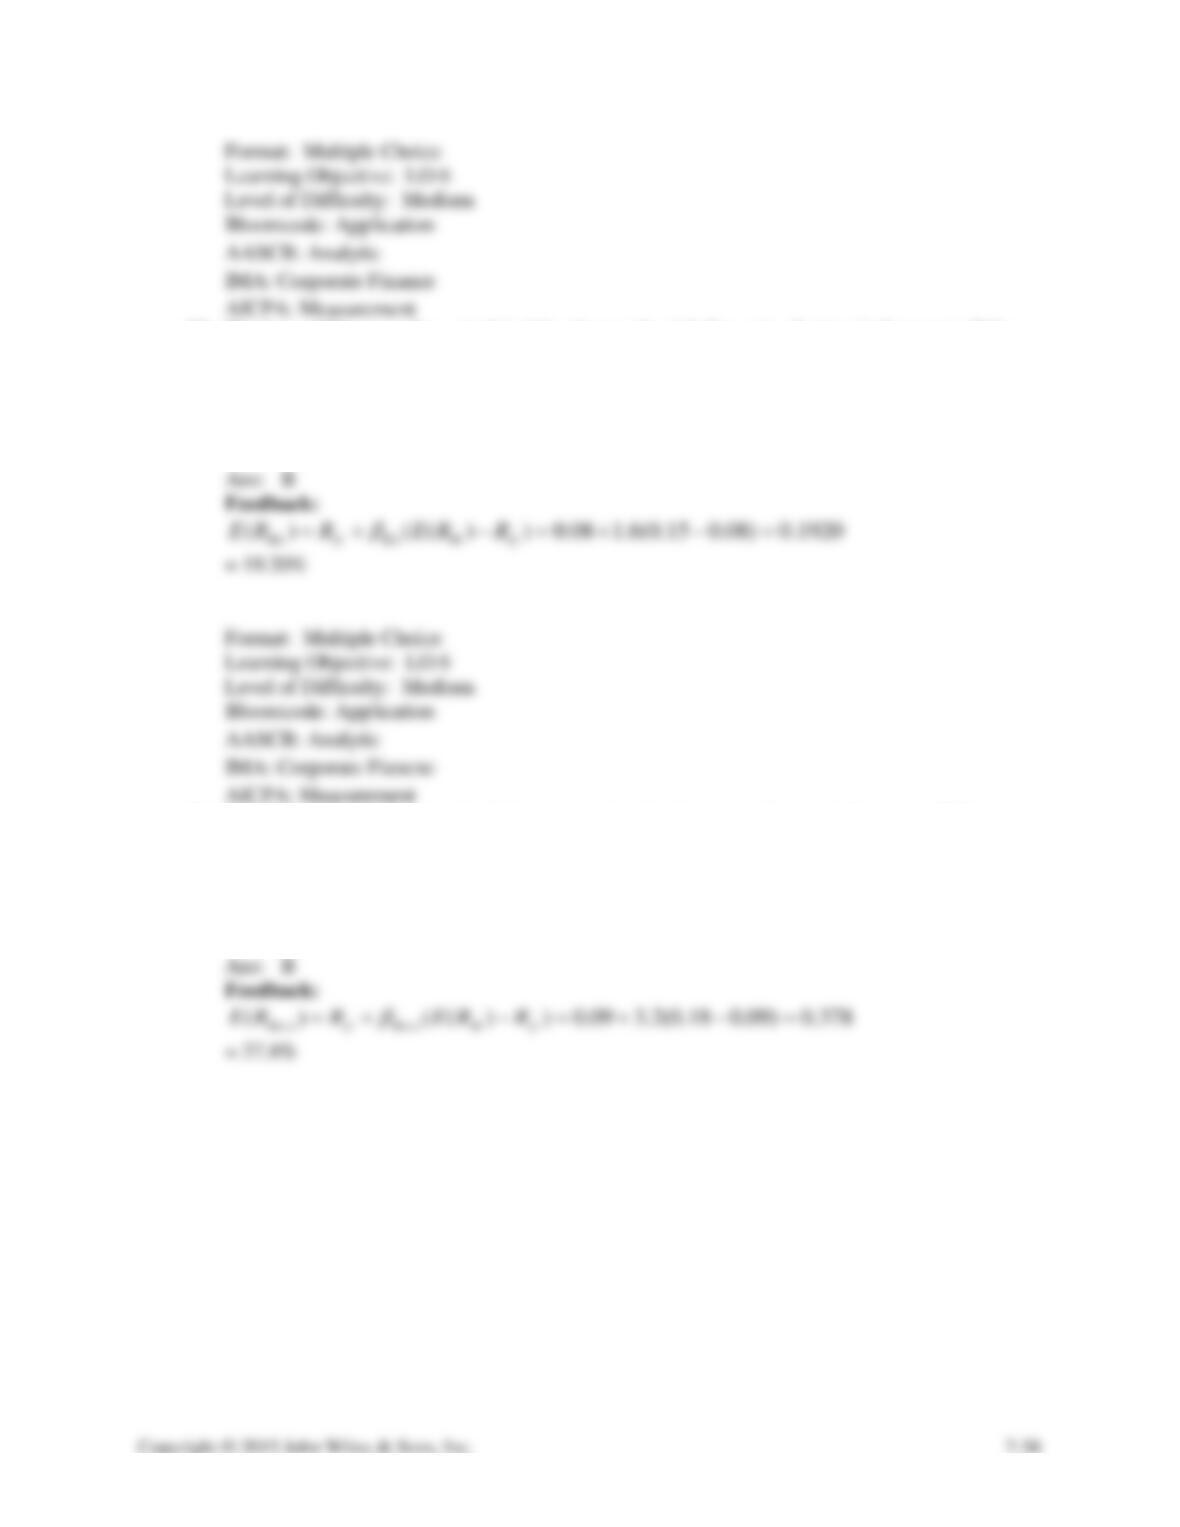
The beta of Elsenore, Inc., stock is 1.6, whereas the risk-free rate of return is 8 percent. If the
expected return on the market is 15 percent, then what is the expected return on Elsenore?
A)
11.20%
B)
19.20%
C)
24.00%
D)
32.00%
Ans:
B
= 19.20%
84.
The beta of Ricci Co.’s stock is 3.2, whereas the risk-free rate of return is 9 percent. If the
expected return on the market is 18 percent, then what is the expected return on Ricci Co.?
A)
28.80%
B)
37.80%
C)
48.60%
D)
57.60%
Ans:
B
= 37.8%
Fundamentals of Corporate Finance 3e Test Bank
85.
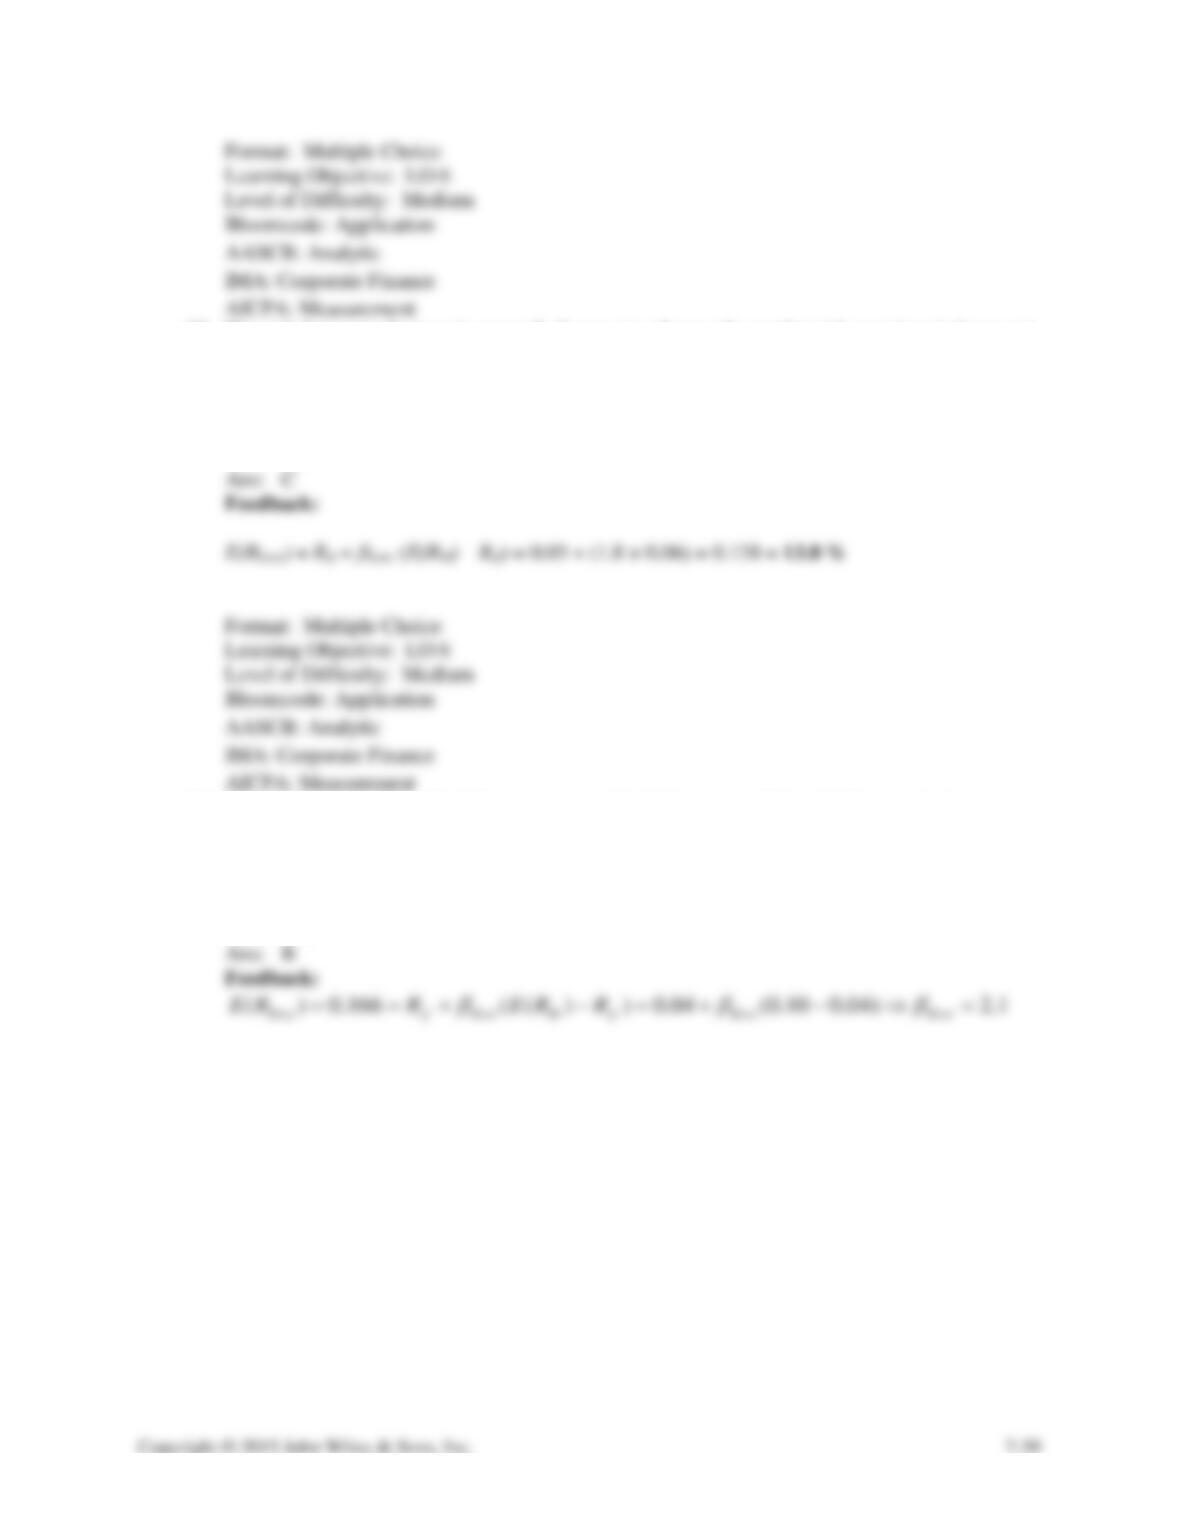
The risk-free rate of return is currently 3 percent, whereas the market risk premium is 6 percent.
If the beta of Lenz, Inc., stock is 1.8, then what is the expected return on Lenz?
A)
8.40%
B)
10.80%
C)
13.80%
D)
19.20%
Ans:
C
AICPA: Measurement
86.
The expected return on Kiwi Computers stock is 16.6 percent. If the risk-free rate is 4 percent
and the expected return on the market is 10 percent, then what is Kiwi’s beta?
A)
1.26
B)
2.10
C)
2.80
D)
3.15
Ans:
B
Fundamentals of Corporate Finance 3e Test Bank
87.
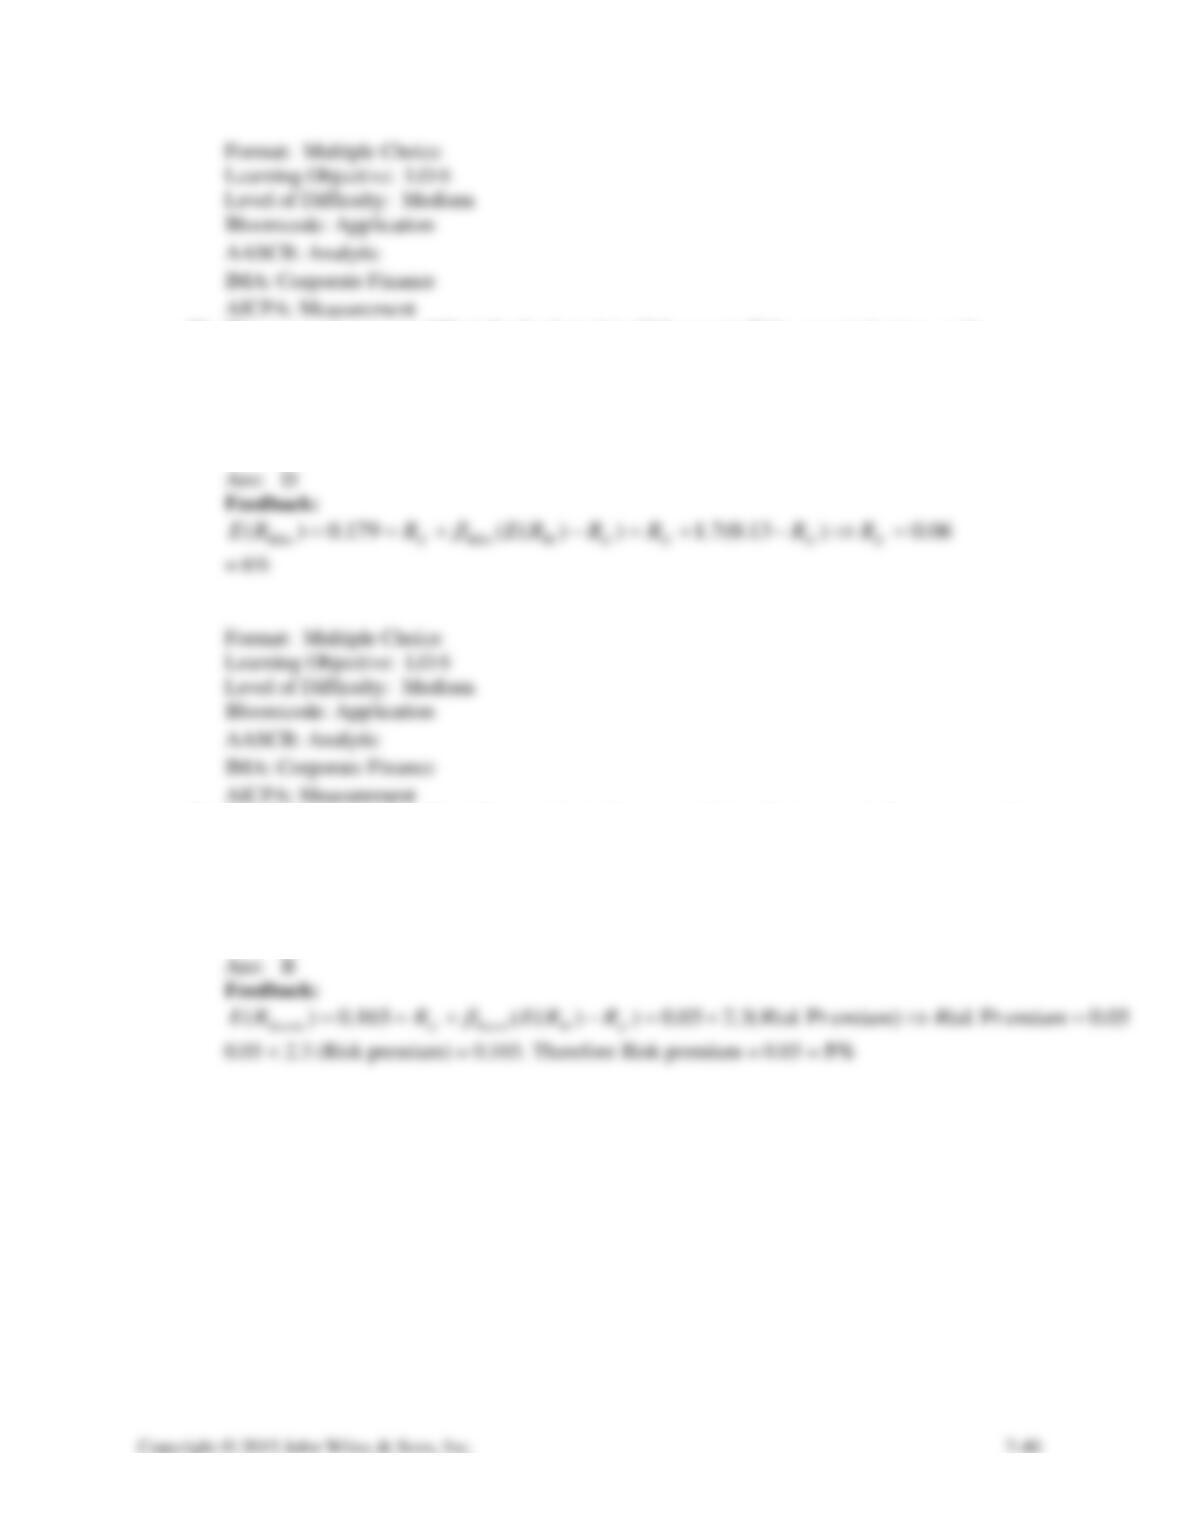
The expected return on Mike’s Seafood stock is 17.9 percent. If the expected return on the
market is 13 percent and the beta for Kiwi is 1.7, then what is the risk-free rate?
A)
4.5%
B)
5.0%
C)
5.5%
D)
6.0%
Ans:
D
= 6%
88.
The expected return on Karol Co. stock is 16.5 percent. If the risk-free rate is 5 percent and the
beta of Karol Co is 2.3, then what is the risk premium on the market?
A)
2.5%
B)
5.0%
C)
7.5%
D)
10.0%
Ans:
B
Fundamentals of Corporate Finance 3e Test Bank
89.
Which of the following represents a plot of the relation between expected return and systemic
risk?
A)
The beta coefficient
B)
The covariance of returns line
C)
The security market line
D)
The variance
Ans:
C
AICPA: Measurement
90.
Explain the difference between systematic risk and unsystematic risk.
AICPA: Measurement
91.
While performing the regression analysis of historical returns of a stock with a historical return
of a general market index, you would plot the line of best fit through those data points. The
slope of that line represents the beta of the stock in question. However, in most instances the
data points do not lie exactly on that line. Explain the reason.