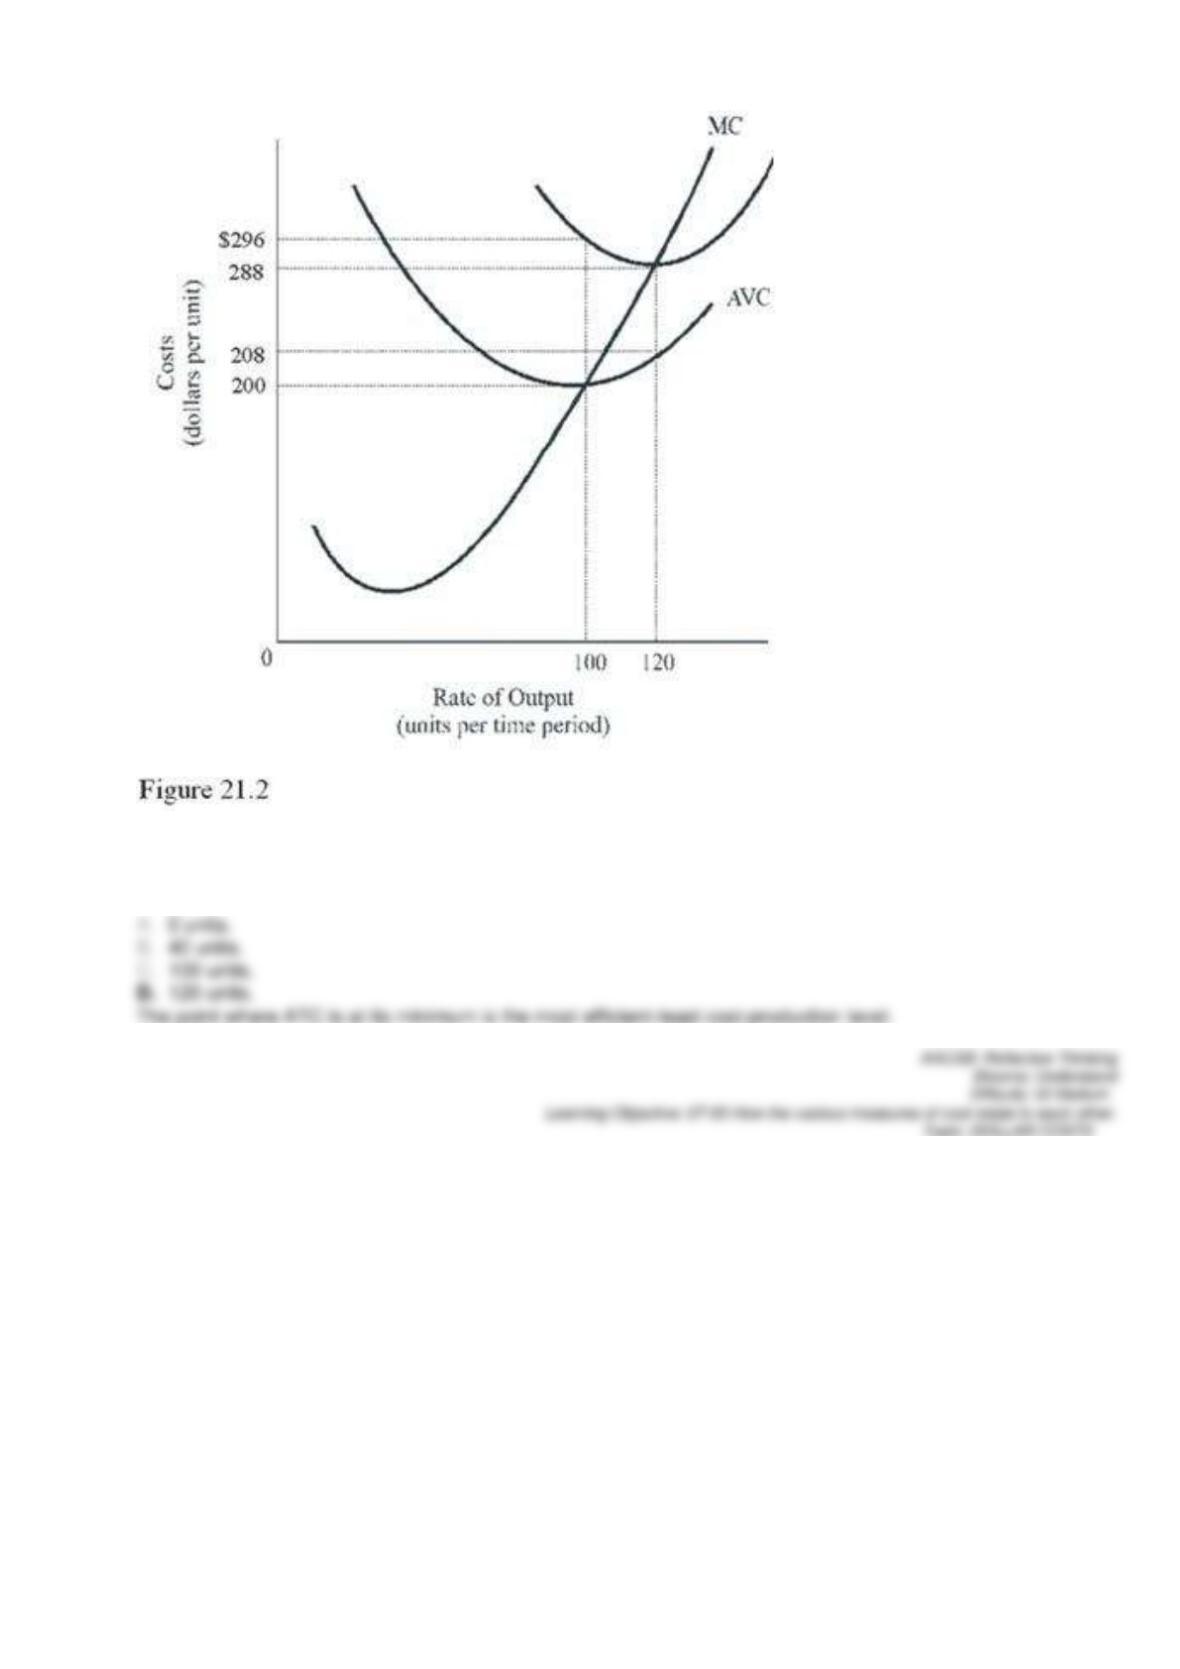
61.
In Figure 21.2, at what output does this firm maximize technical efficiency?
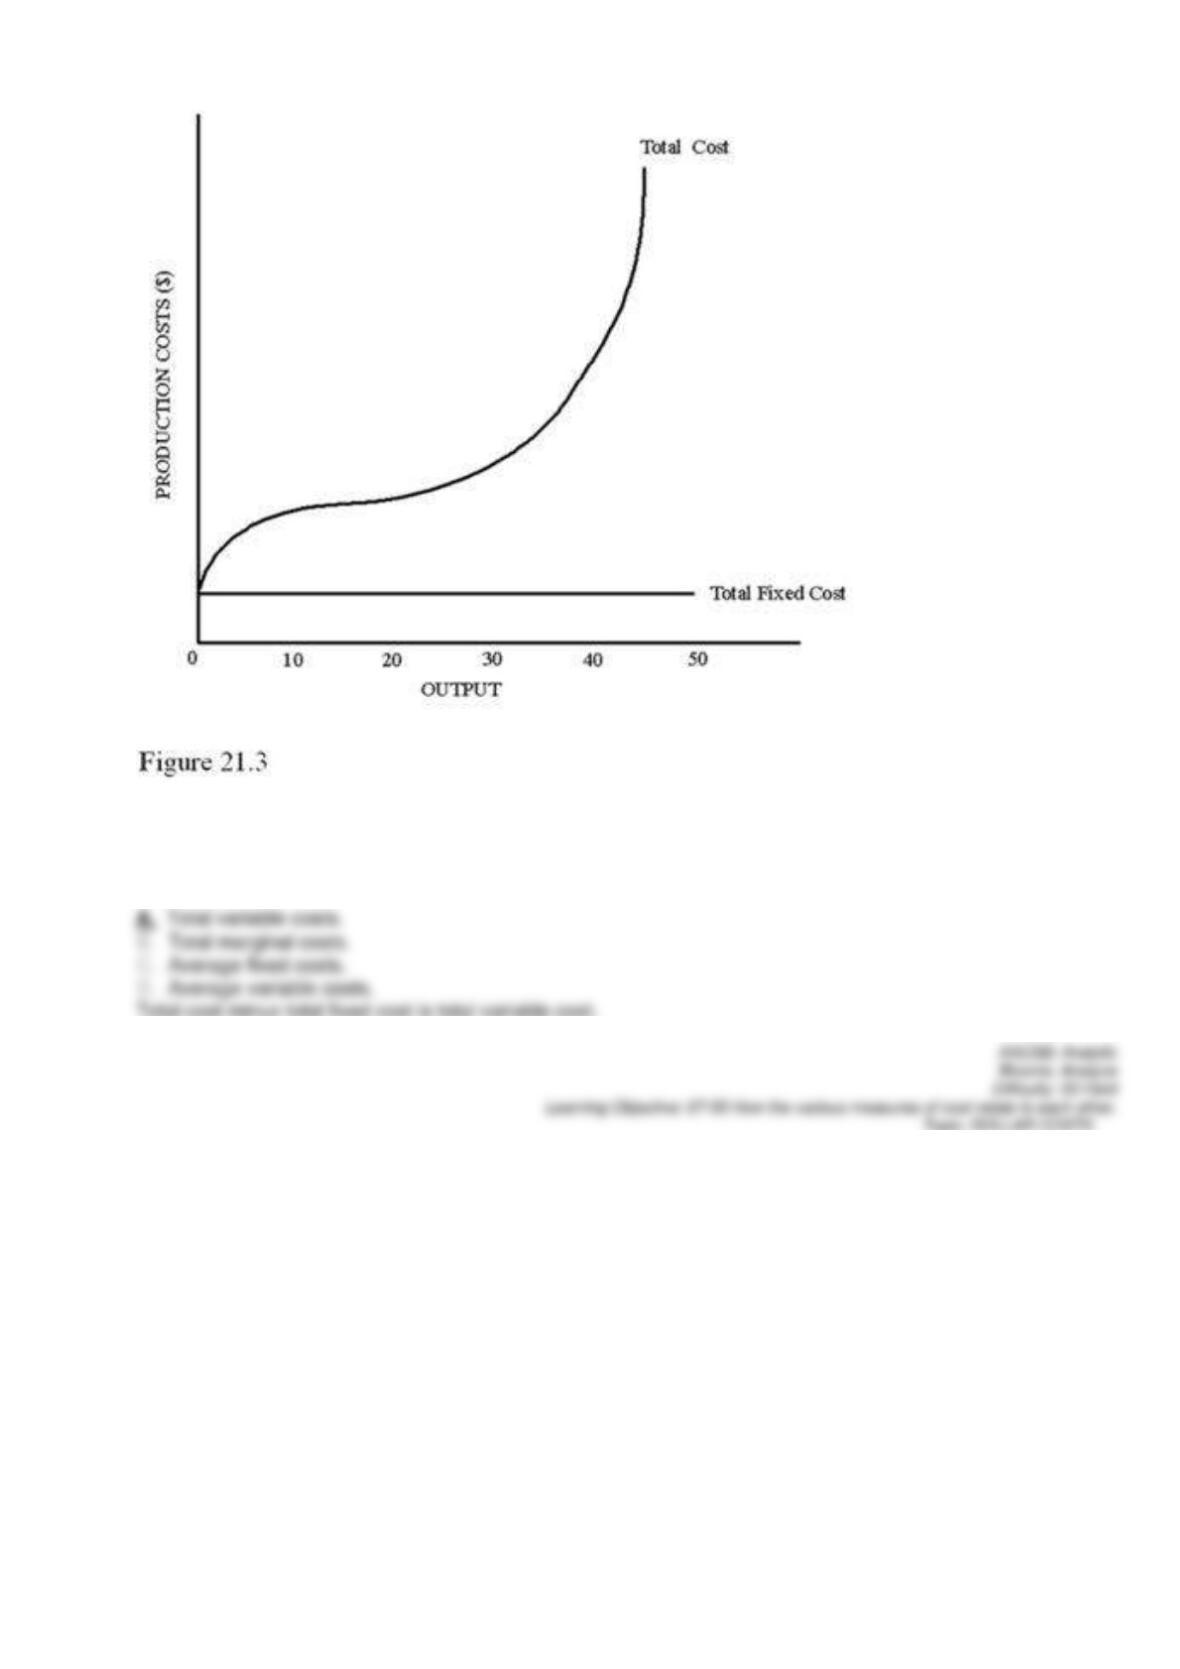
62.
Refer to Figure 21.3. The vertical difference between the total cost curve and the total fixed cost
curve represents
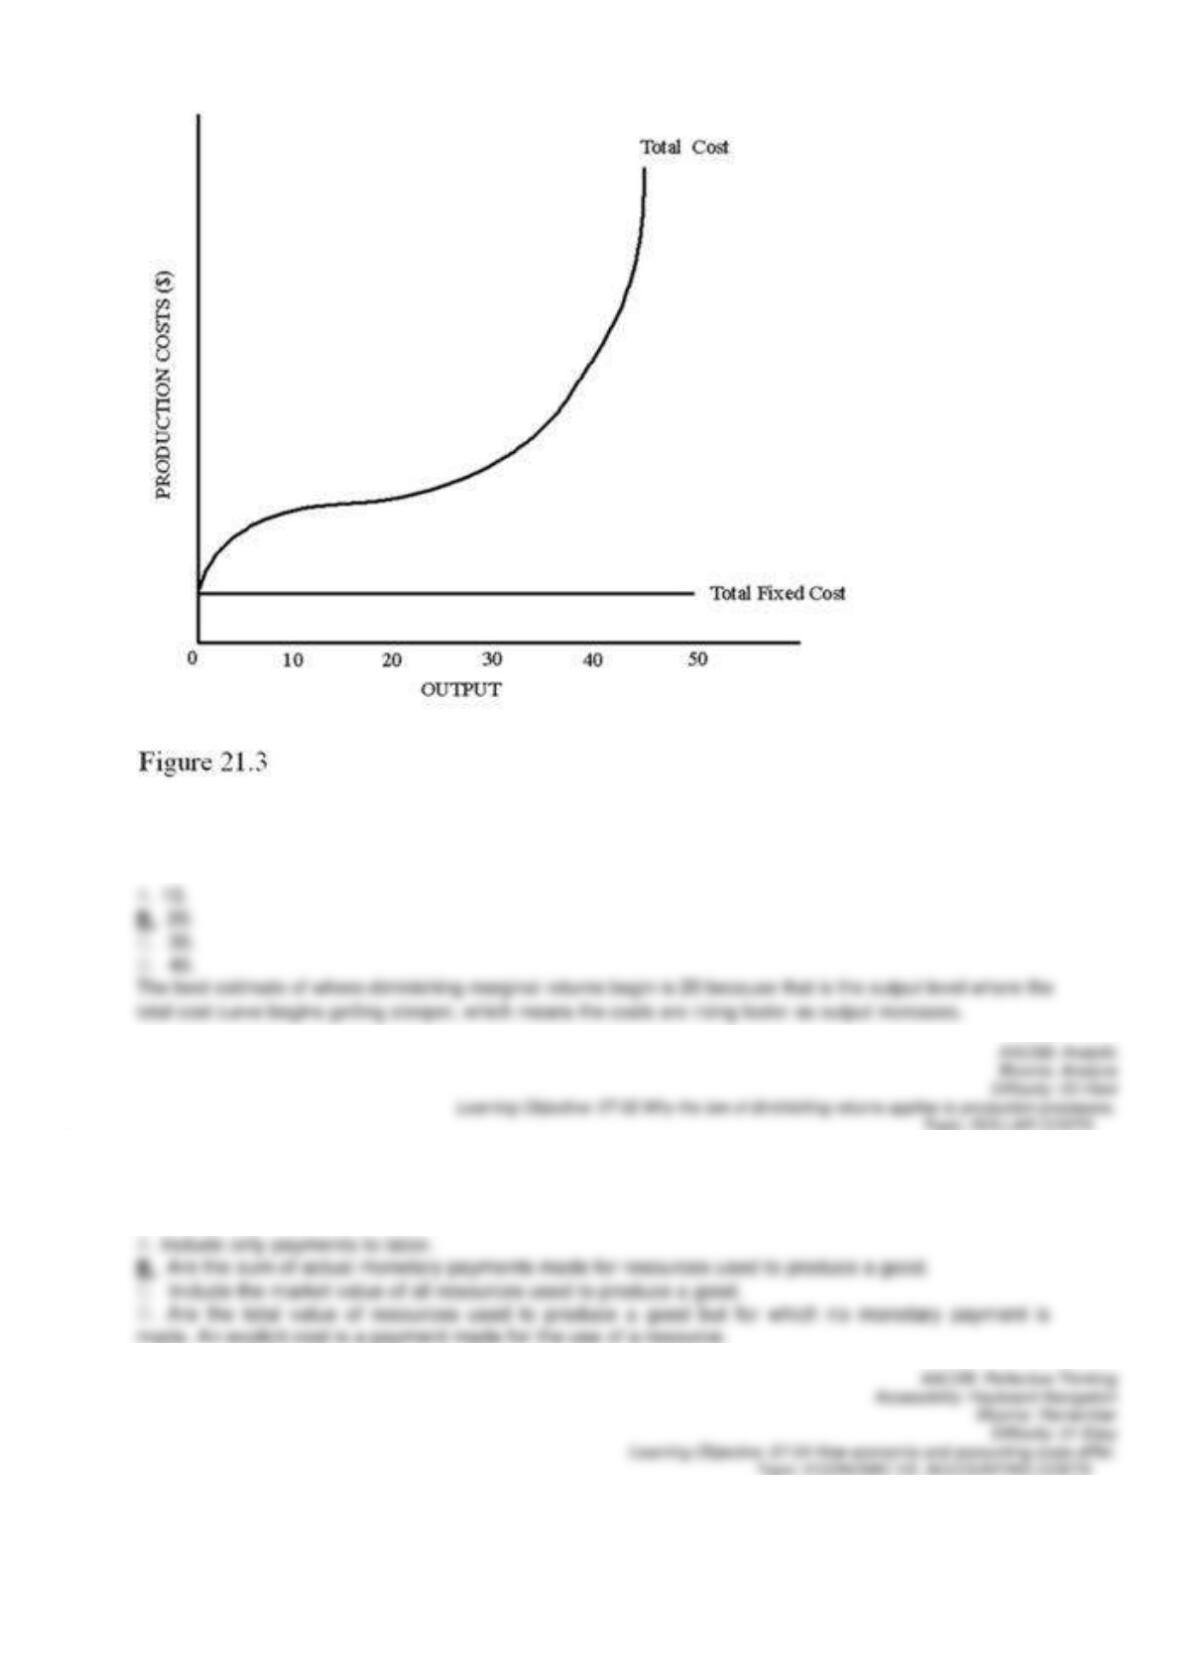
63.
Refer to Figure 21.3. The best estimate of where diminishing marginal returns begin is at an output level of
64.
Explicit costs
65. Implicit costs
A. Include only payments to labor.
66. Economic cost
67. Accounting costs and economic costs differ because
A. Economic costs include implicit costs and accounting costs do not.
68. Which of the following statements about the relationship between economic costs and accounting costs is true?
69. Megan used to work at the local pizzeria for $15,000 per year but quit in order to start her own deli. To buy the
necessary equipment, she withdrew $20,000 from her inheritance (which paid 8 percent interest). Last year
she paid $25,000 for ingredients and $500 per month rent but had revenue of $50,000. She asked her dad the
accountant and her mom the economist to calculate her costs for her.
70. In economics, the long run is considered to be
71. The period in which there are no fixed costs is
the A. Production run.
72. The long-run average total cost curve is constructed from the
73. Intel’s chief executive says the company might expand the technology it is using in its planned $2.5 billion chip–
manufacturing factory in China if the U.S. government allows it, underscoring the technology giant’s ambitions
in the world’s fourth-biggest economy. The Intel executive is making a
A. Long-run decision, and therefore an investment decision.
74. Economies of scale are reductions in average
75. Assume a given amount of output can be produced by several small plants or one large plant with identical
minimum per-unit costs. This long-run situation reflects the existence of
76. When the size of a factory (and all its associated inputs) doubles and, as a result, output more than
doubles,
77. Economies of scale
A. Exist in both the short run and the long run.
78. Diseconomies of scale are reflected in
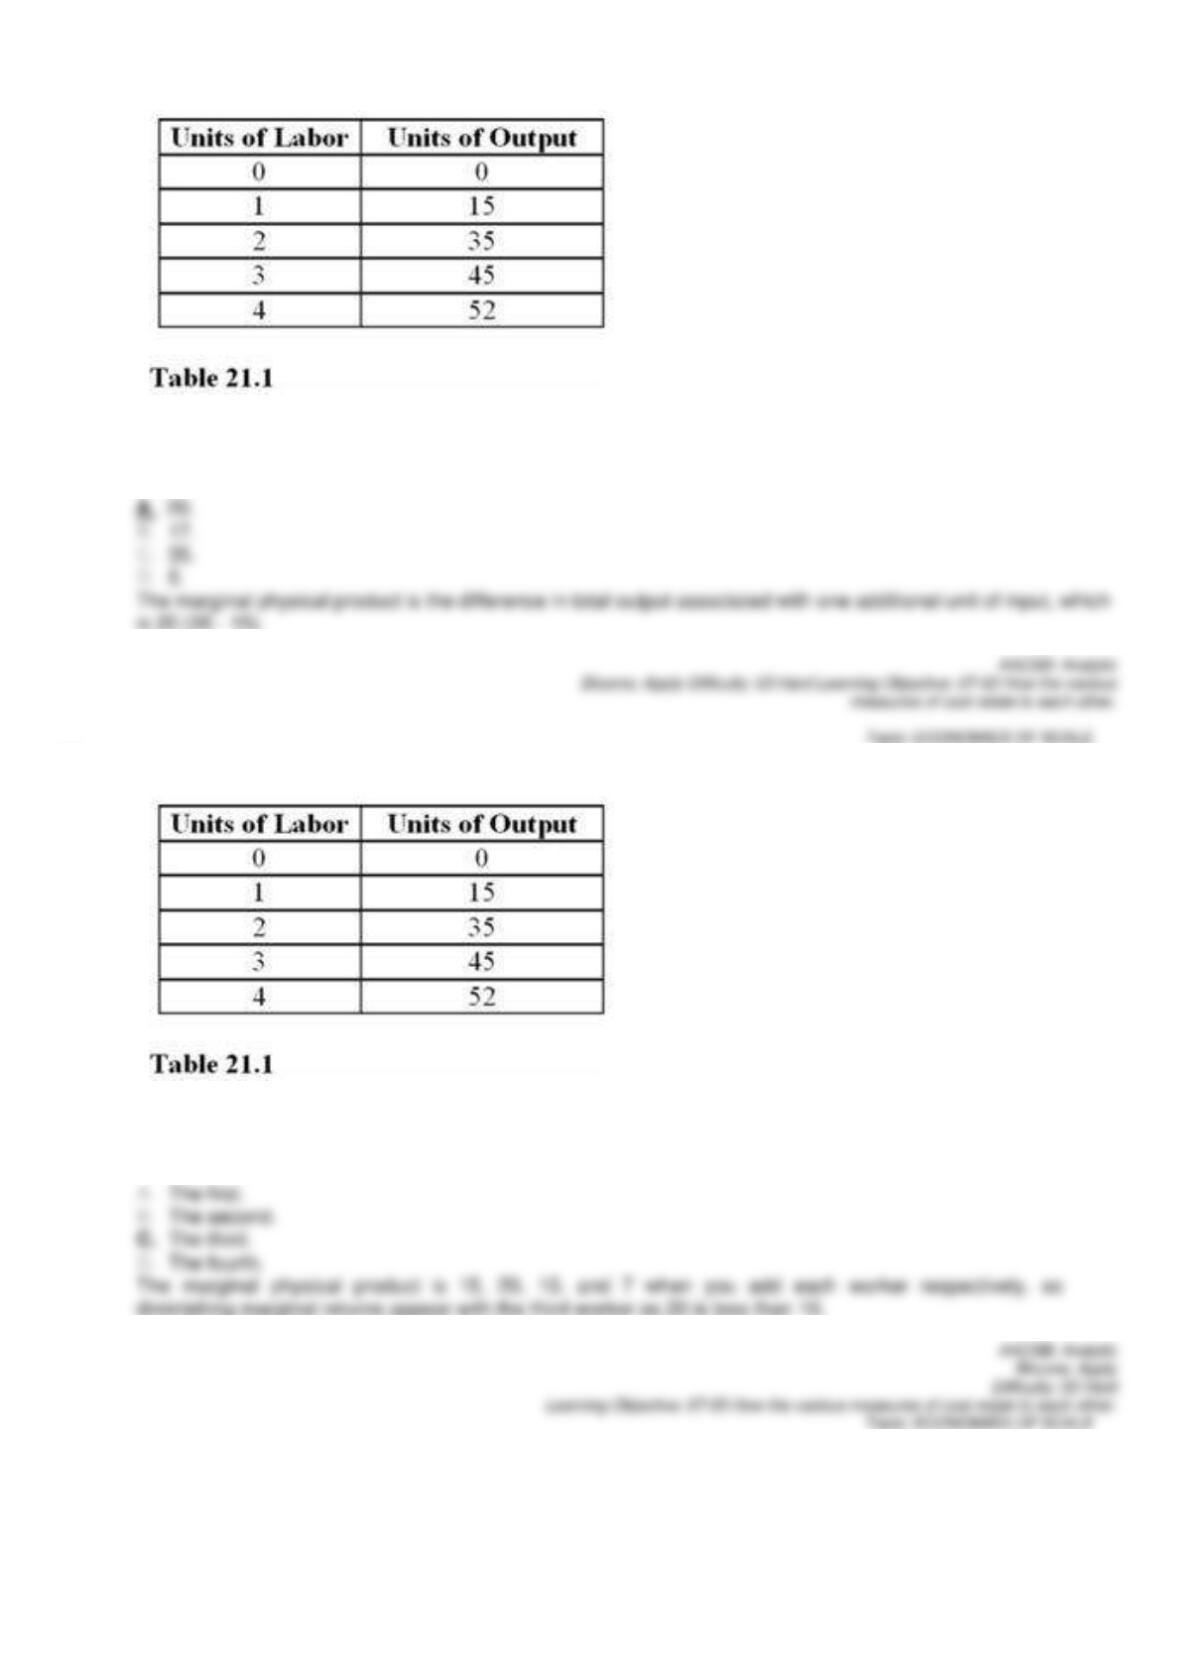
80.
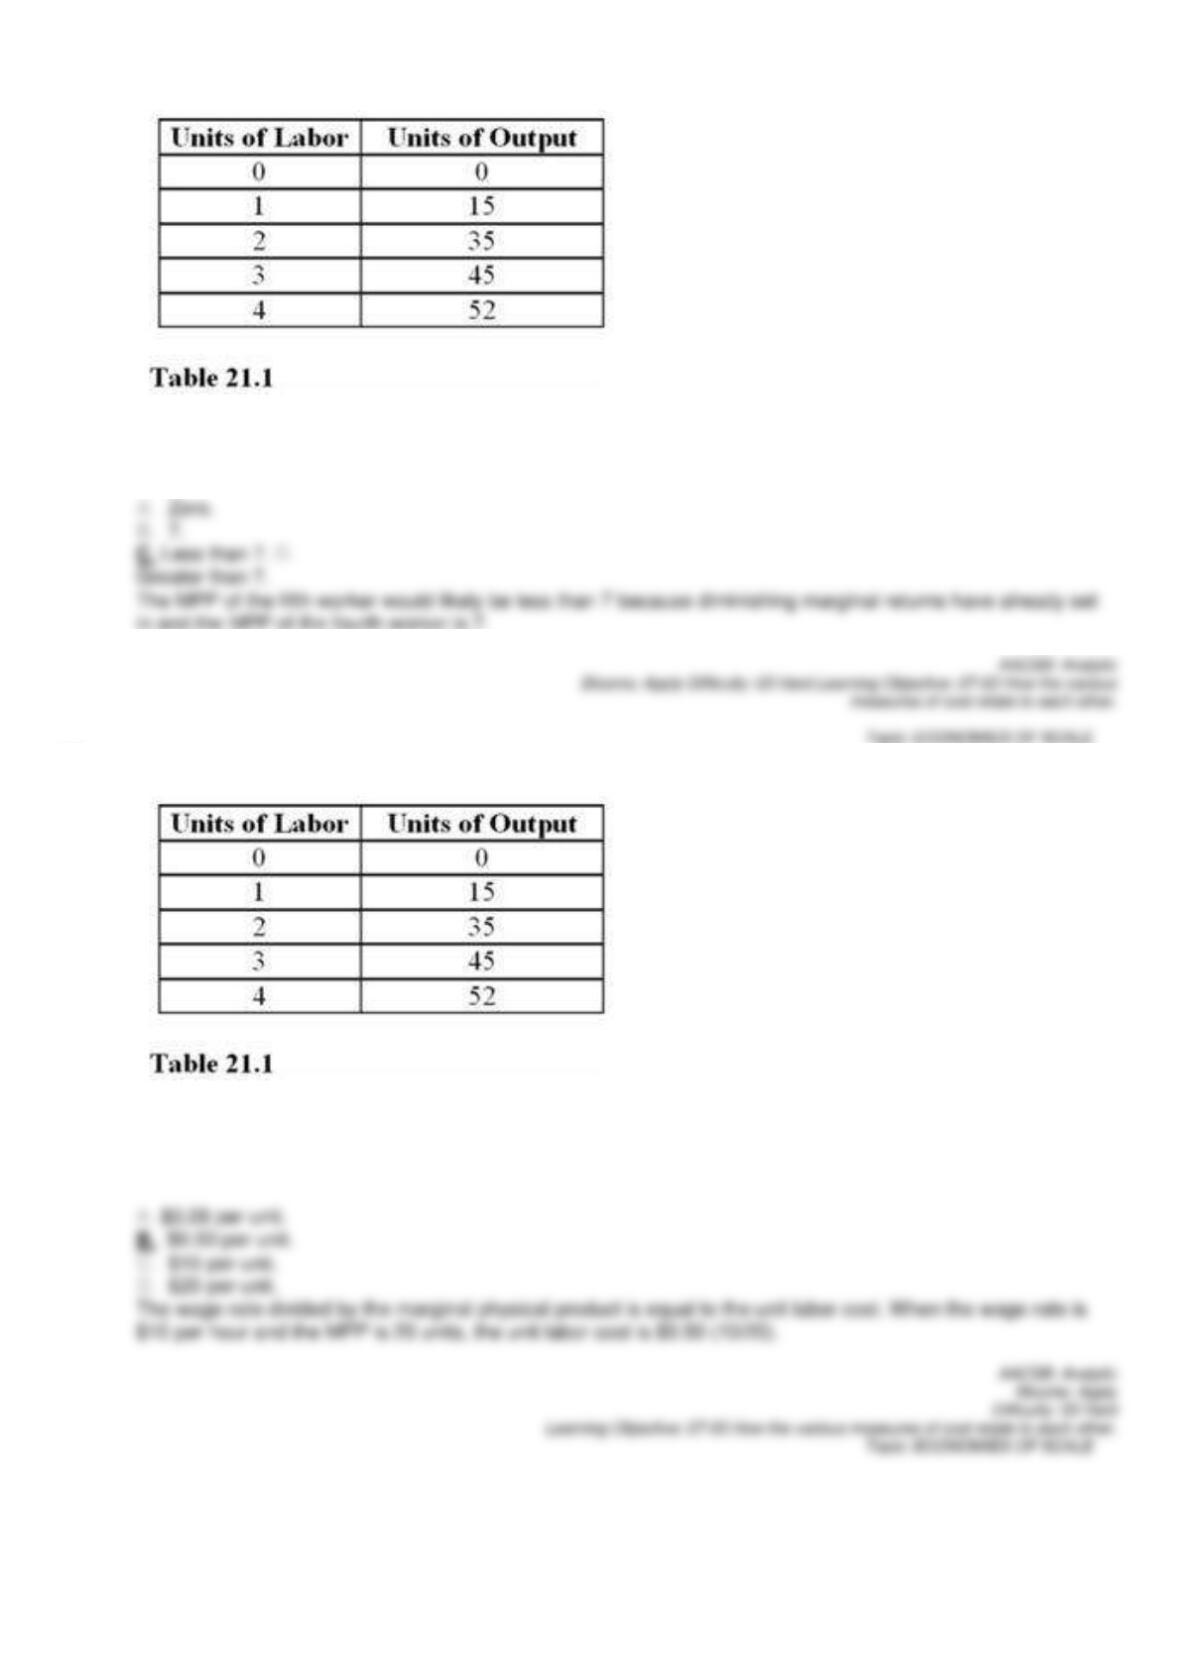
What is the marginal physical product of the second unit of labor in Table 21.1?
81.
With which unit of labor do diminishing marginal returns first appear in Table 21.1?
82.
If a fifth unit of labor was added to Table 21.1, its MPP would most likely be
83.
If workers are paid $10, what is the labor cost per unit of output in Table 21.1 when output is increased from 15
to 35 units of output?
84.
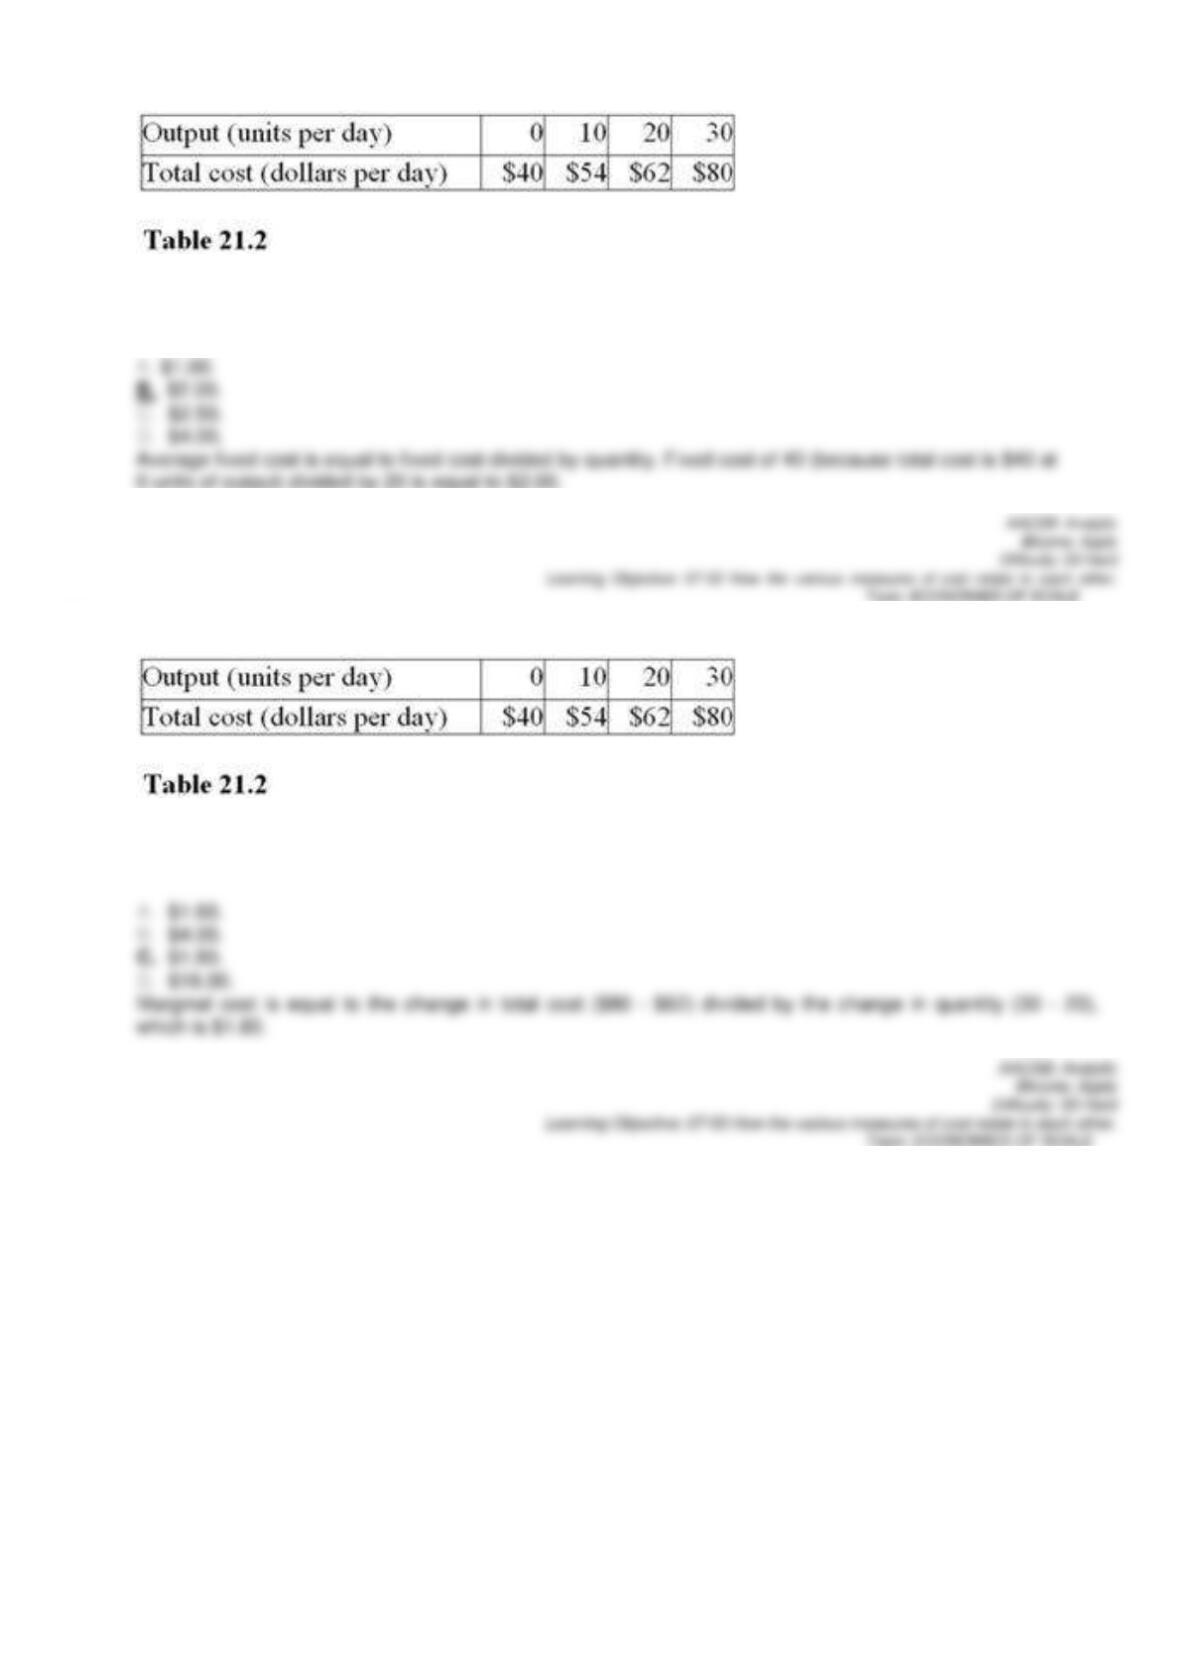
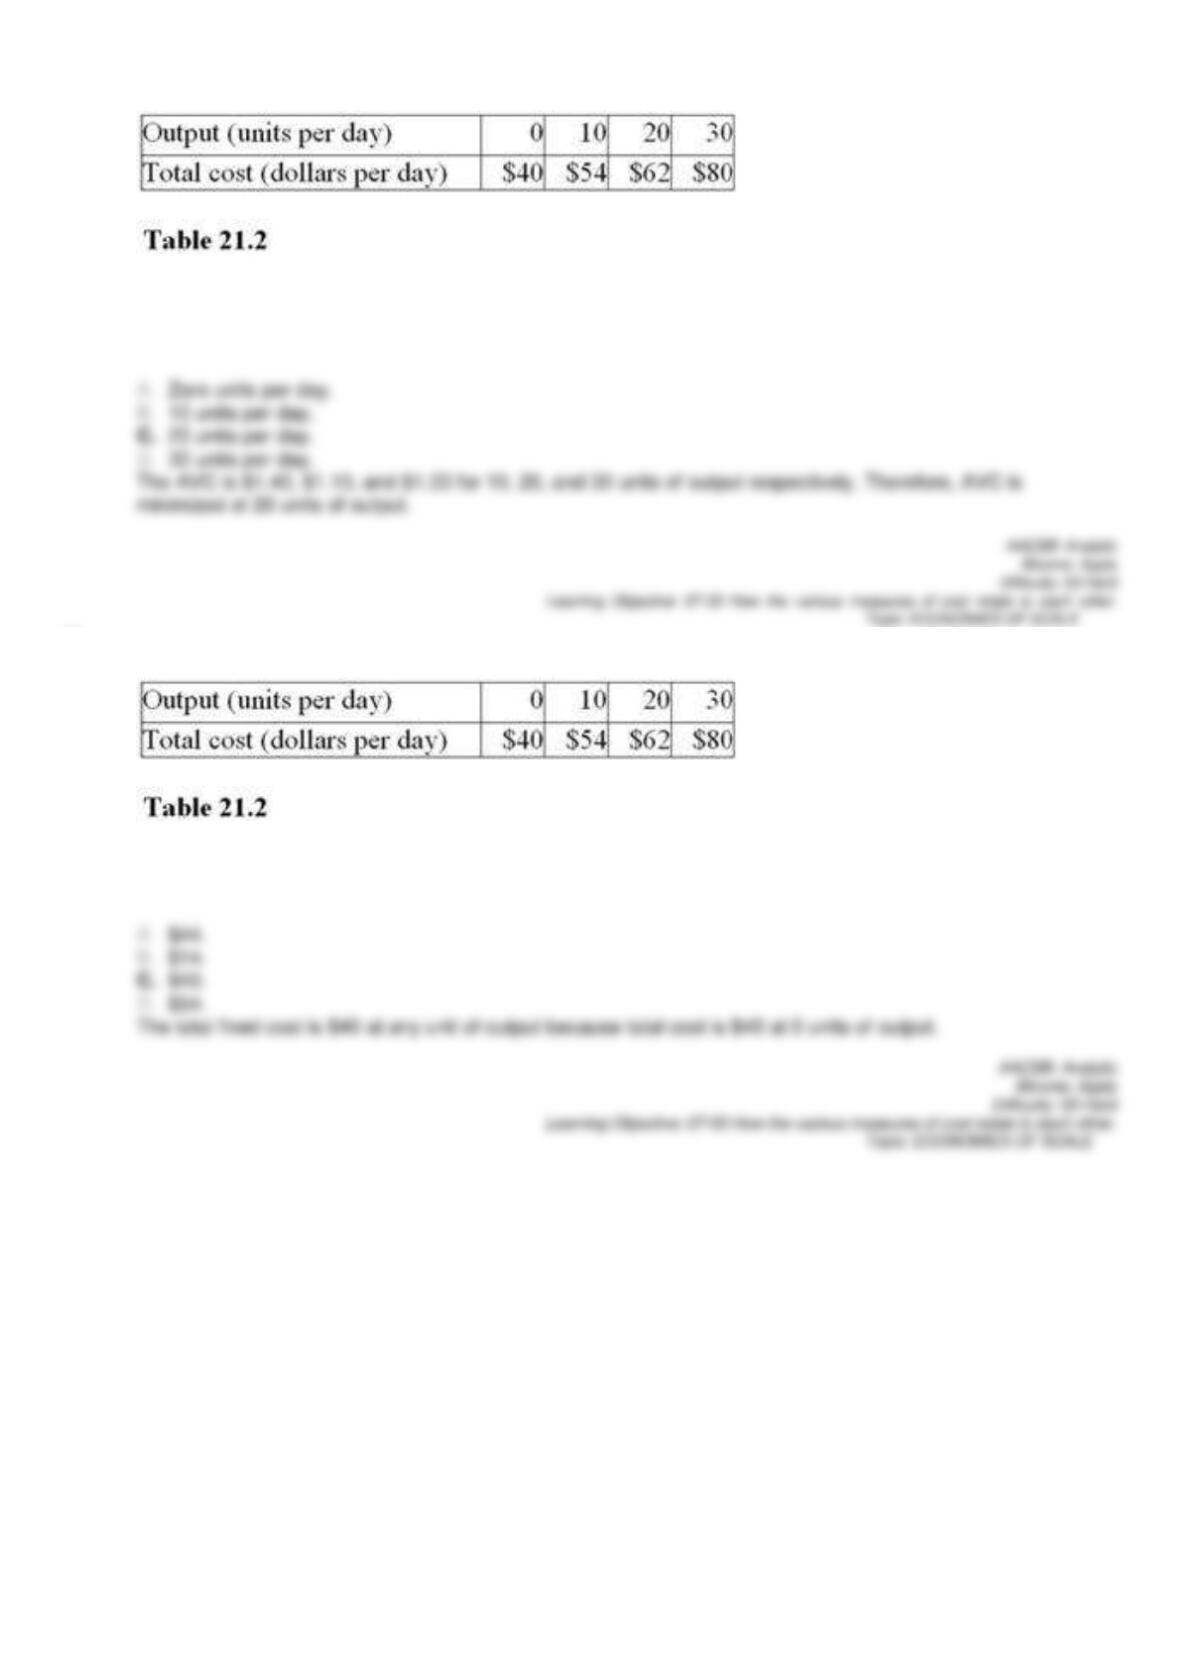
Average fixed cost at 20 units of output in Table 21.2 is
85.
The marginal cost between 20 and 30 units of output in Table 21.2 is
86.
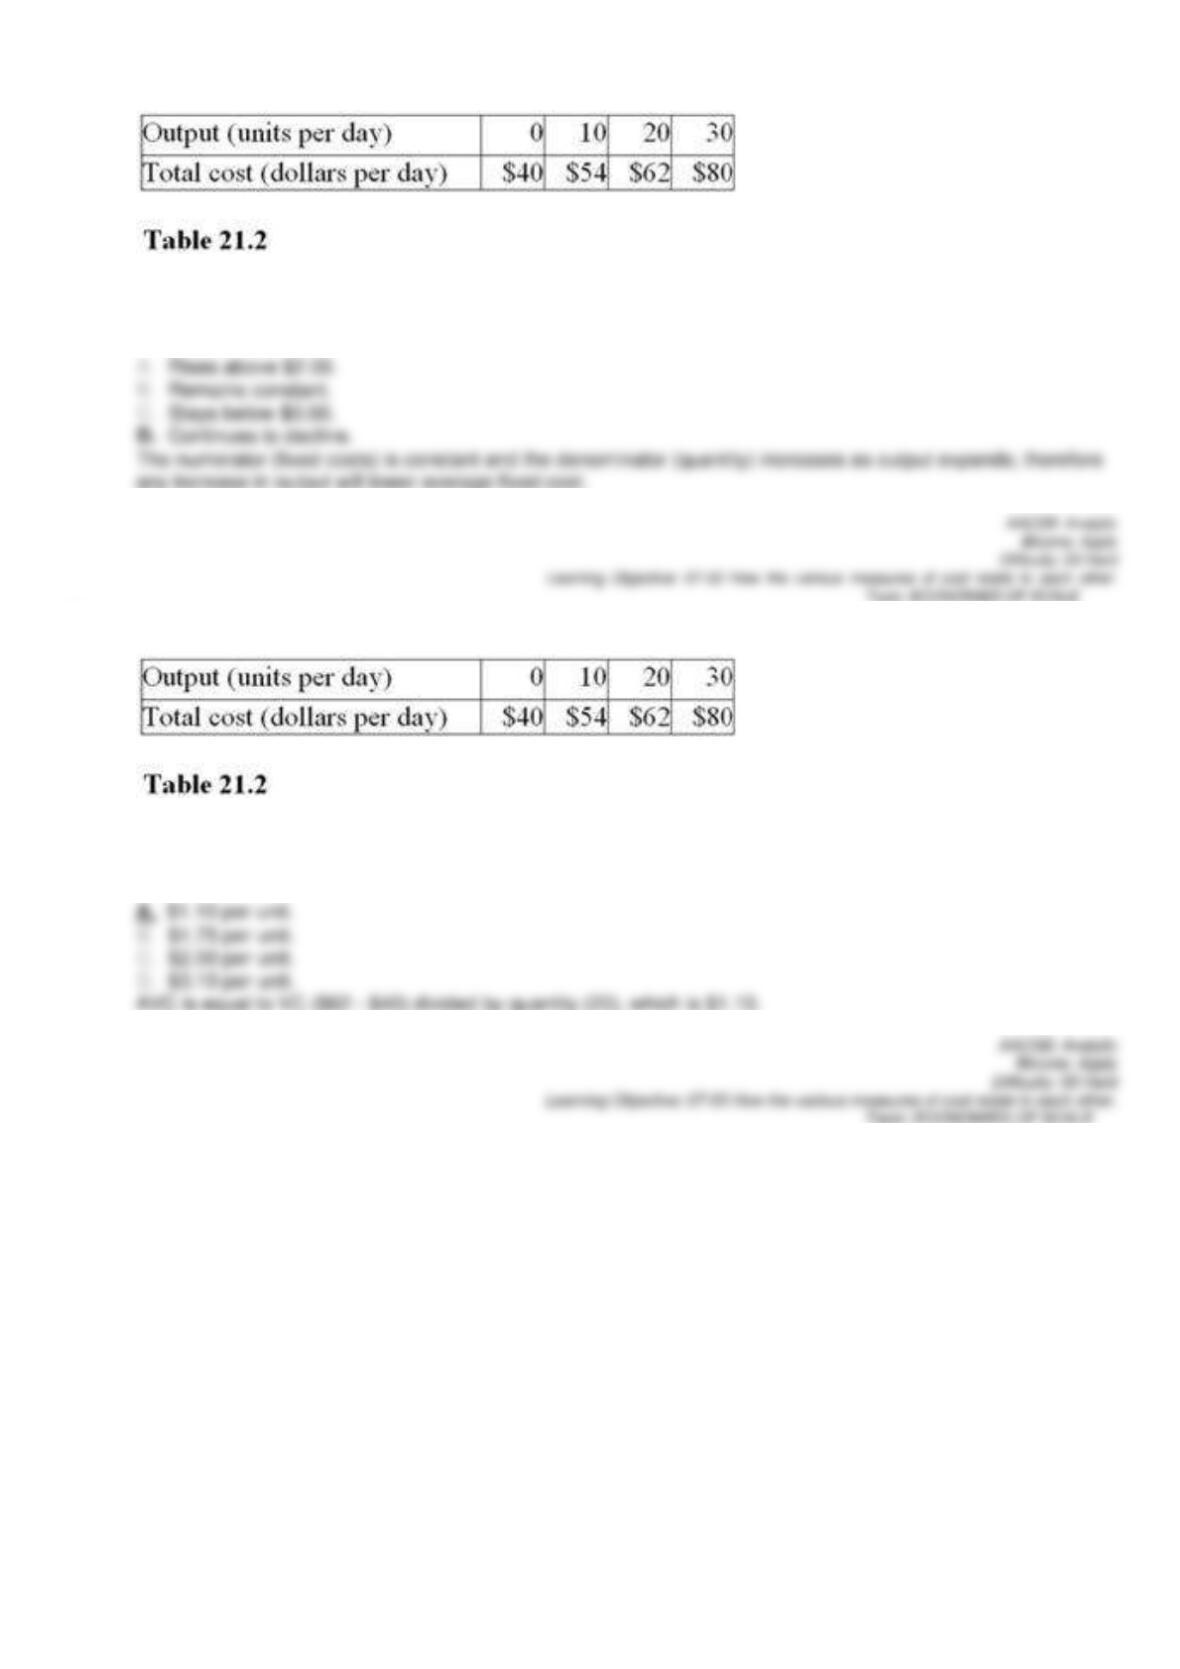
Above 10 units of output, the average fixed cost in Table 21.2
87.
At 20 units of output in Table 21.2, the average variable cost is
88.
For the output levels in Table 21.2, the minimum of the average variable cost curve occurs at a production
rate of
89.
At 10 units of output in Table 21.2, the total fixed cost is
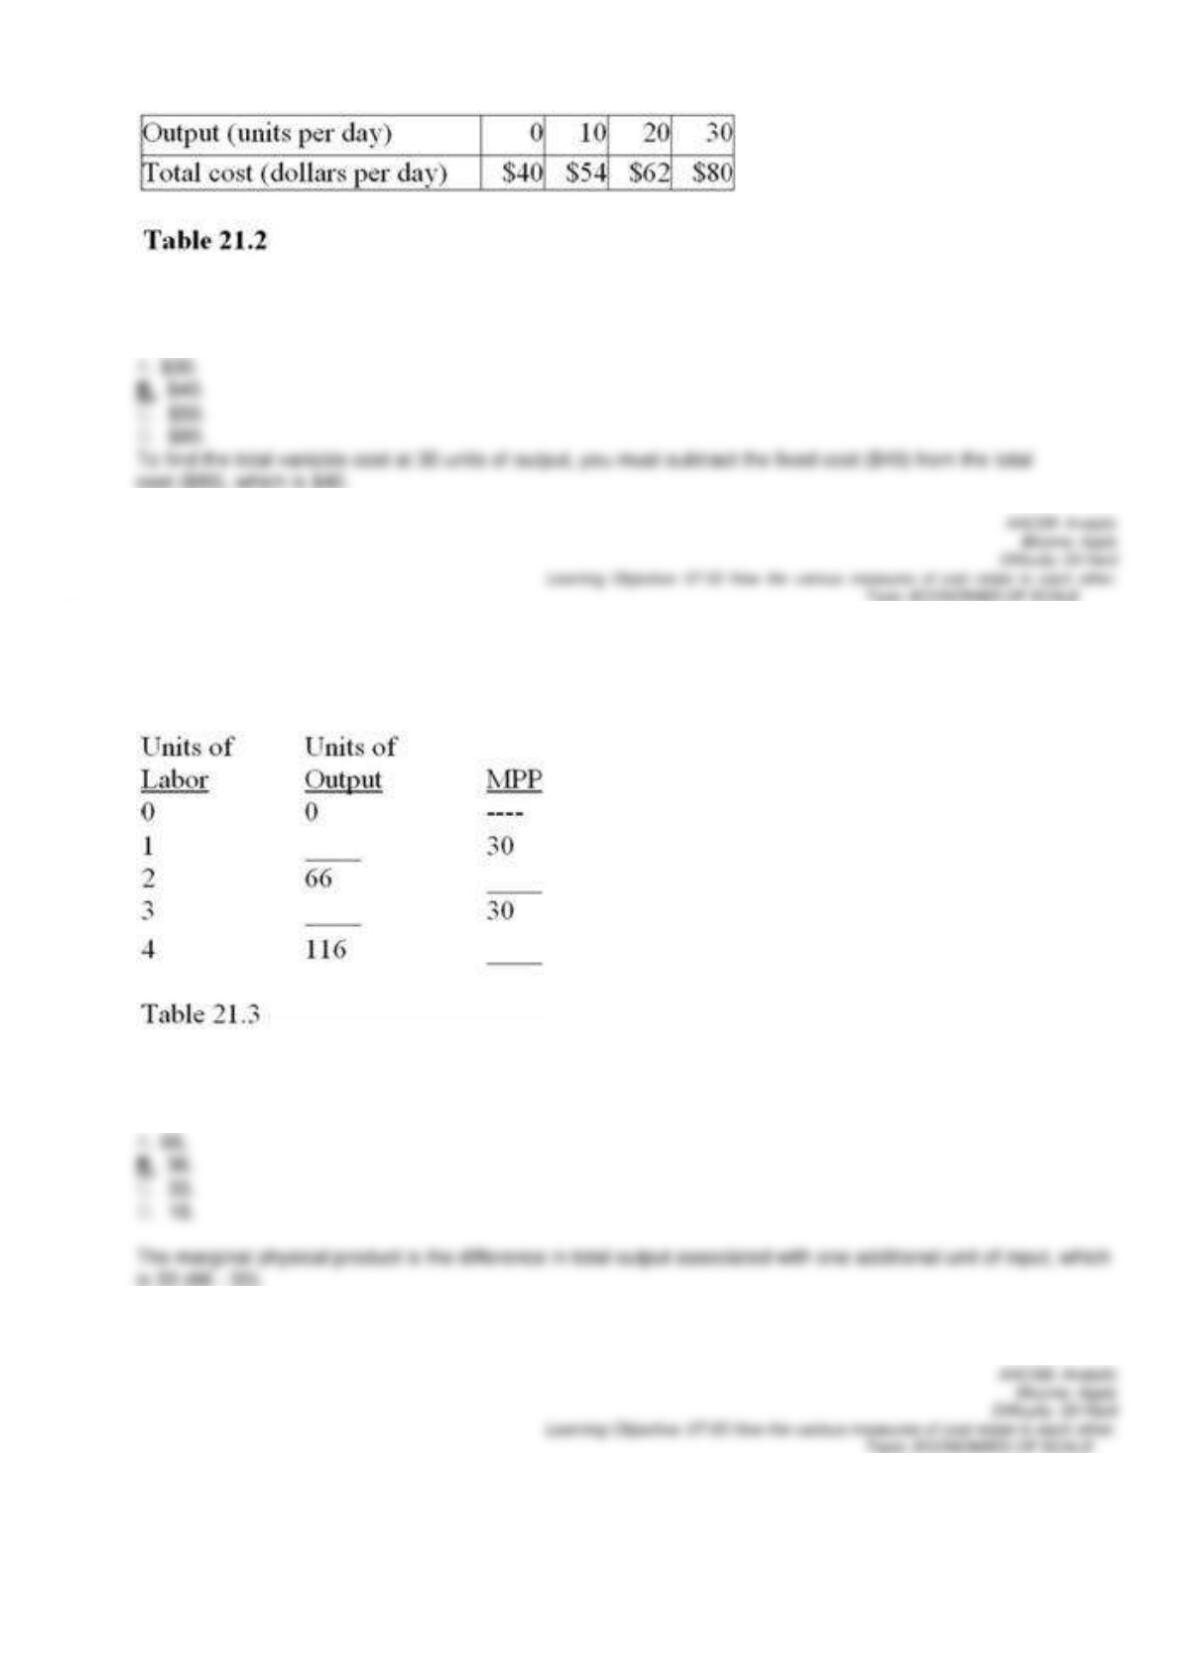
90.
At 30 units of output in Table 21.2, the total variable cost is
91.
Complete Table 21.3 below:
What is the marginal physical product of the second unit of labor in Table 21.3?
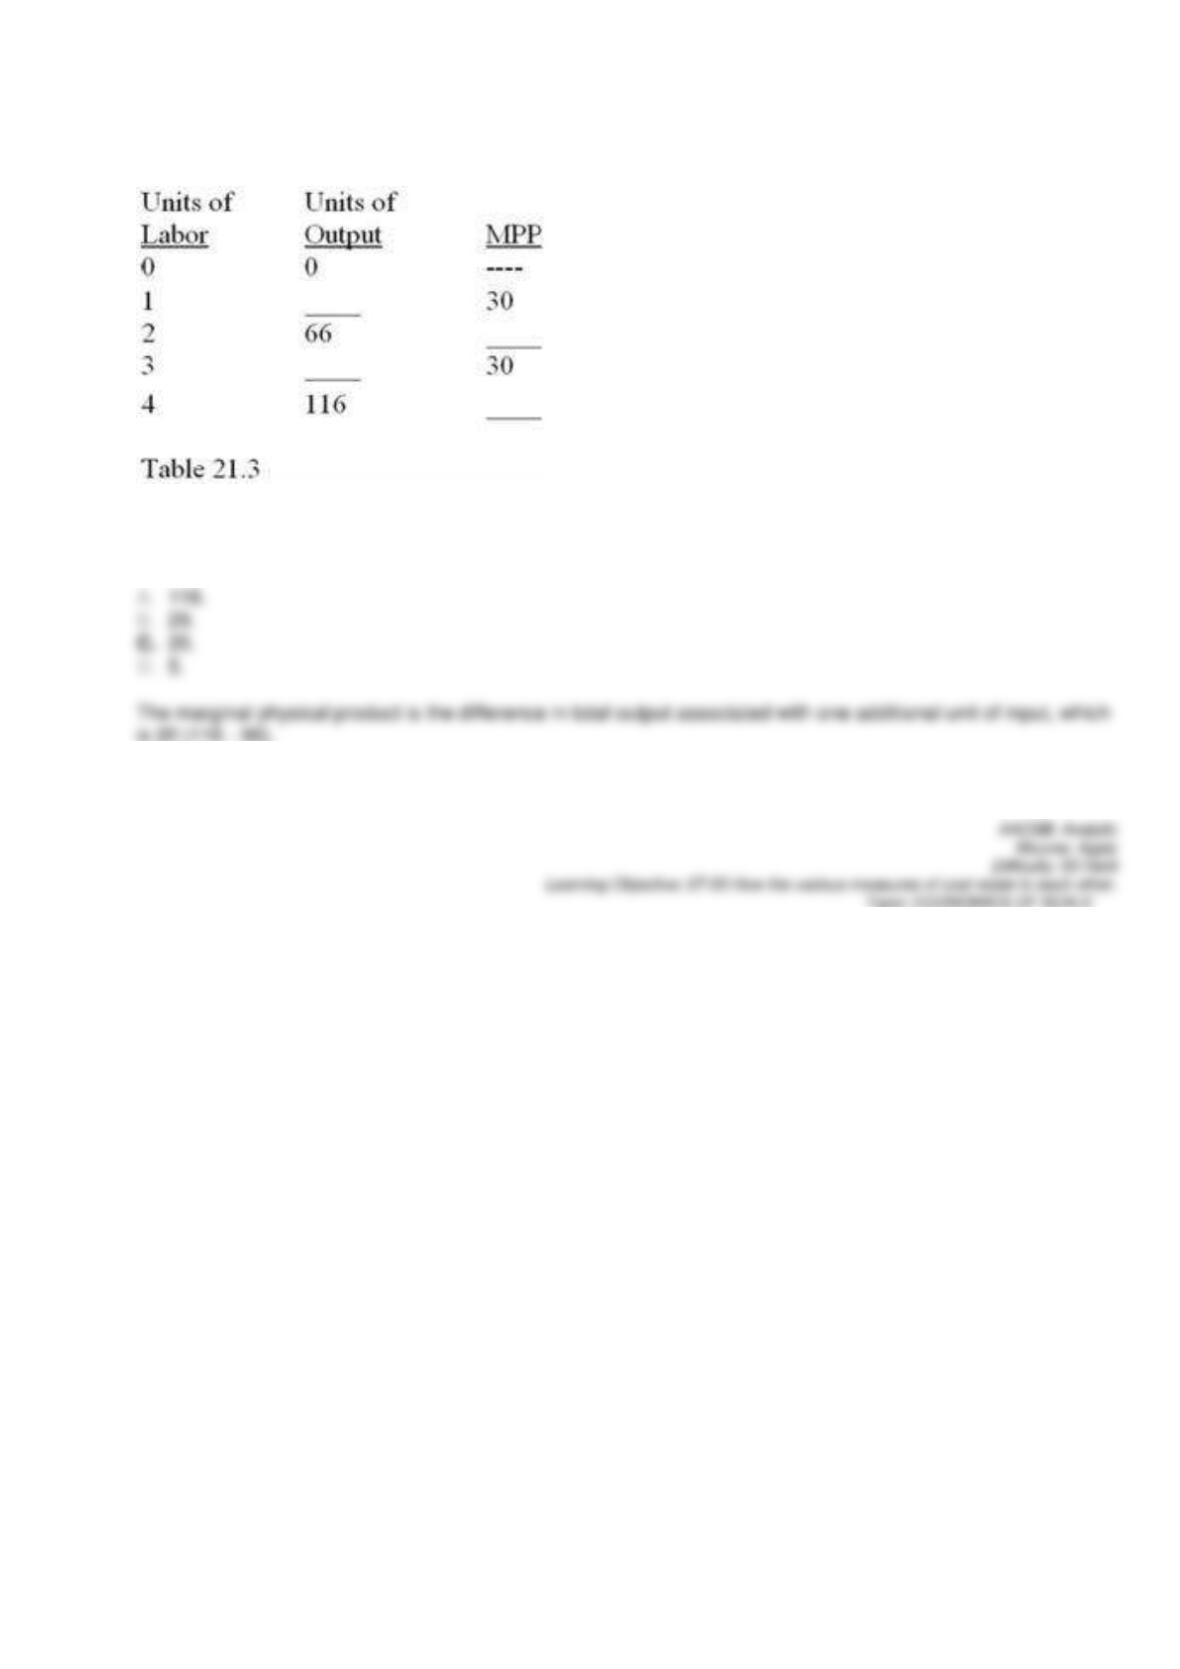
92.
Complete Table 21.3 below:
What is the marginal physical product of the fourth unit of labor in Table 21.3?
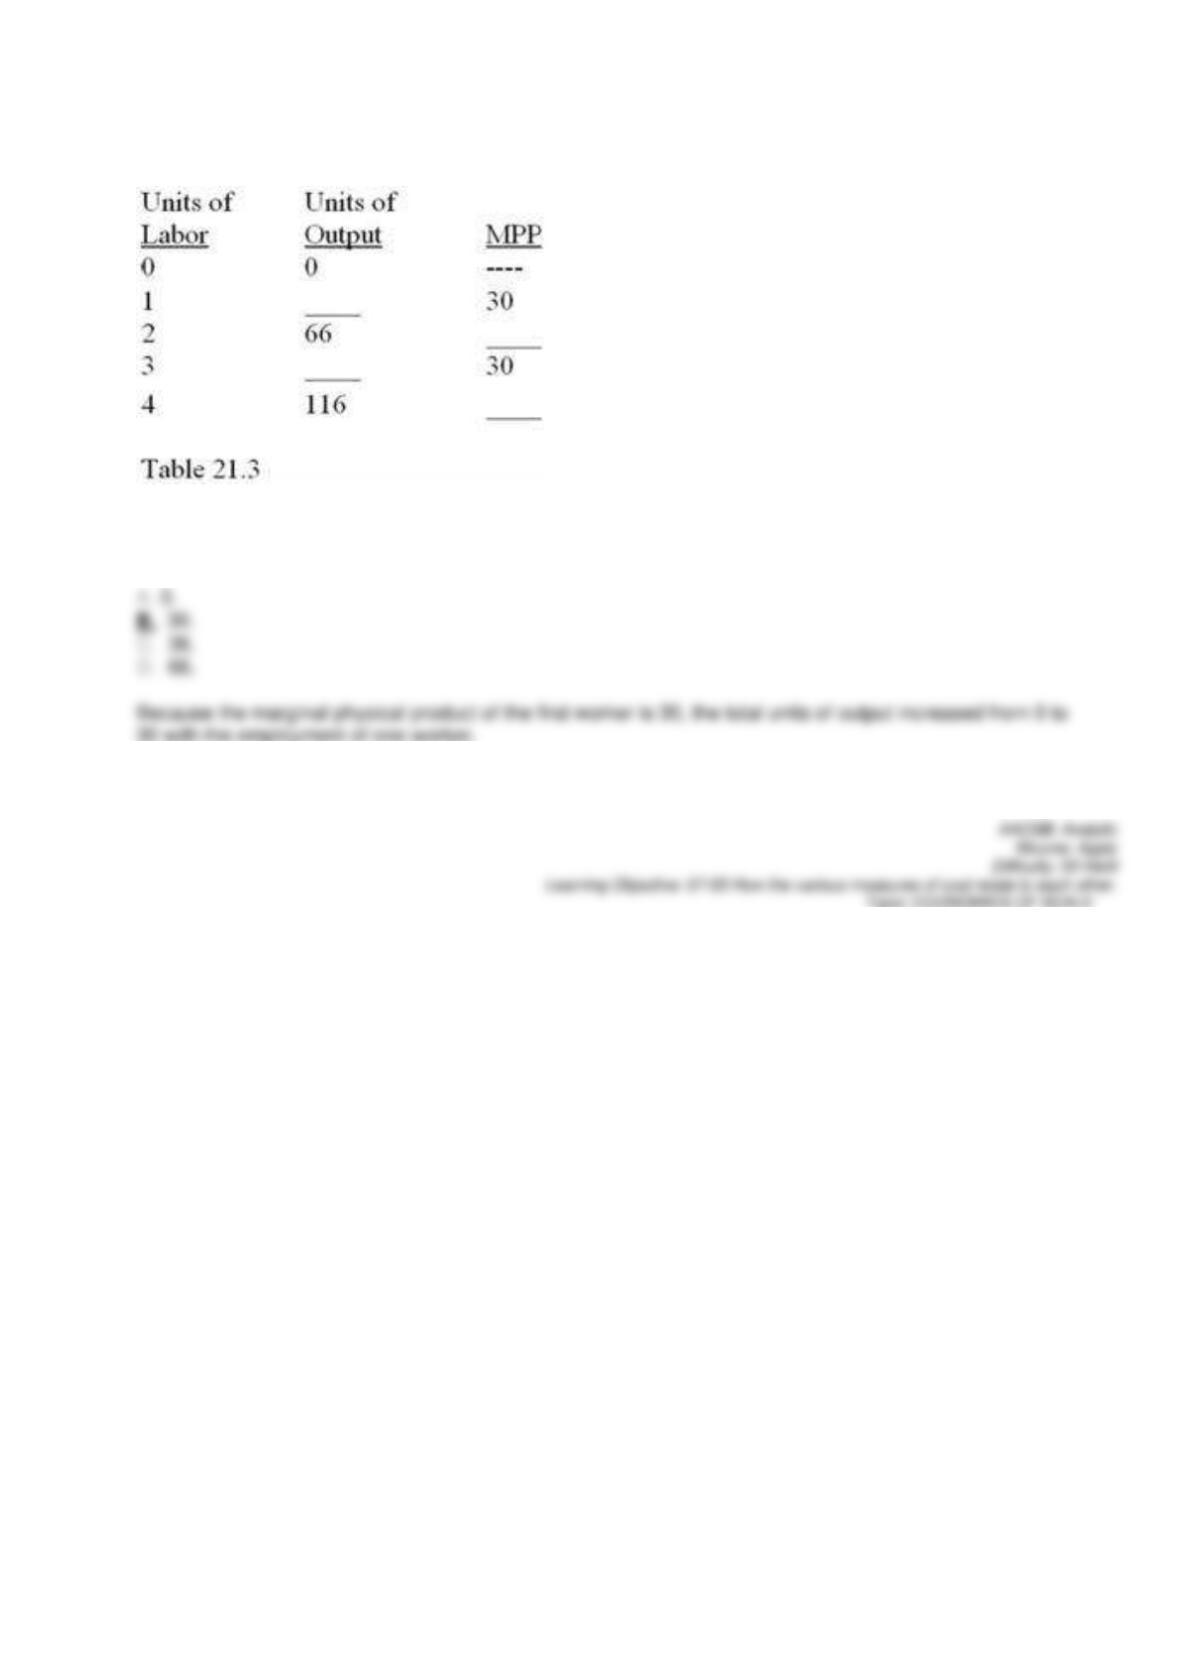
93.
Complete Table 21.3 below:
How many units of output can be produced when one unit of labor is employed in Table 21.3?
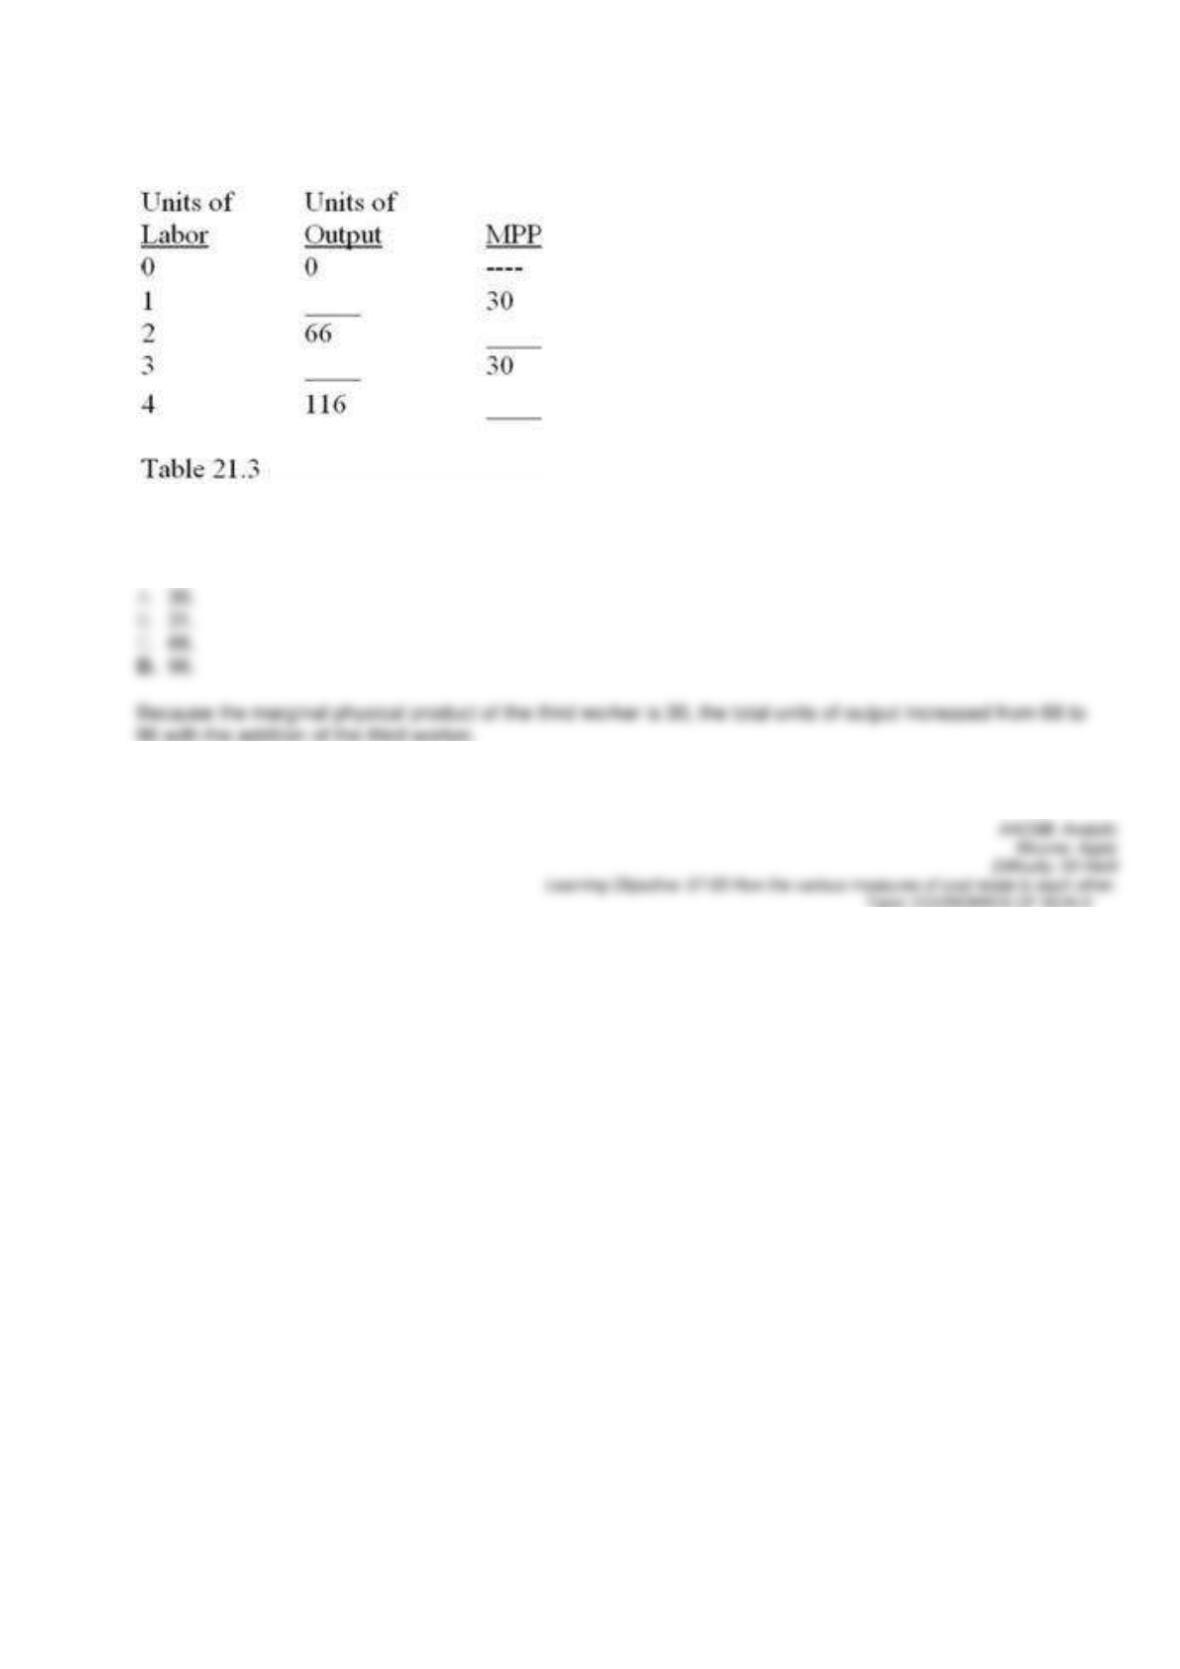
94.
Complete Table 21.3 below:
How many units of output can be produced when three units of labor are employed in Table 21.3?
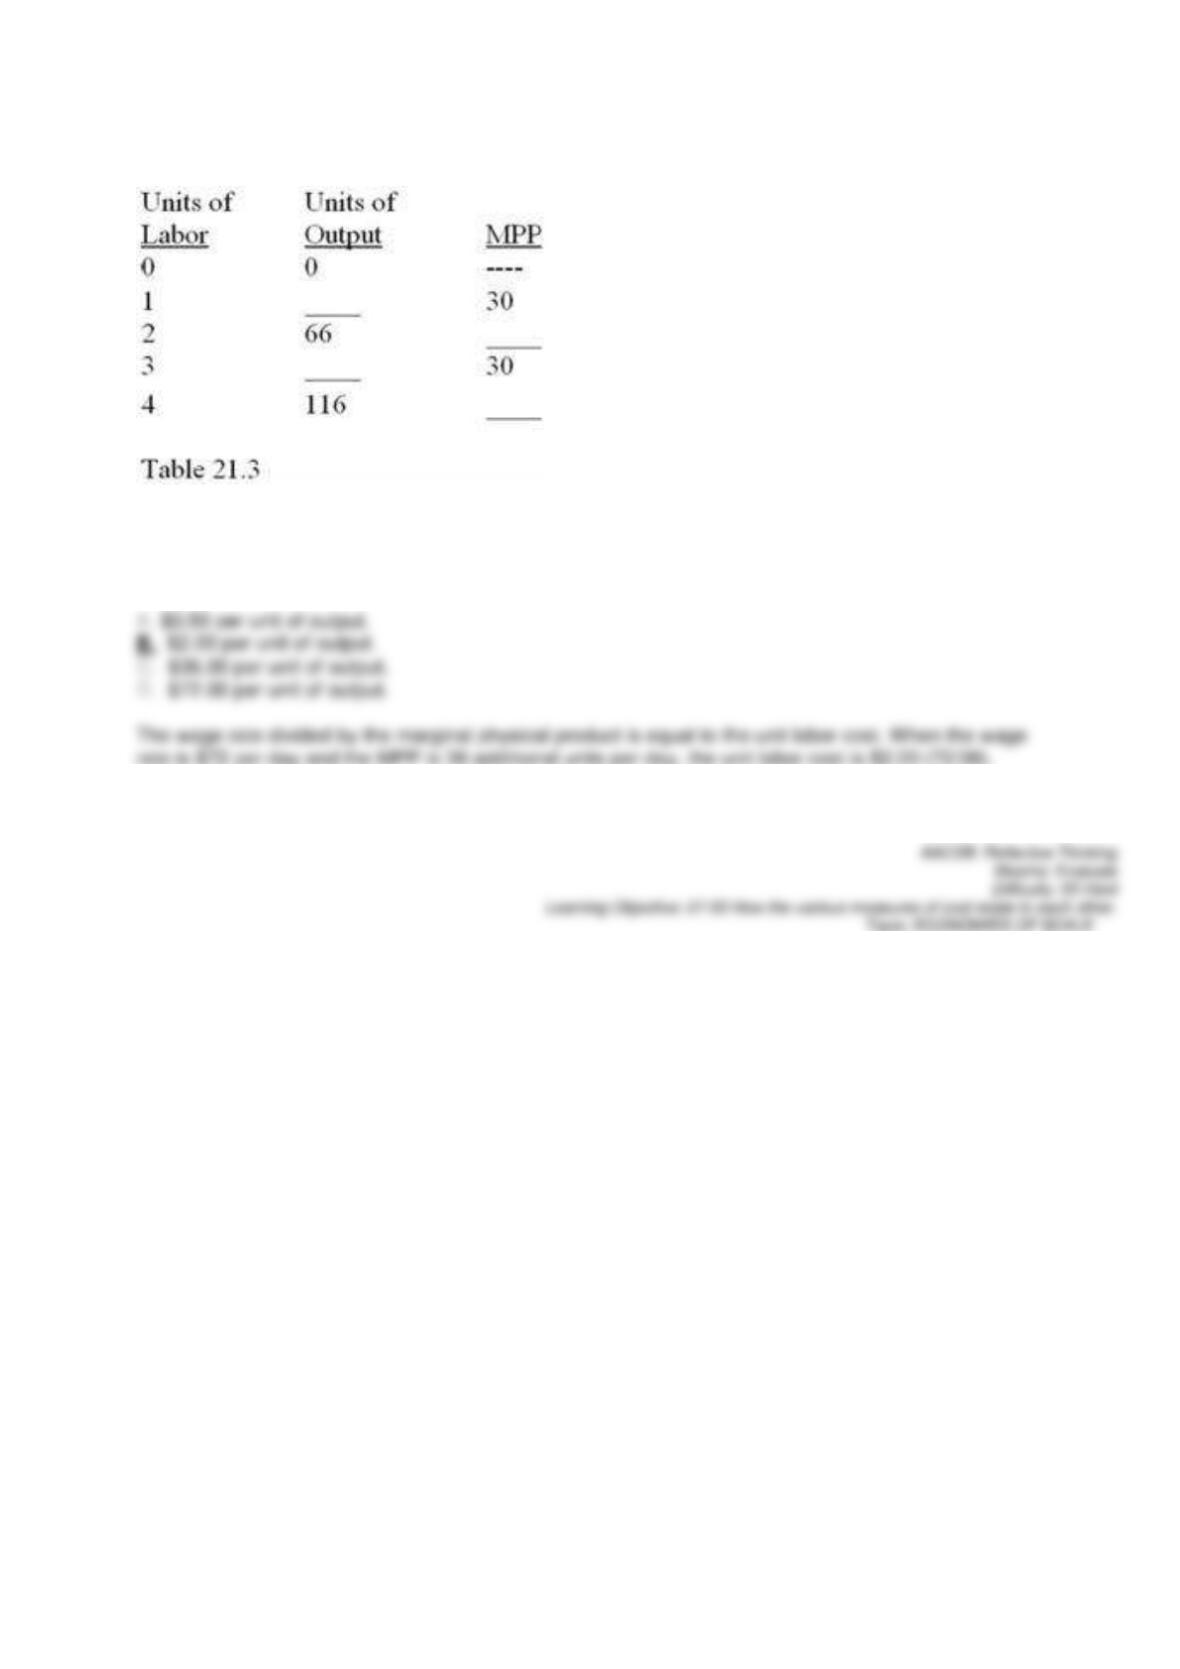
95.
Complete Table 21.3 below:
What is the unit labor cost in Table 21.3 for the second unit of labor if the MPP represents daily output and the
wage rate is $72 per day?
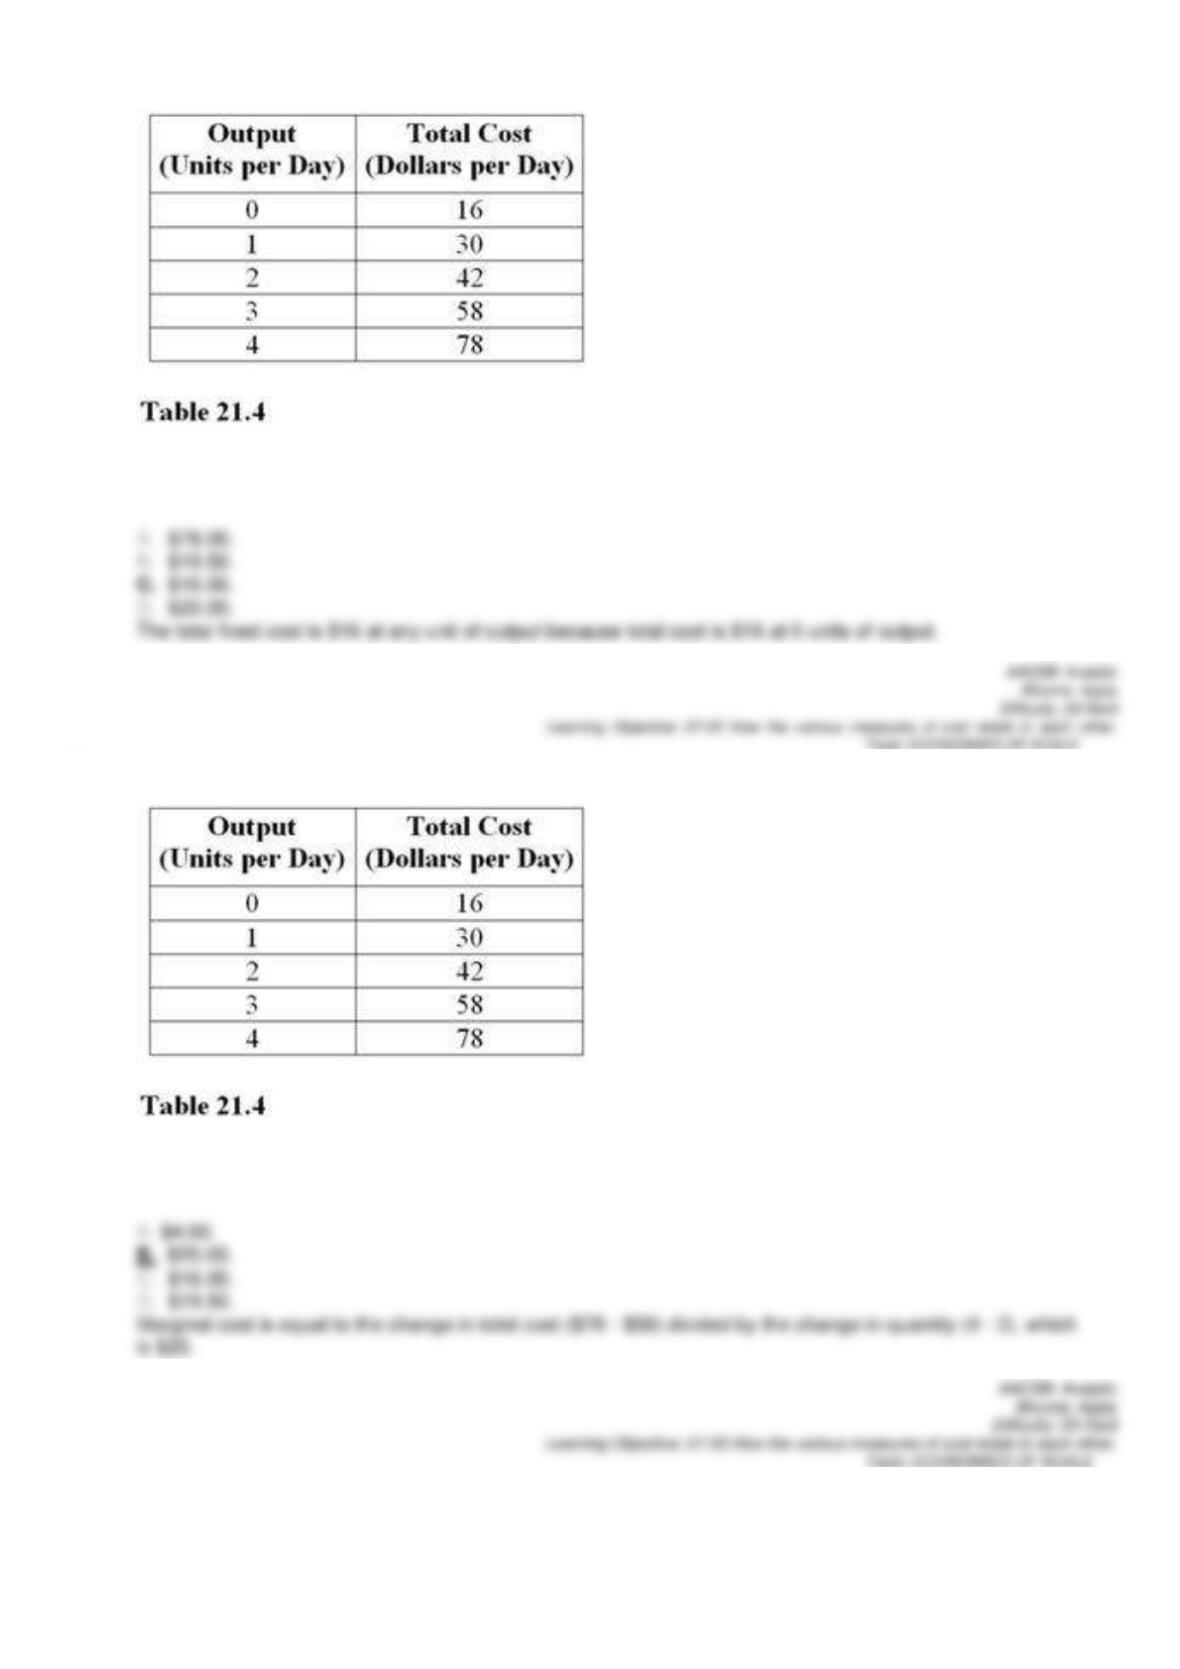
96.
At 4 units of output in Table 21.4, total fixed costs are
97.
The marginal cost of the fourth unit of output in Table 21.4 is
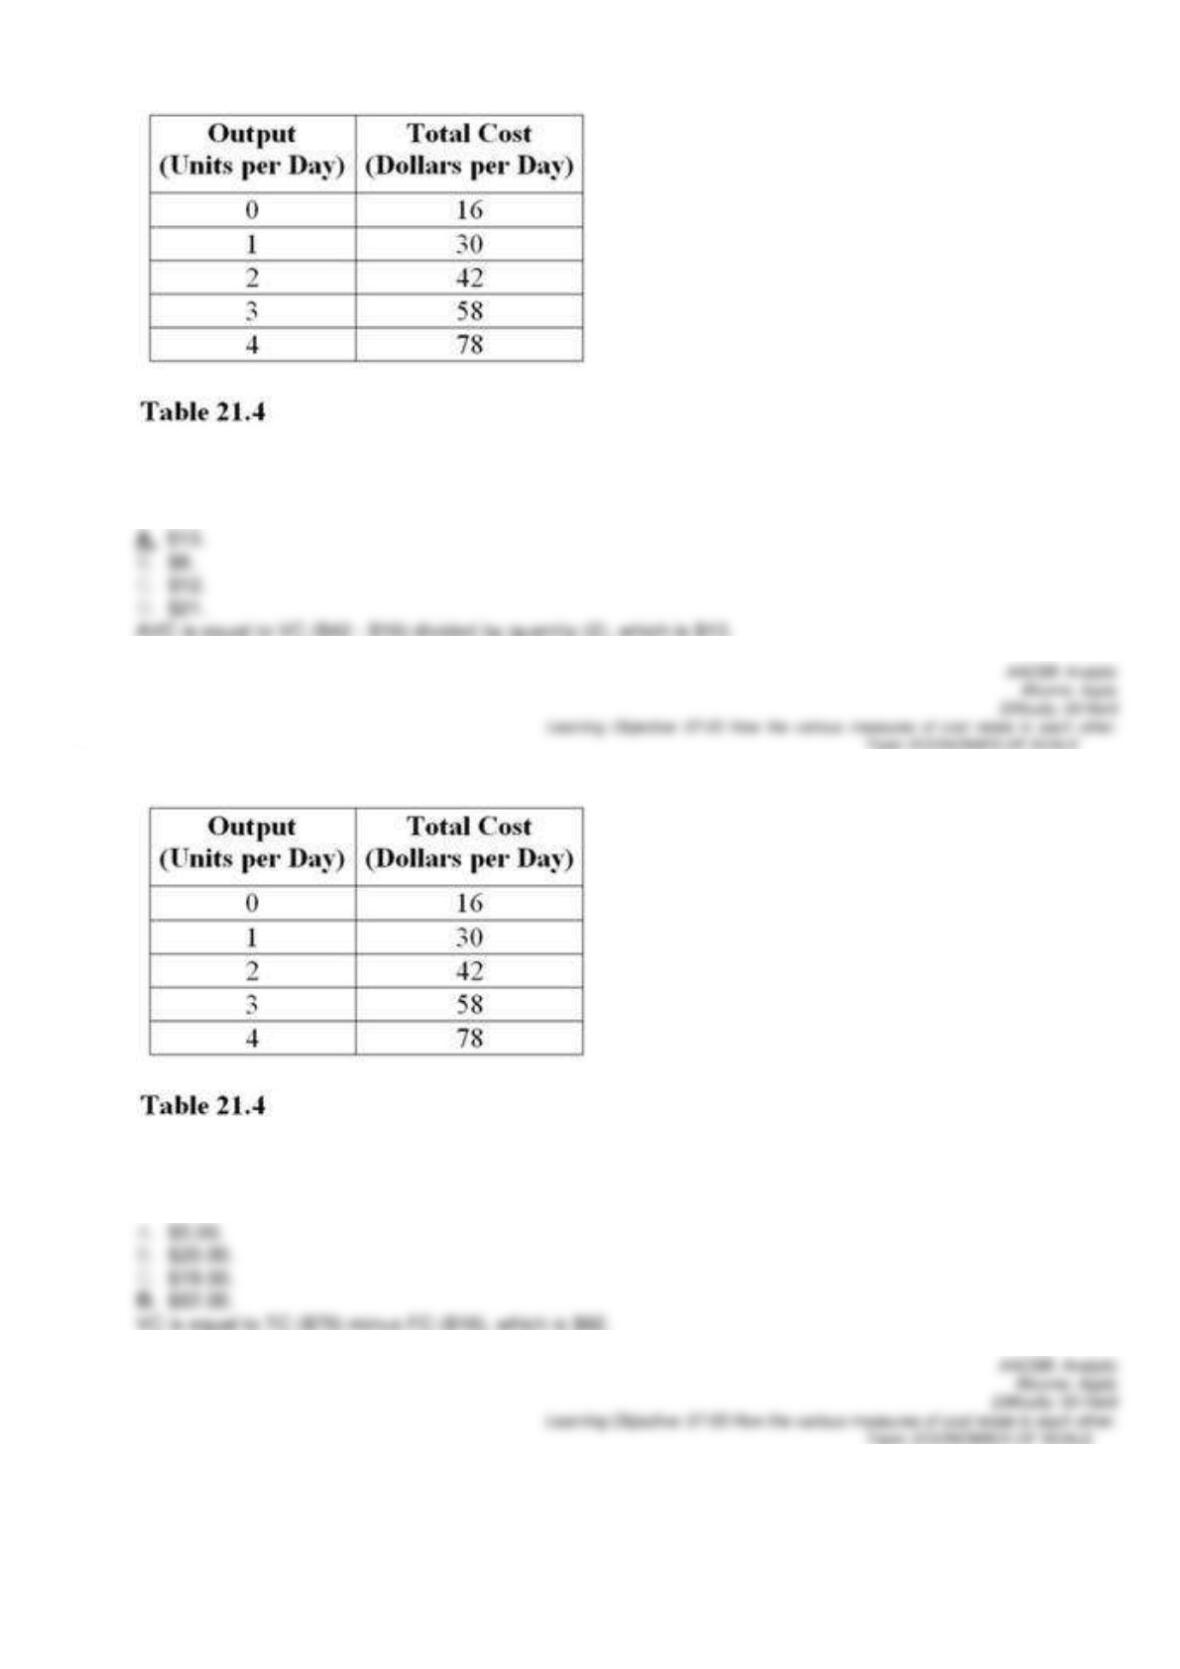
98.
At 2 units of output in Table 21.4, the average variable cost is
99.
At 4 units of output in Table 21.4, the total variable cost is
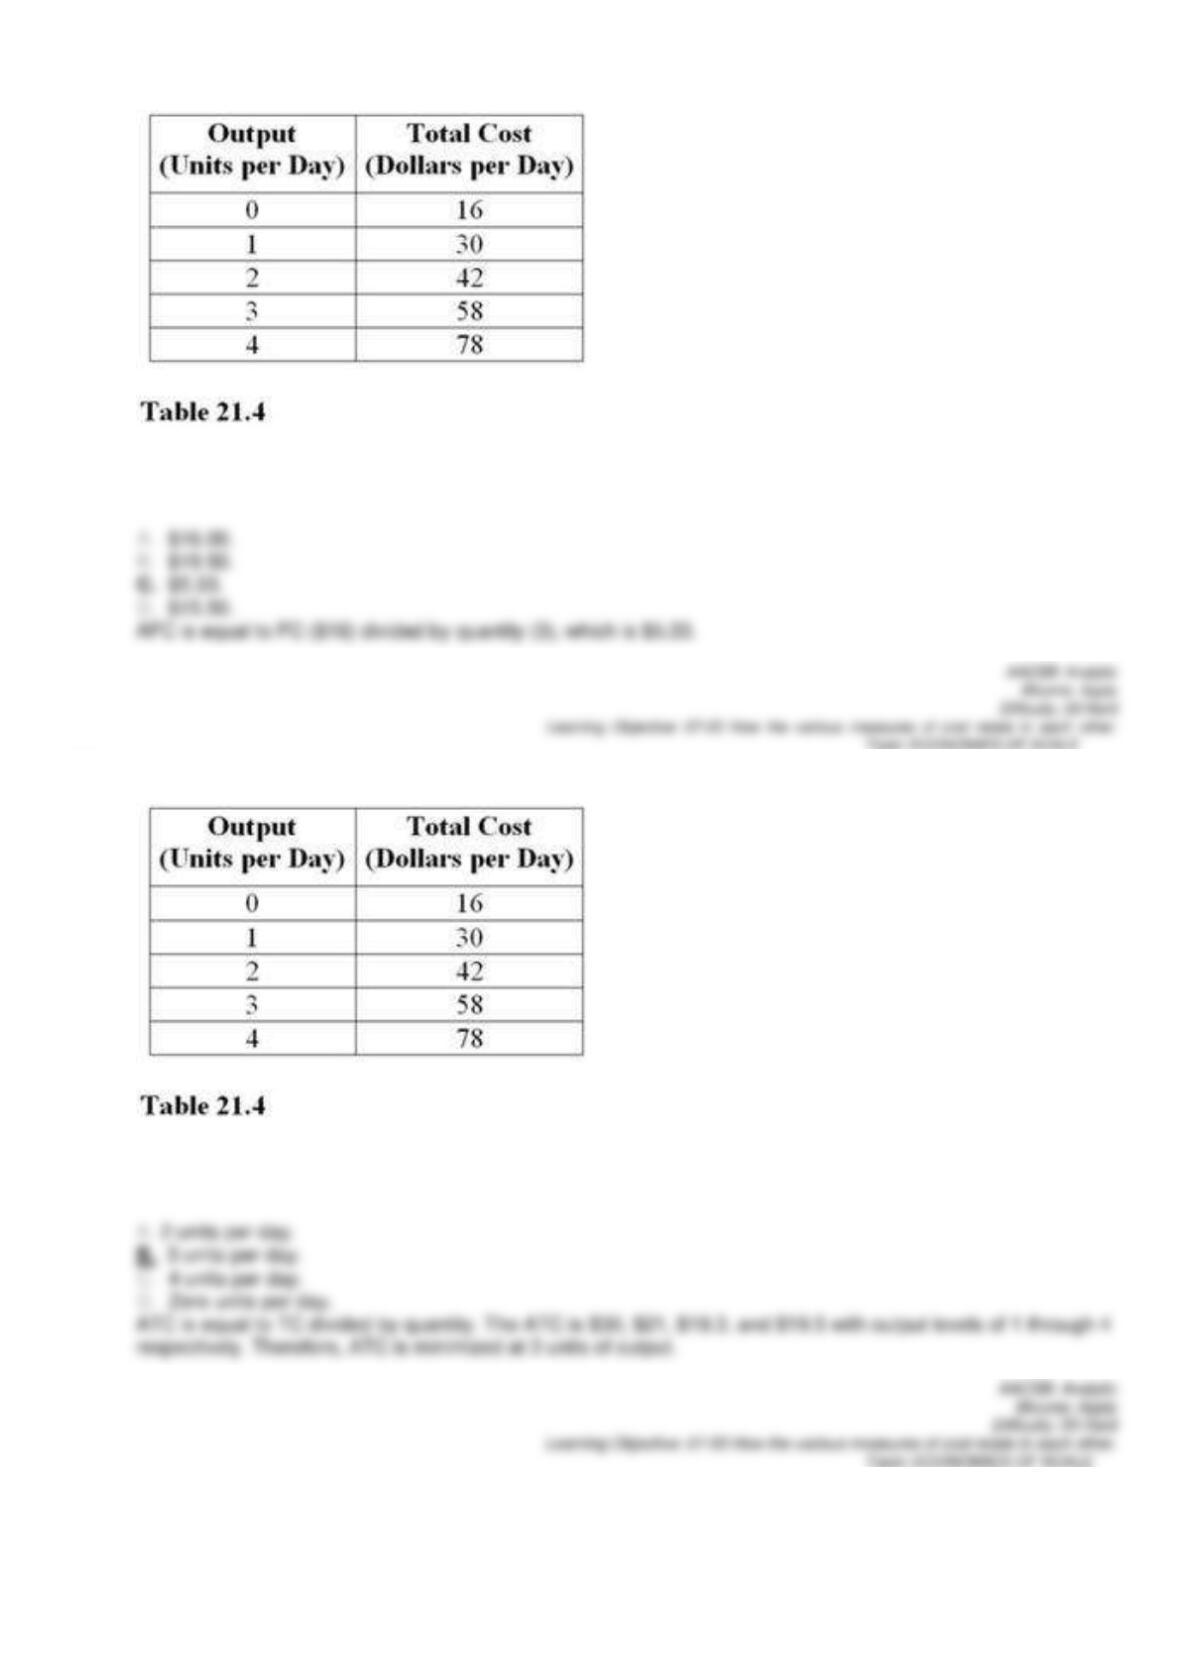
100.
At 3 units of output in Table 21.4, average fixed costs are
101.
For the output levels in Table 21.4, the minimum of the average total cost curve occurs at a production rate of