Exam
Name___________________________________
SHORT ANSWER. Write the word or phrase that best completes each statement or answers the question.
Construct a bar graph to represent the given data.
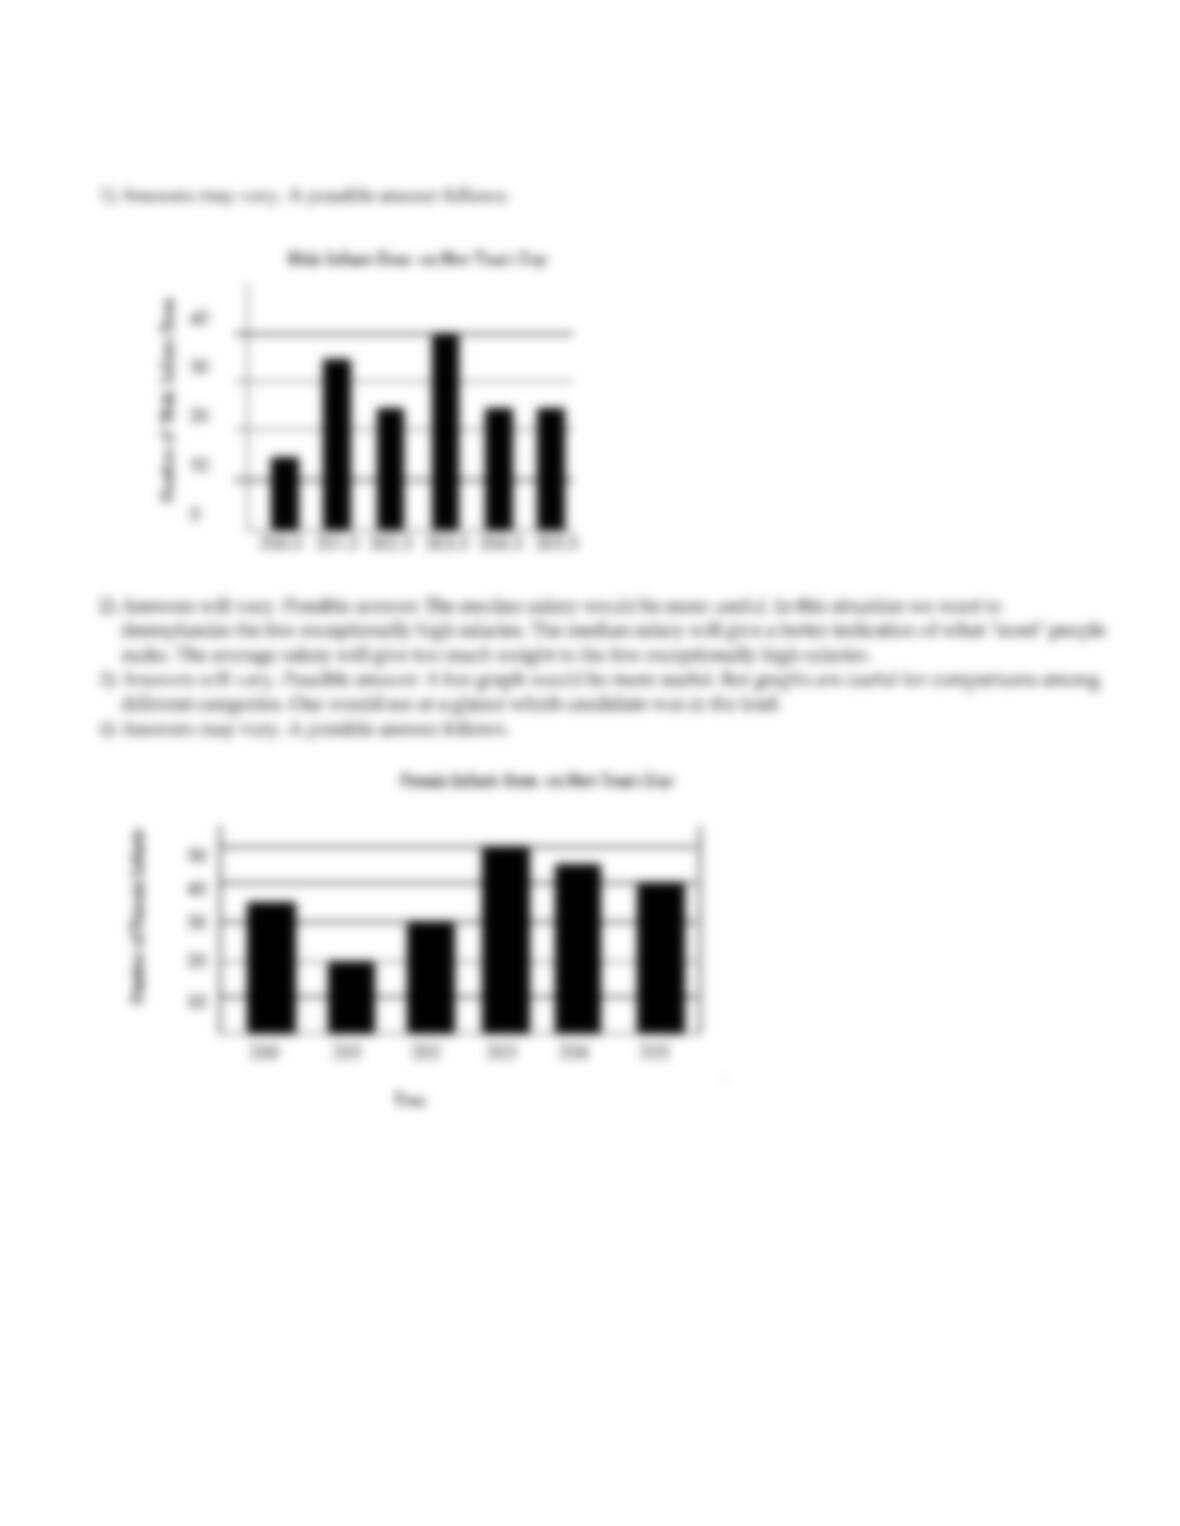
1)
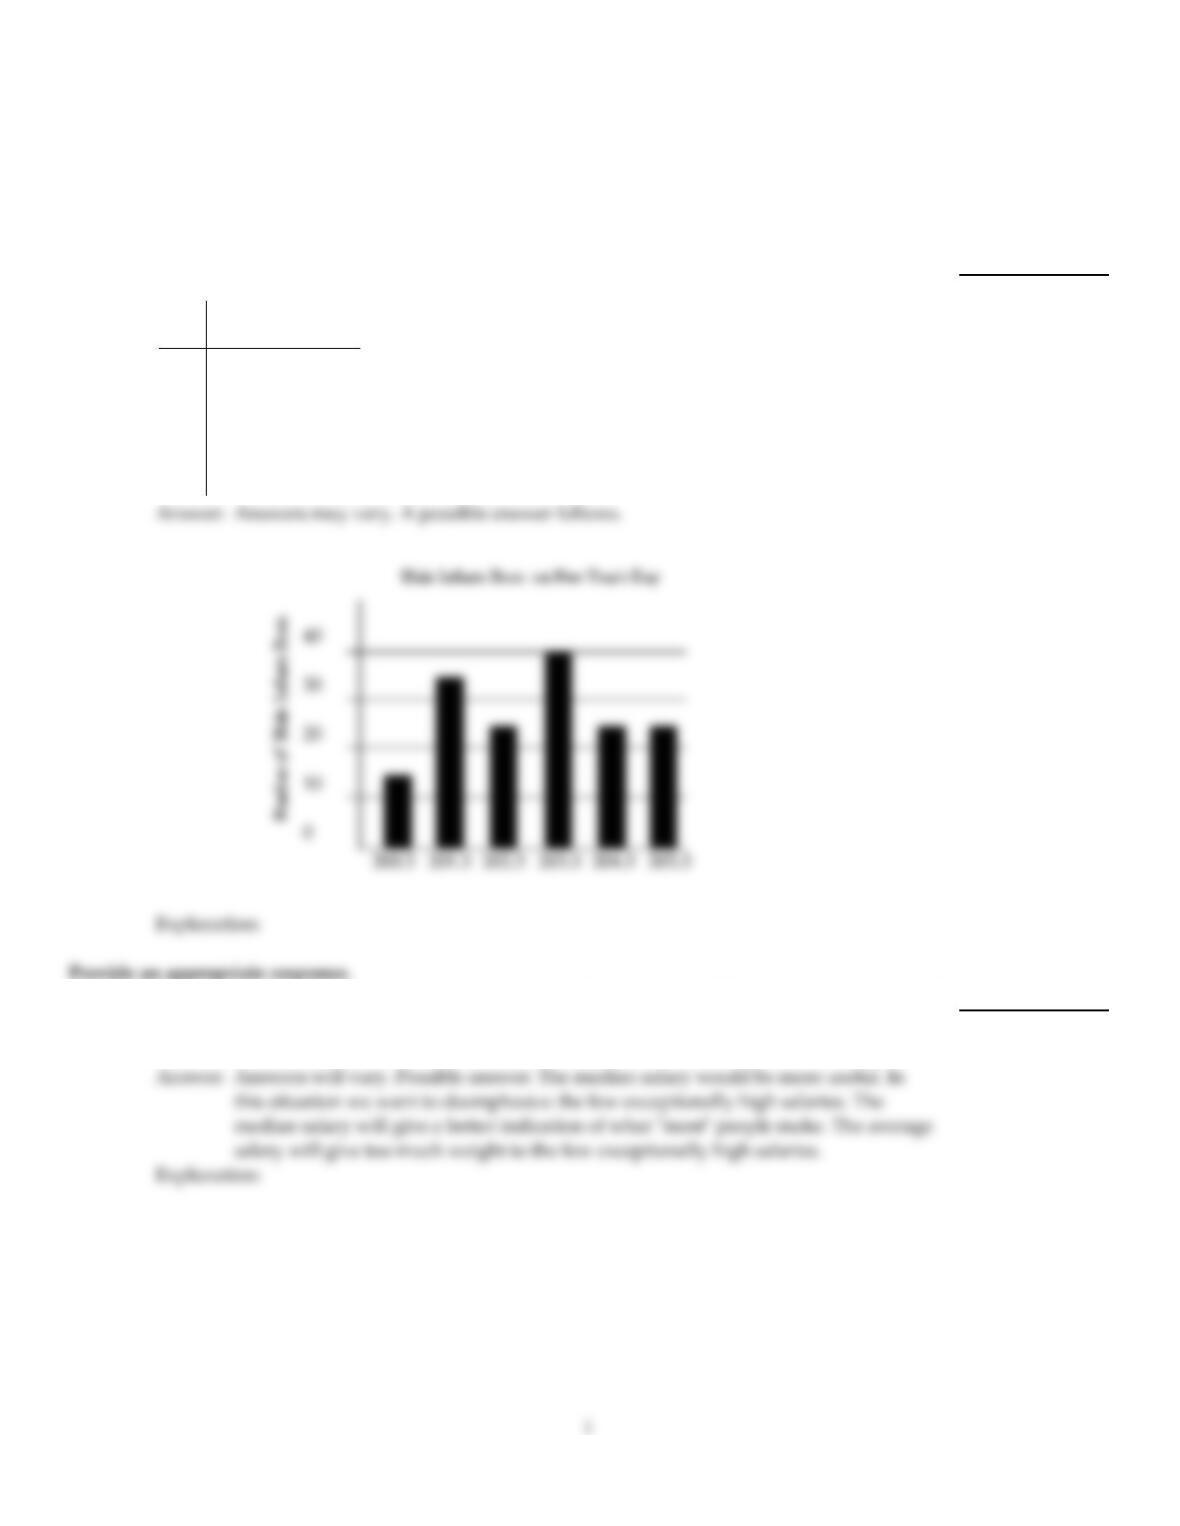
The following table shows the number of male infants born at Hospital X on New Year’s
Day (Jan. 1).
Year No. of Male
Infants Born Jan 1
200.3 15
201.3 35
202.3 25
203.3 40
204.3 25
205.3 25
1)
2)
A high school student is considering a number of different careers. Which information do
you think would be more useful to him, the average salary or the median salary for people
in each career? Explain your answer.
2)
3)
Six different candidates are running for state governor. By conducting a poll, you estimate
the percentage of people who plan to vote for each candidate. It looks like a close race
between two candidates. Suppose you wish to display the data in a graph. Your graph
should clearly show which candidate is in the lead. Which graph would be more useful, a
bar graph or a circle graph? Explain your answer.
3)
4)
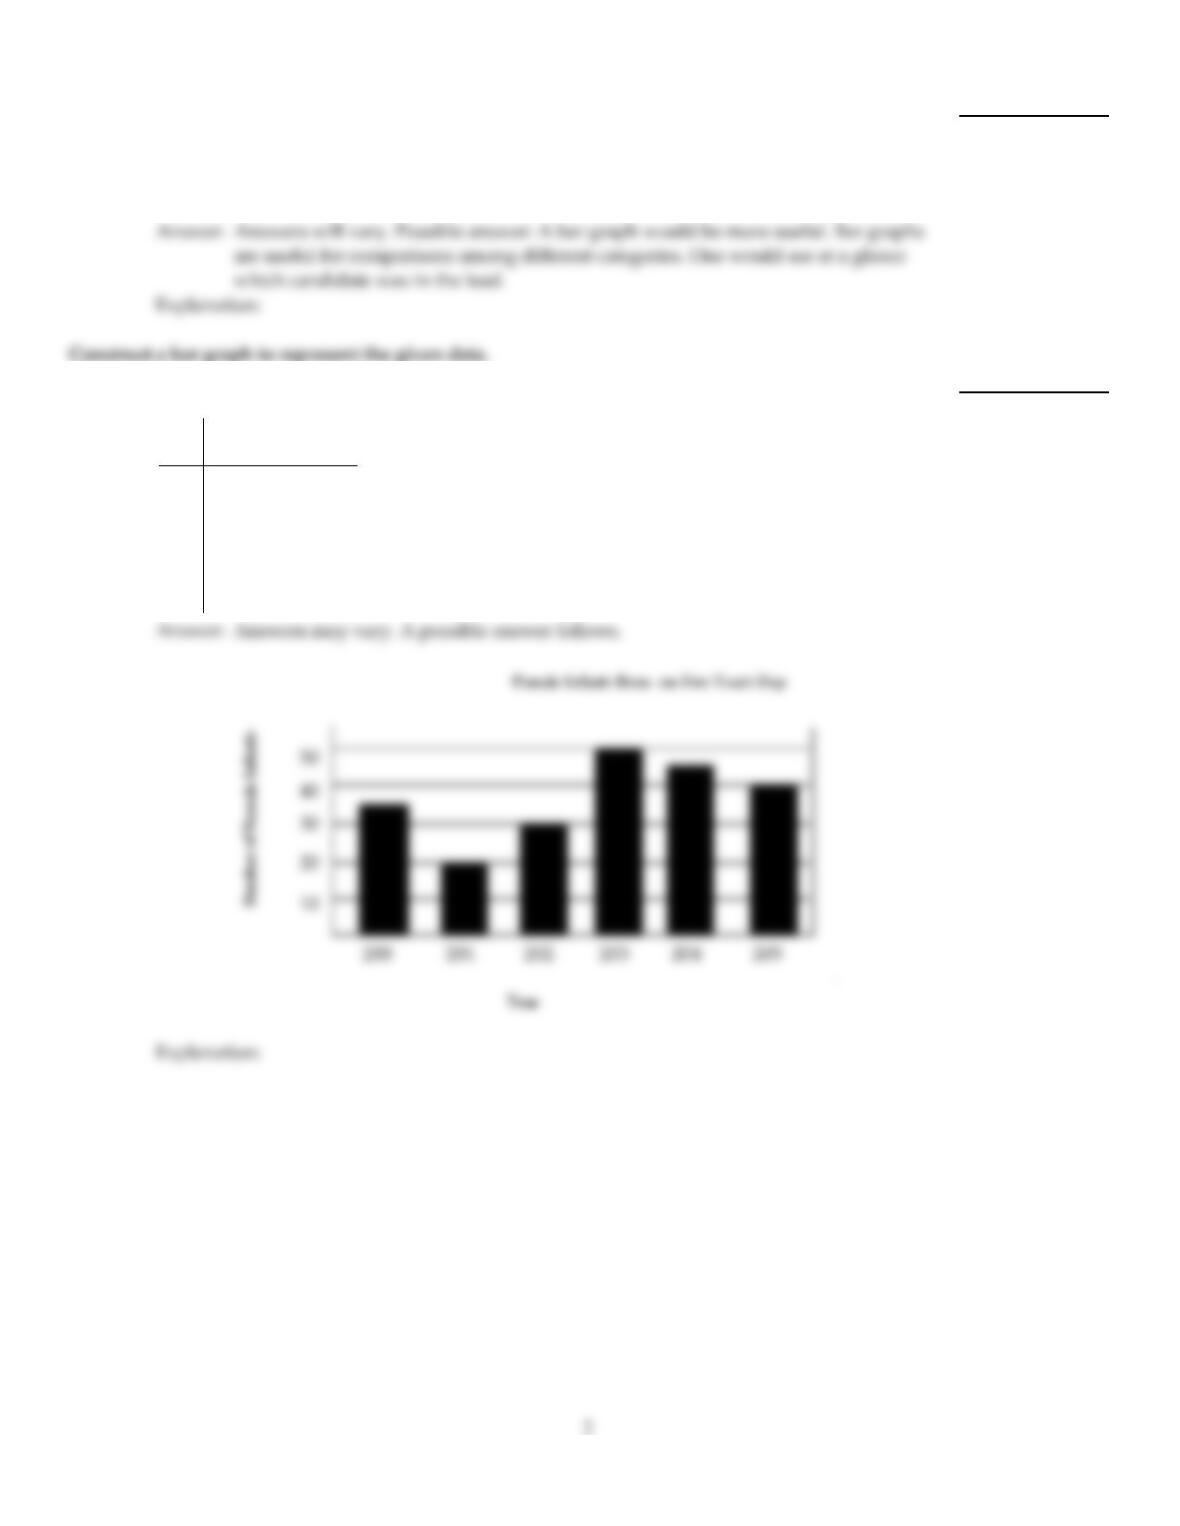
The following table shows the number of female infants born at Hospital X on New Year’s
Day (Jan. 1).
Year No. of Female
Infants Born Jan 1
200 35
201 20
202 30
203 50
204 45
205 40
4)
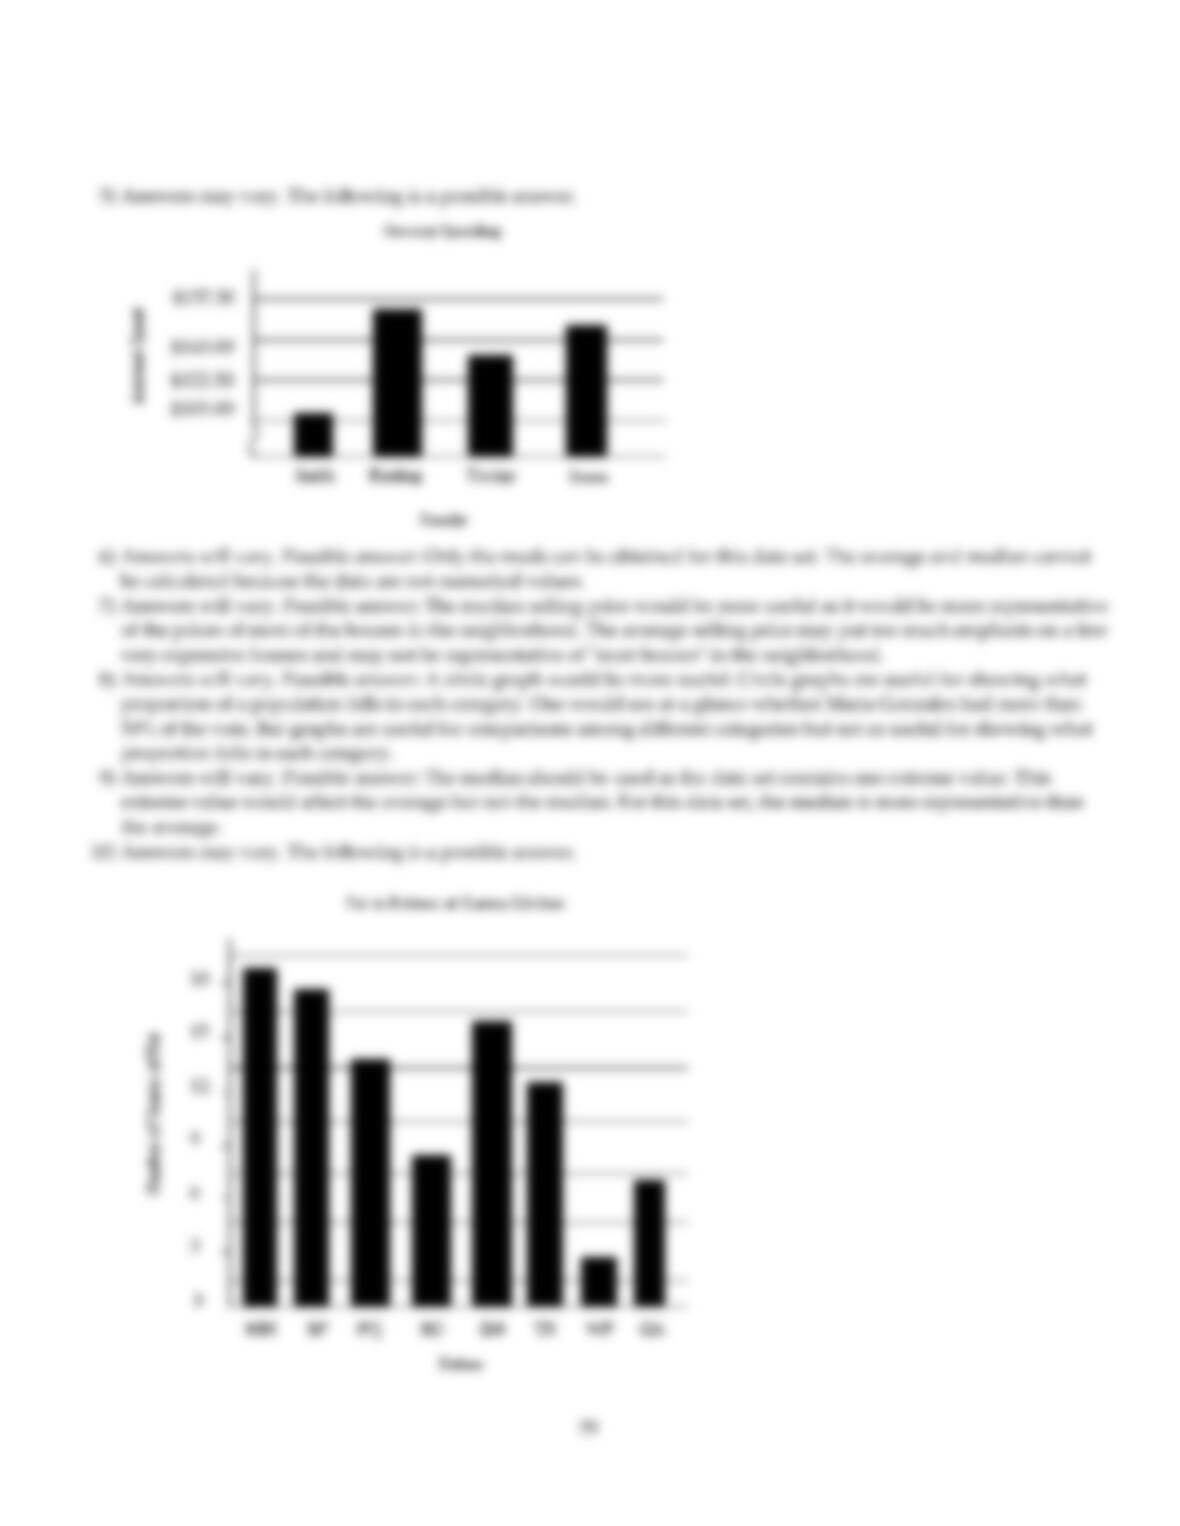
5)
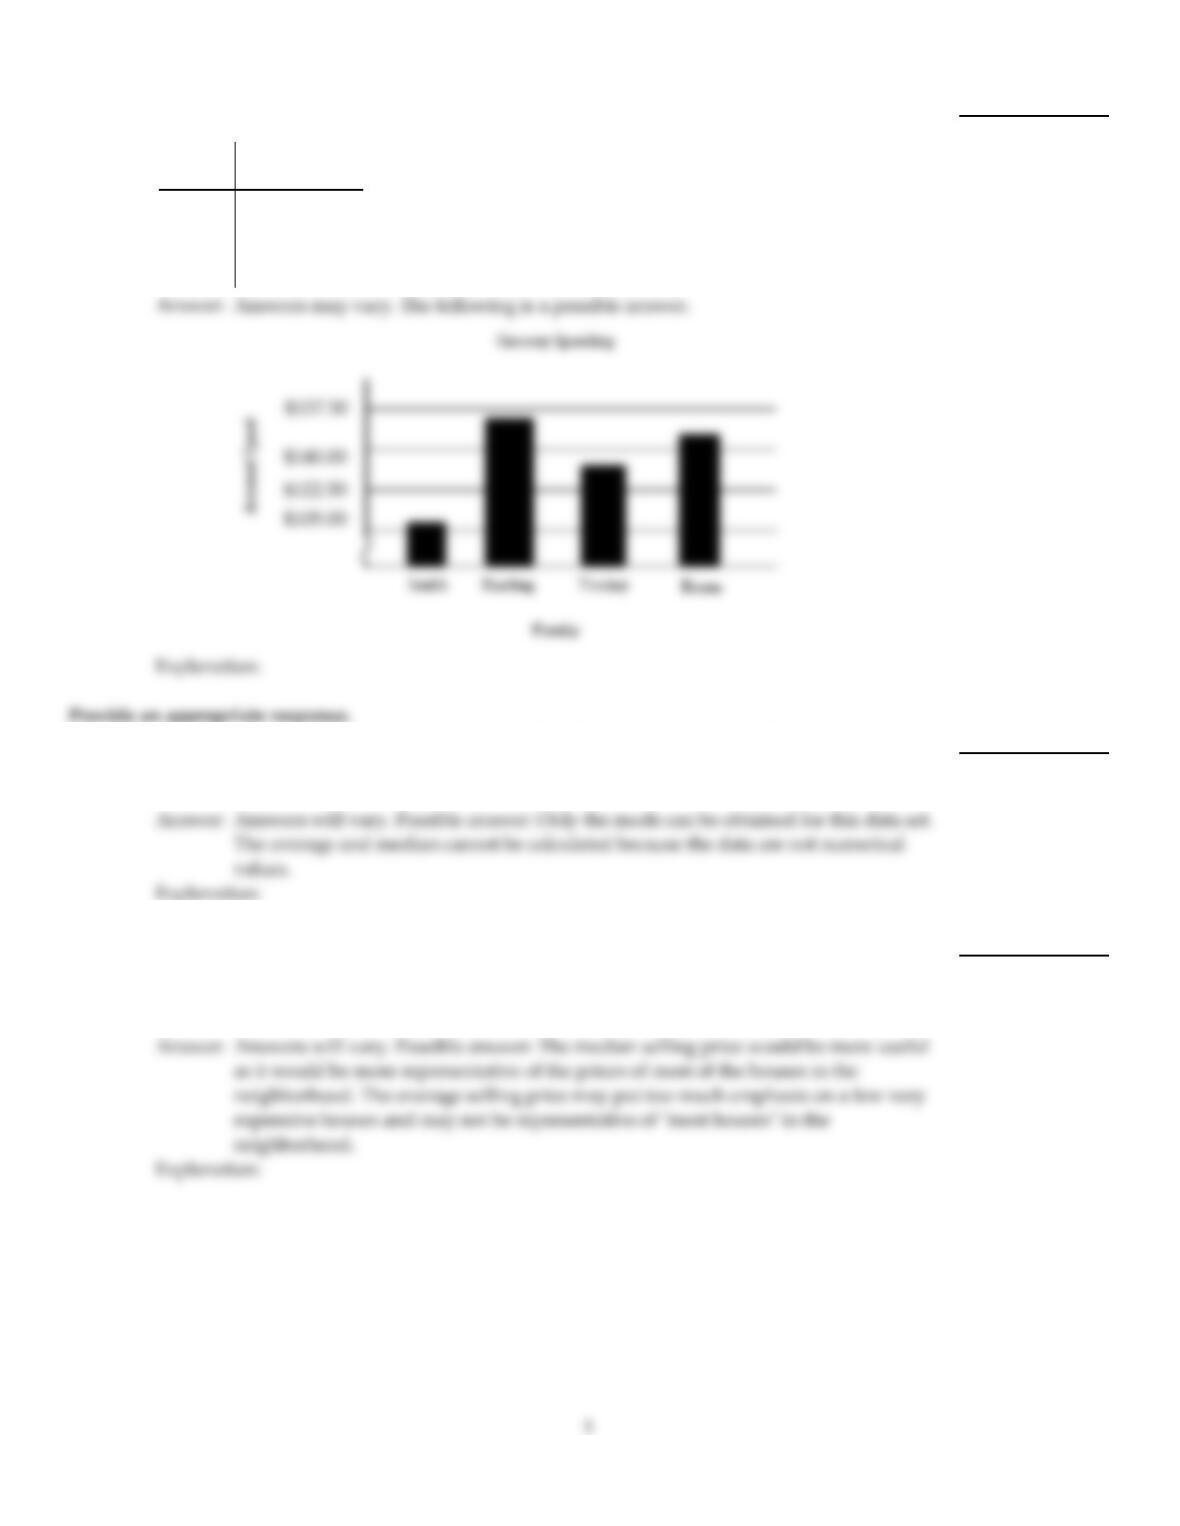
The following table shows the average amount spent per week on groceries by four
different families with three members.
Family Amount Spent
on Groceries
Smith $108.50
Harding $154.00
Tooley $129.50
Borne $147.00
5)
6)
A data set consists of the month of birth for 500 different people. Is it possible to calculate
the average for this data set? Is it possible to find the median or the mode? Explain your
answer.
6)
7)
A couple is trying to decide in which neighborhood they should buy a house that is within
their budget. Which information do you think would be more useful to them, the average
selling price or the median selling price of houses in each neighborhood? Explain your
answer.
7)
8)
Six different candidates are running for president of the board of a nonprofit organization.
By conducting a poll, you estimate the percentage of people who plan to vote for each
candidate. One candidate, Maria Gonzales, has a substantial lead. To win, a candidate
must have a simple majority (more than 50% of the vote). Suppose you wish to display the
data in a graph. From your graph, it should be easy to tell whether Maria Gonzales has
more than 50% of the vote. Which graph would be more useful, a bar graph or a circle
graph? Explain your answer.
8)
9)
The monthly salaries at one company are $1900, $1900, $2050, $2200, $2400, $2400, $2500,
$2550, $2660, $2700, $2900, $3100, $3300, $3300, $3350, $3500, $3900, $4100, $8000.
If you didn’t want to place too much emphasis on the one extremely high salary, should
you use the average or the median to describe the data? Explain your answer.
9)
Construct a bar graph to represent the given data.
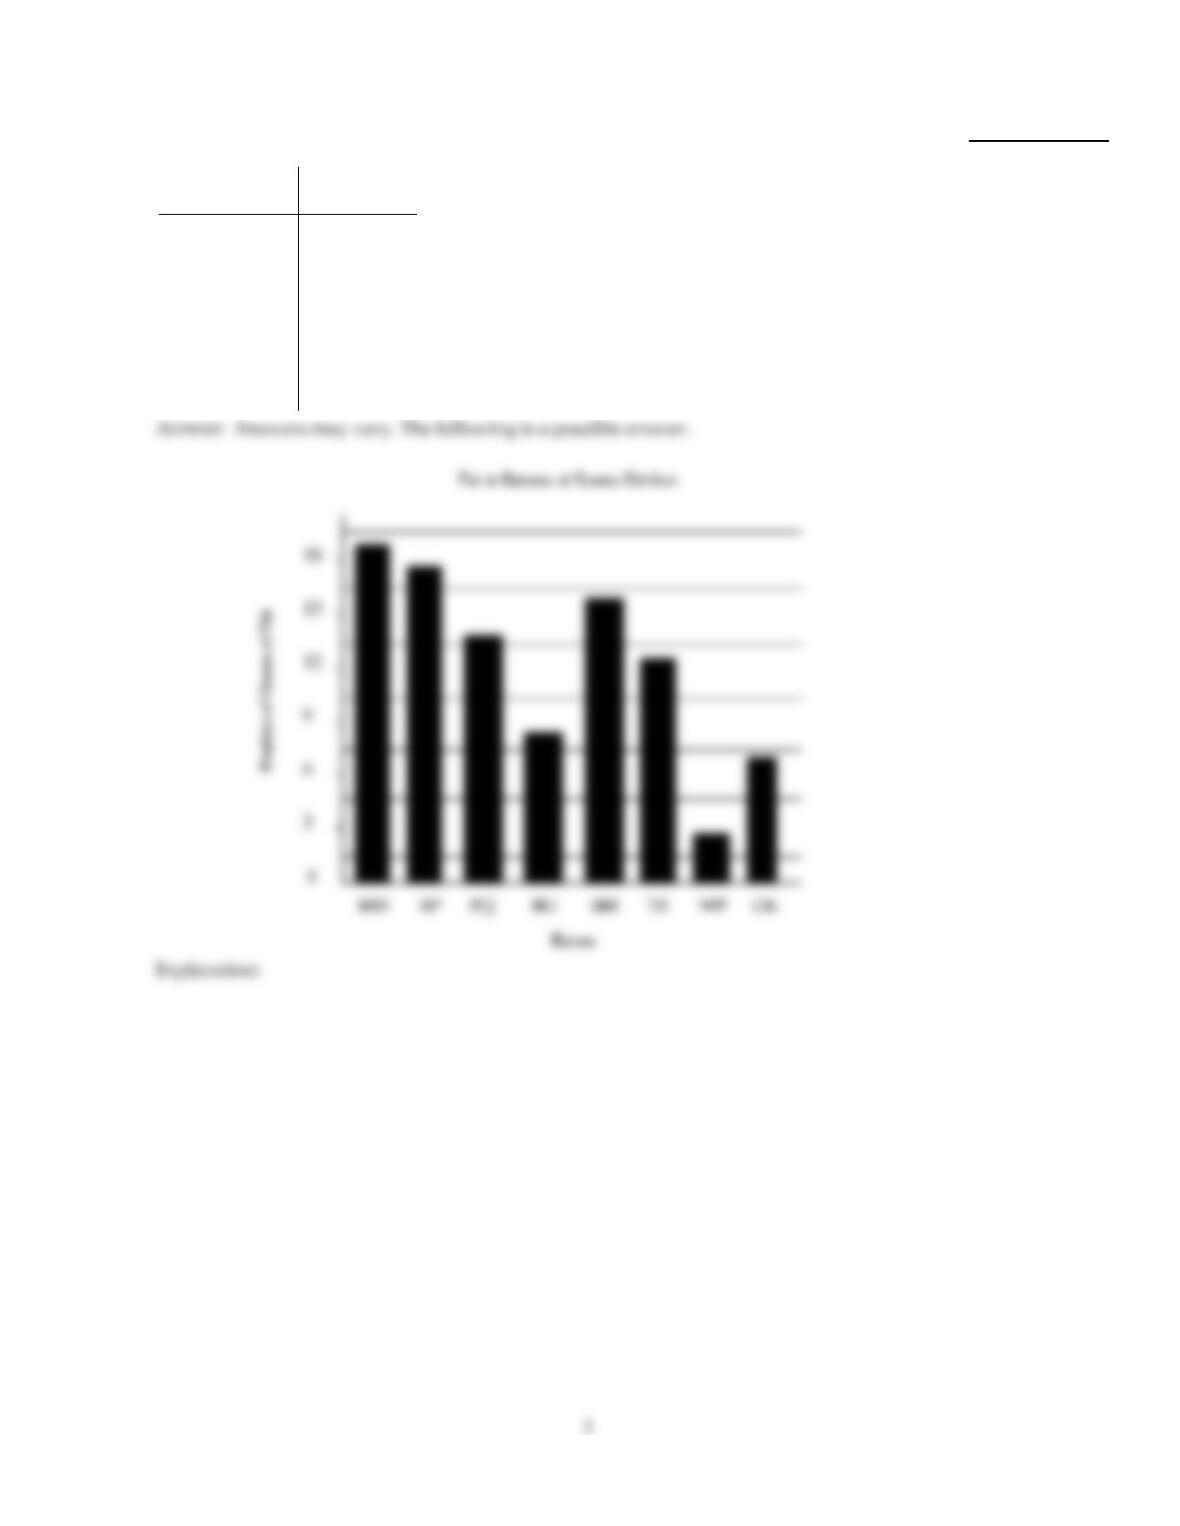
10)
The following table shows the average number of grams of fat in various kinds of entrees
served at Karma Kitchen.
Meal No. of Grams
of Fat
Mash Hash 20.1
Barnyard Plate 19.2
Peas & Q’s 15.3
Bean O’Rama 9.6
Swiss Misty 17.7
Top Roundup 14.1
Wellness Platter 3.6
Good Karma 8.7
10)
Make a line graph of the data in the table.
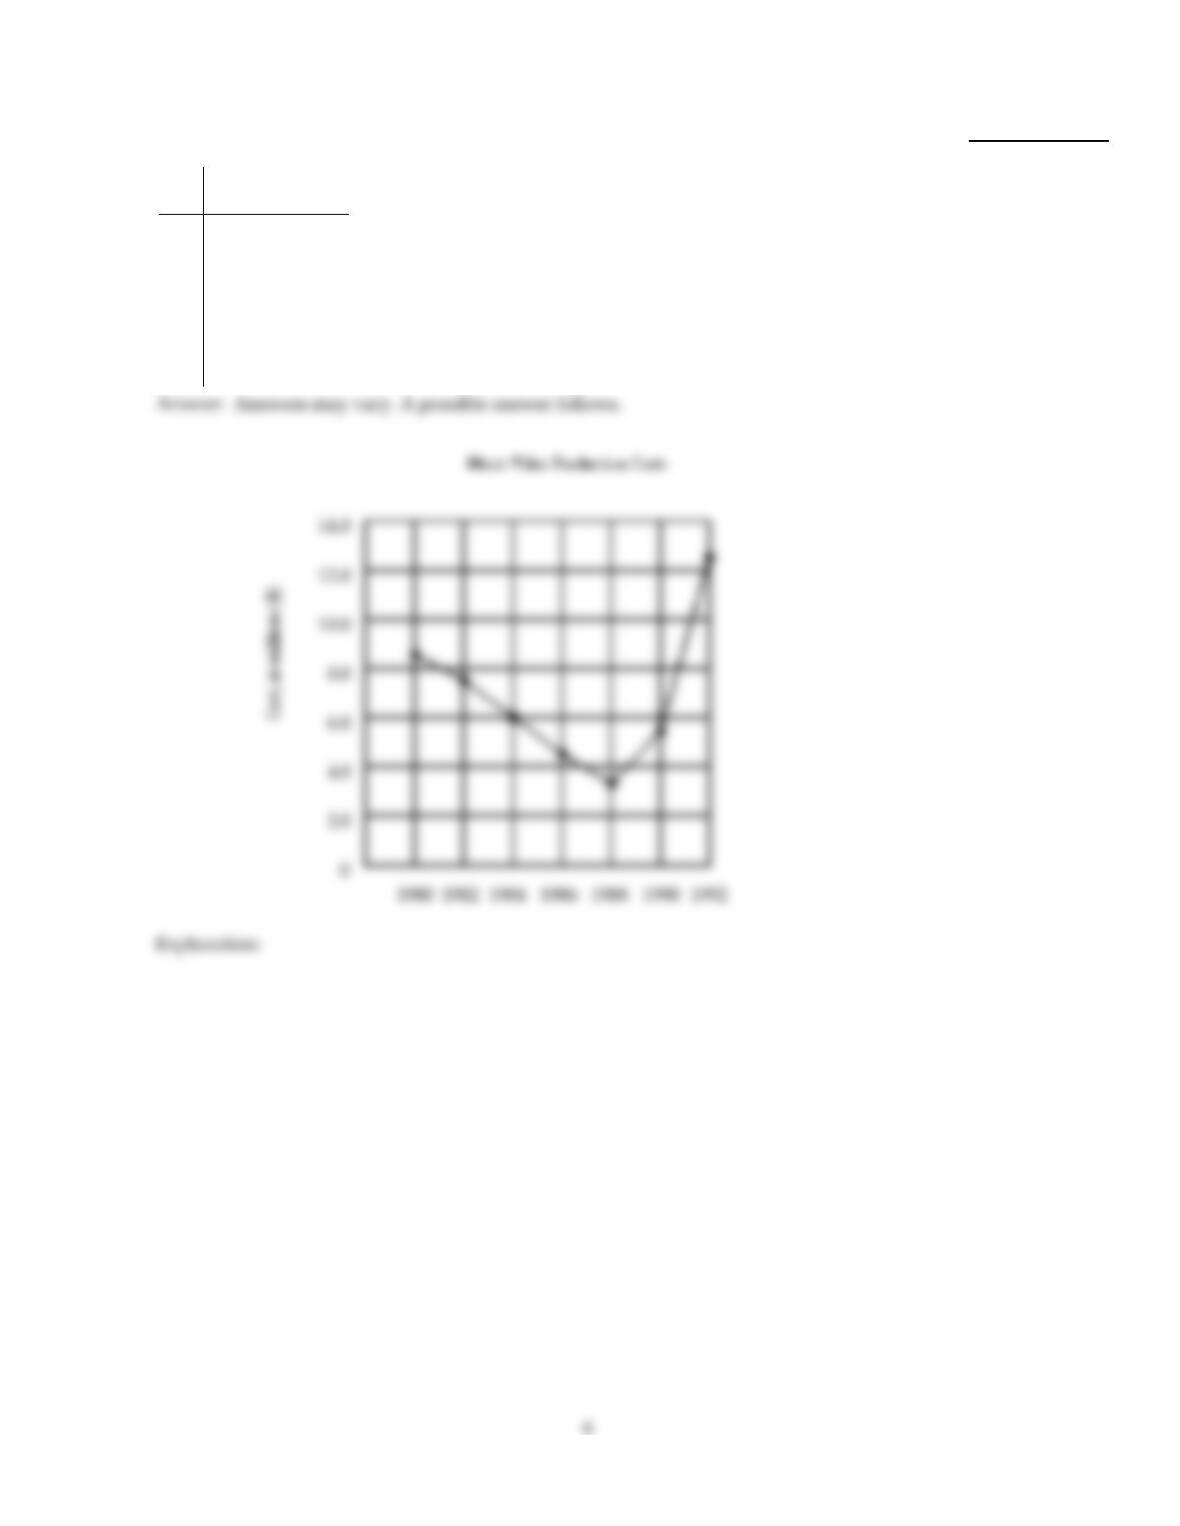
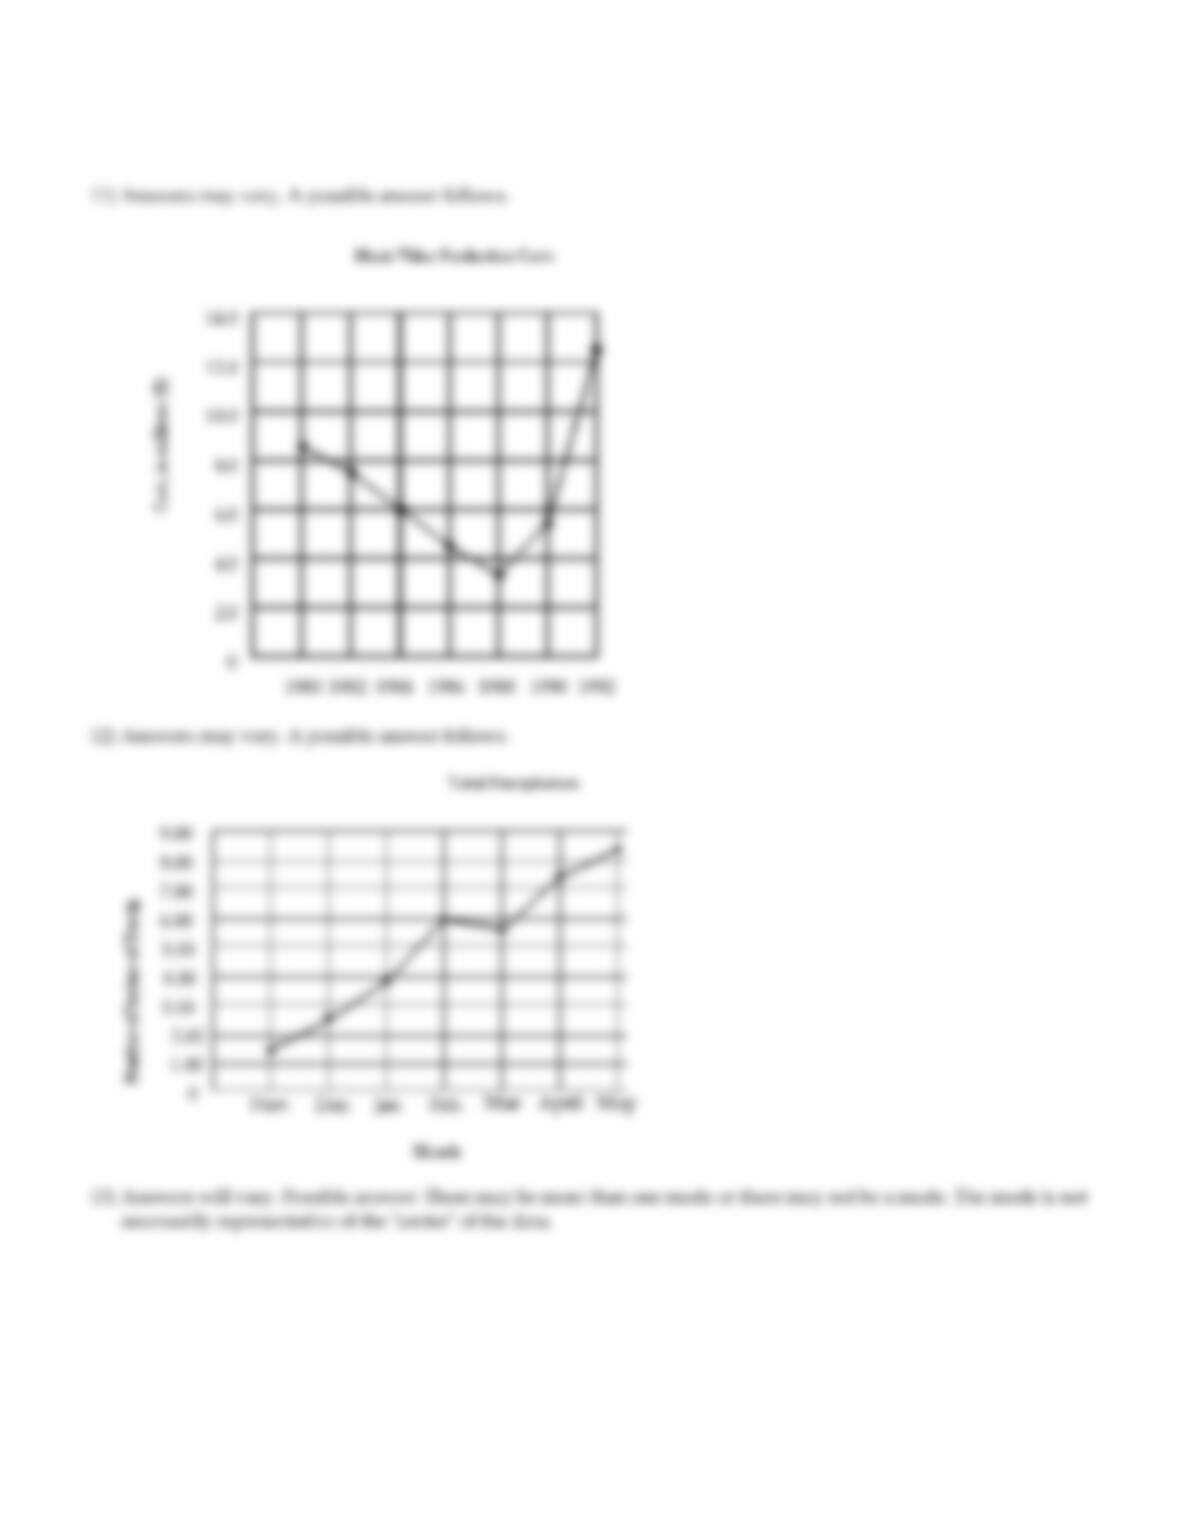
11)
The following table gives the average cost of producing a music video over the given years.
Use time on the horizontal scale for your line graph.
Year Production Cost,
in millions
1980 $8.4
1982 7.6
1984 6.0
1986 4.4
1988 3.2
1990 5.6
1992 12.4
11)
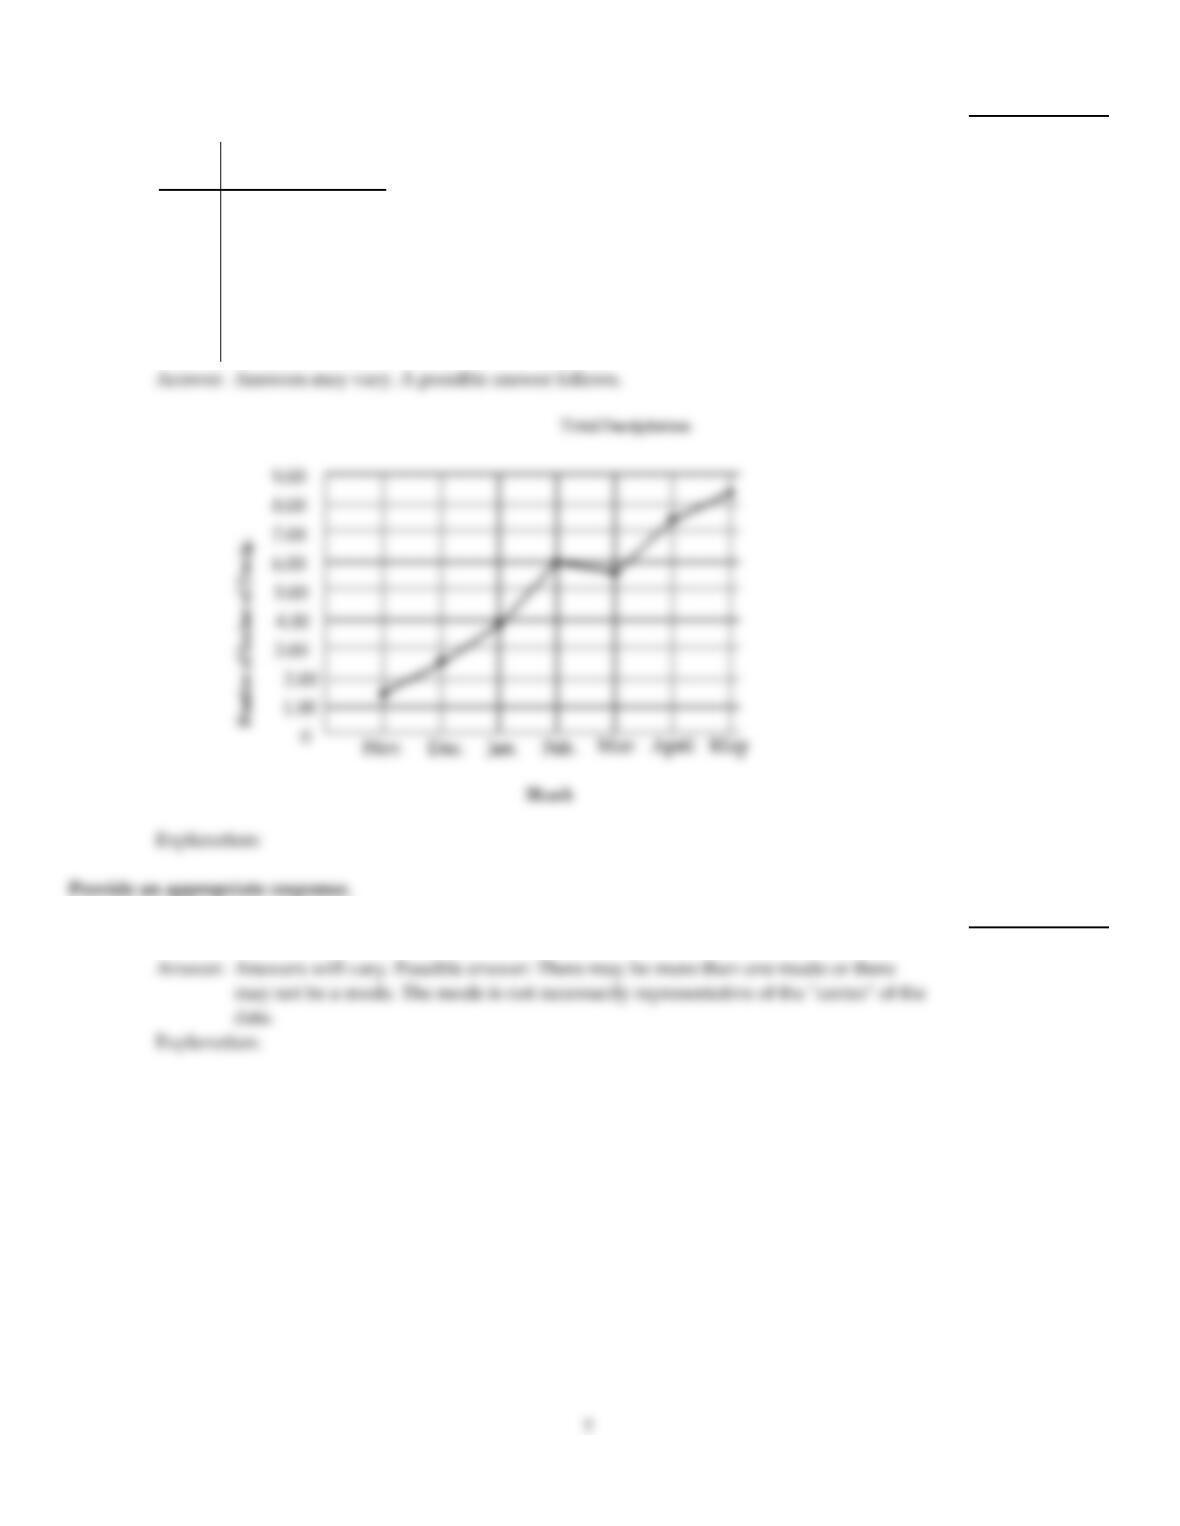
12)
The following table gives the total amount of precipitation during the given months. Use
time on the horizontal scale for your line graph.
Month Total Precipitation,
in Inches
Nov. 1.52
Dec. 2.72
Jan. 3.76
Feb. 6.04
Mar. 5.56
April 7.44
May 8.28
12)
13)
Why do you think that the mode is not used as often as the average and median to describe
data sets?
13)
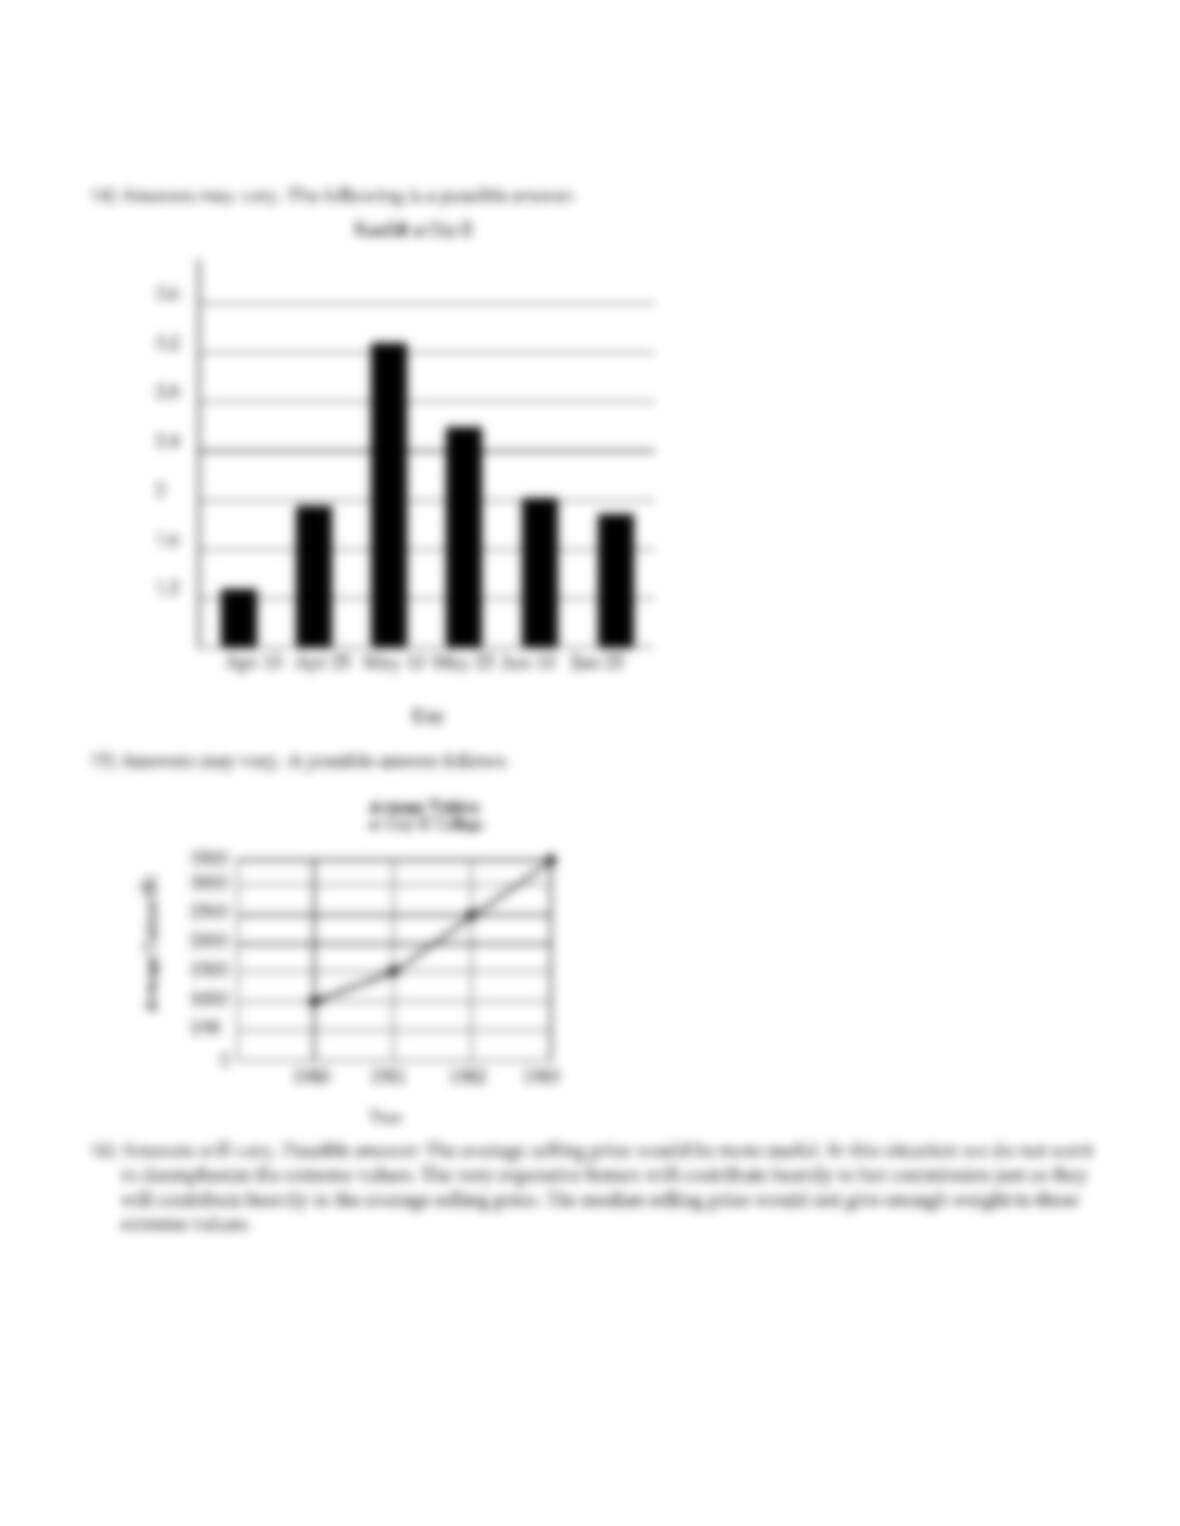
Construct a bar graph to represent the given data.
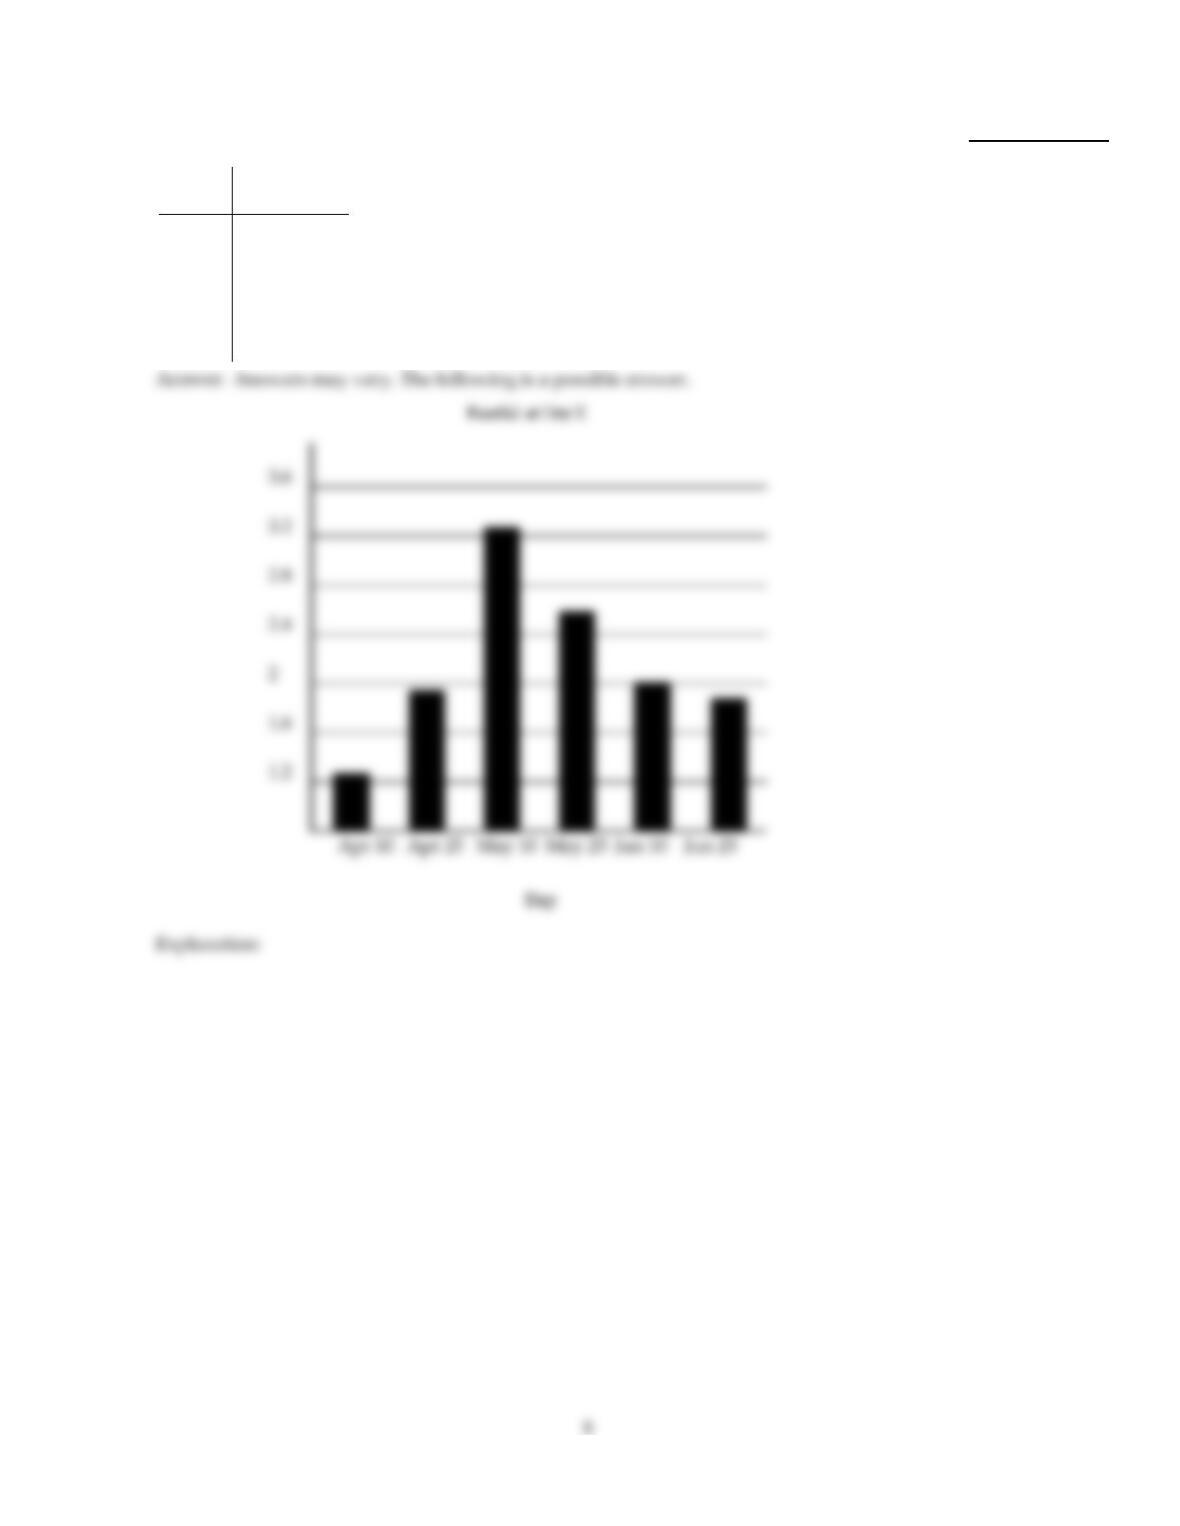
14)
The following table shows the number of inches of rainfall measured at City X during the
following days.
Day No. of Inches
of Rainfall
April 10 1.26
April 25 1.94
May 10 3.26
May 25 2.54
June 10 2.02
June 25 1.86
14)
Make a line graph of the data in the table.
15)
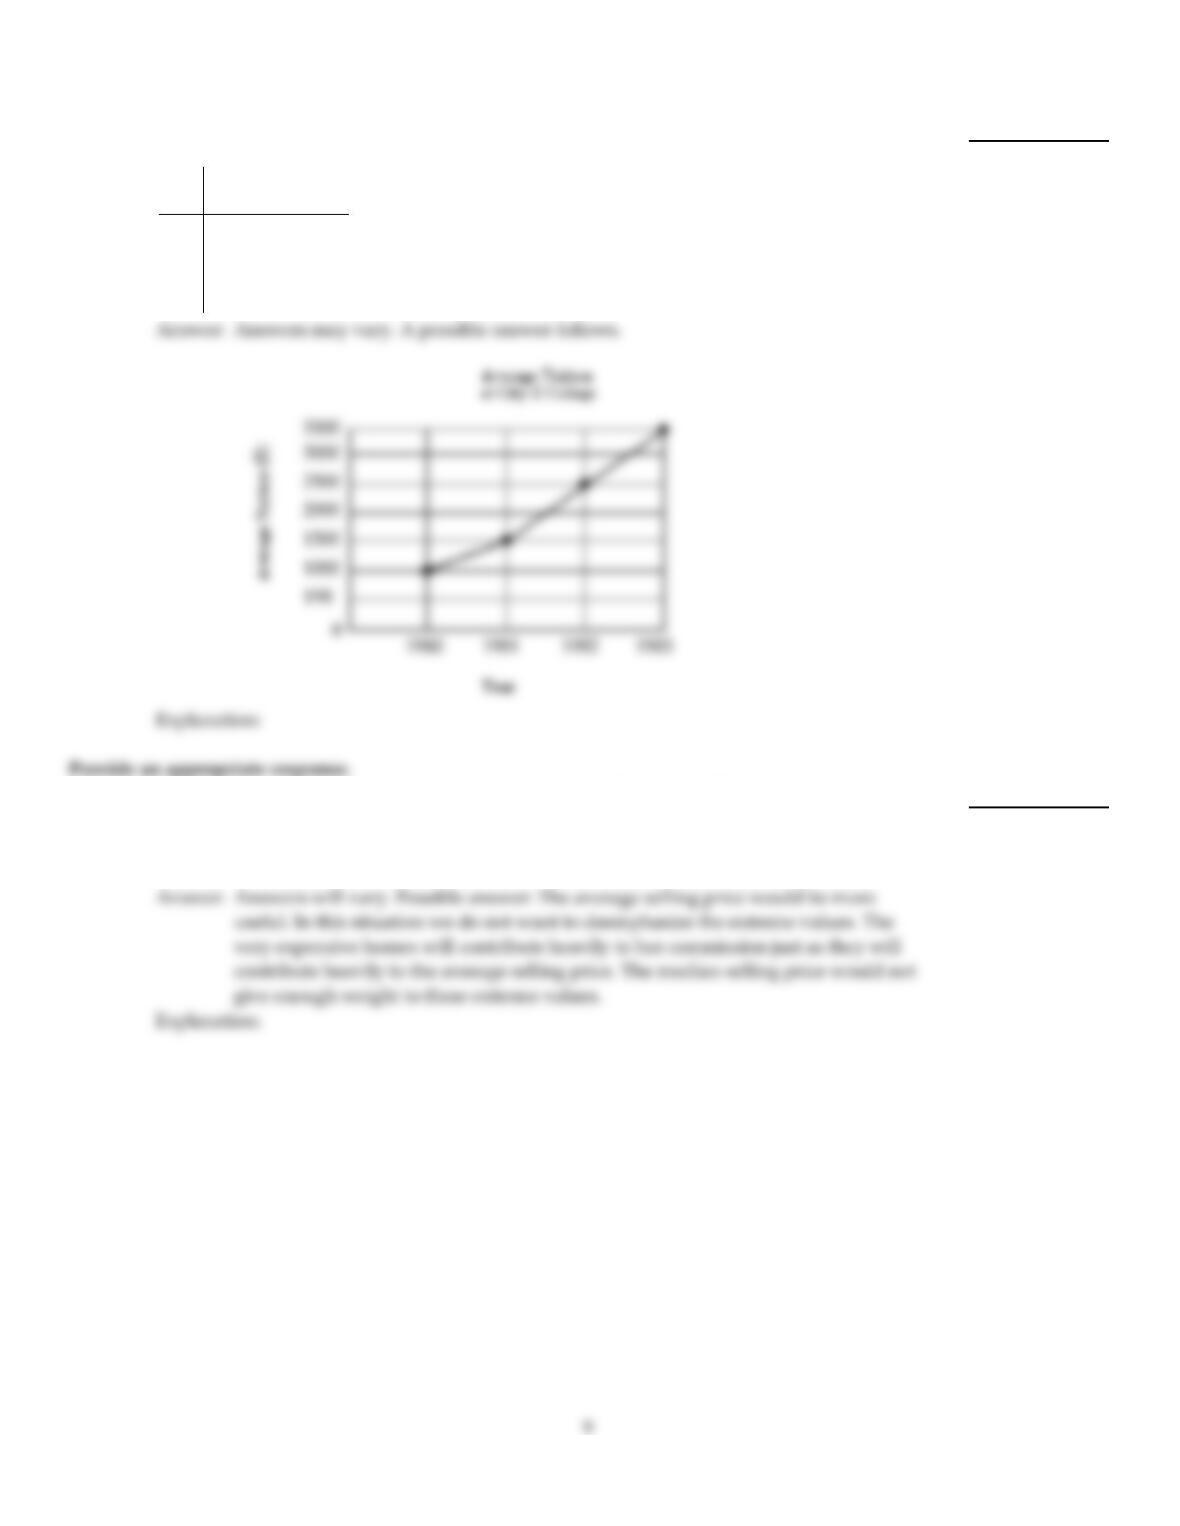
The following table shows the average tuition for one semester at City X College over
various years. Use time on the horizontal scale for your line graph.
Year Average College
Tuition
1980 $1000
1981 1500
1982 2500
1983 3500
15)
16)
A real estate agent earns a commission each time she sells a house. The commission is a
certain percentage of the selling price. If she wants to estimate the commission she will
make, which information do you think would be more useful to her, the average selling
price or the median selling price of houses in her area? Explain your answer.
16)
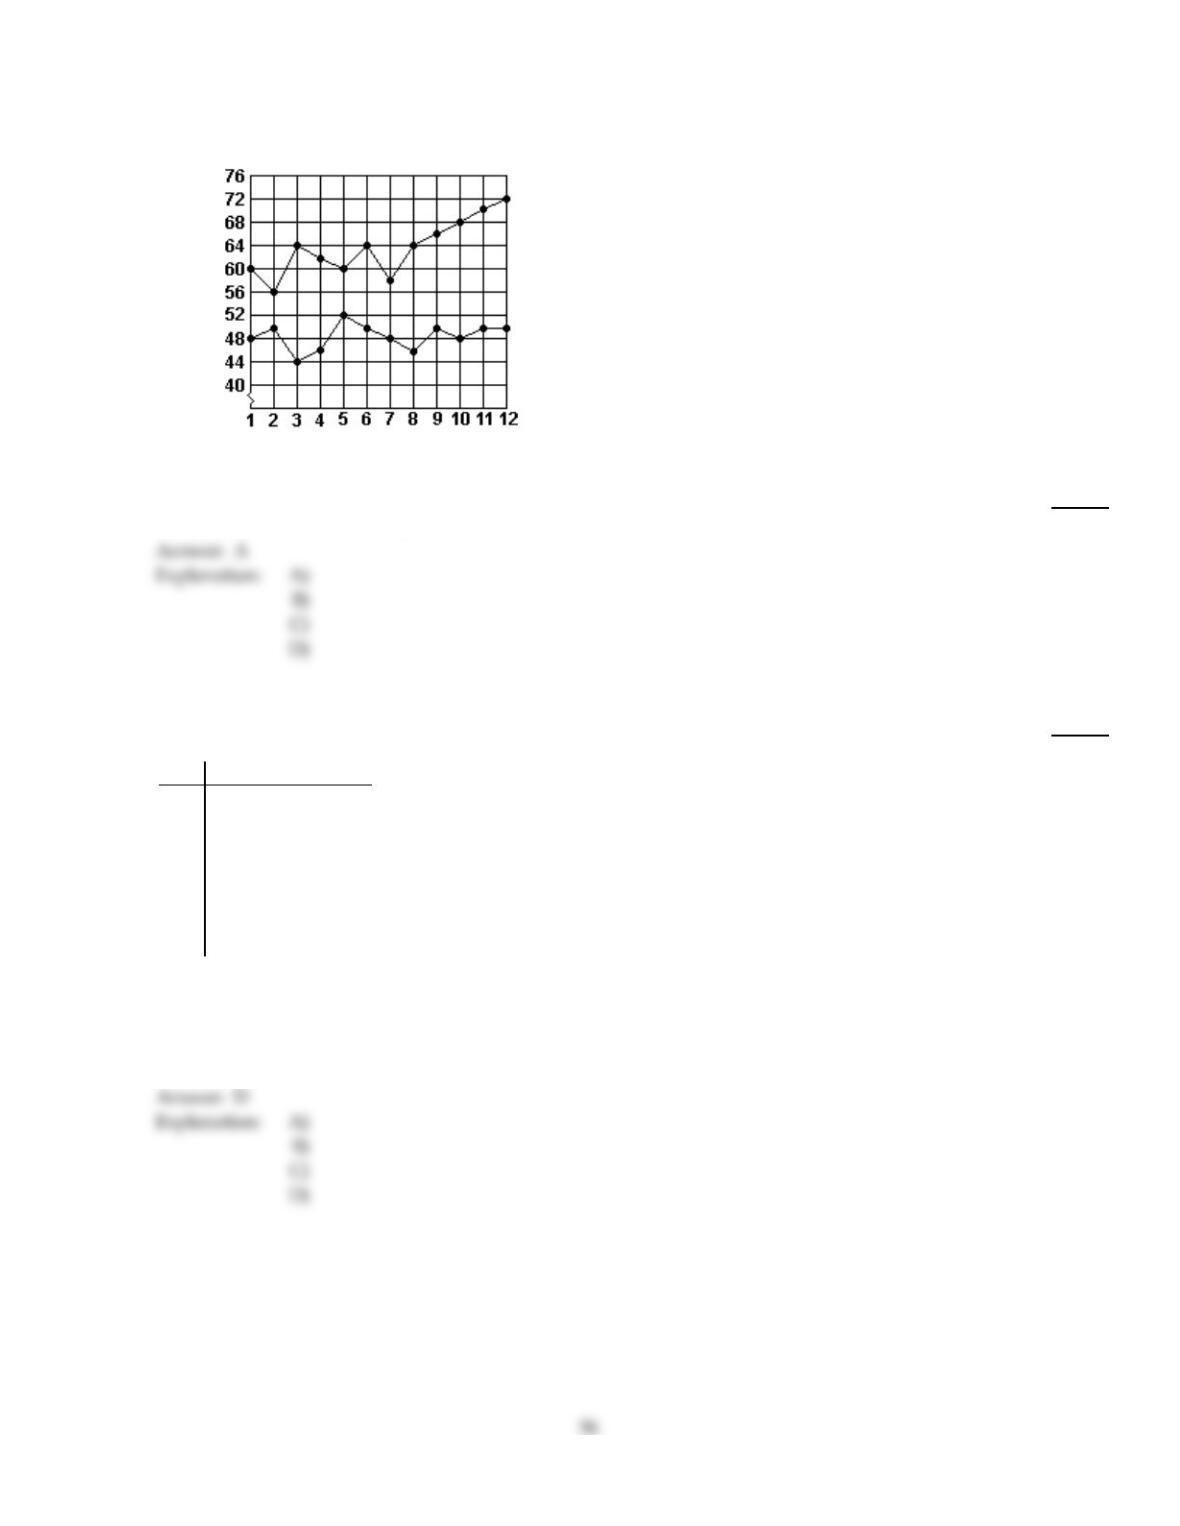
Make a line graph of the data in the table.
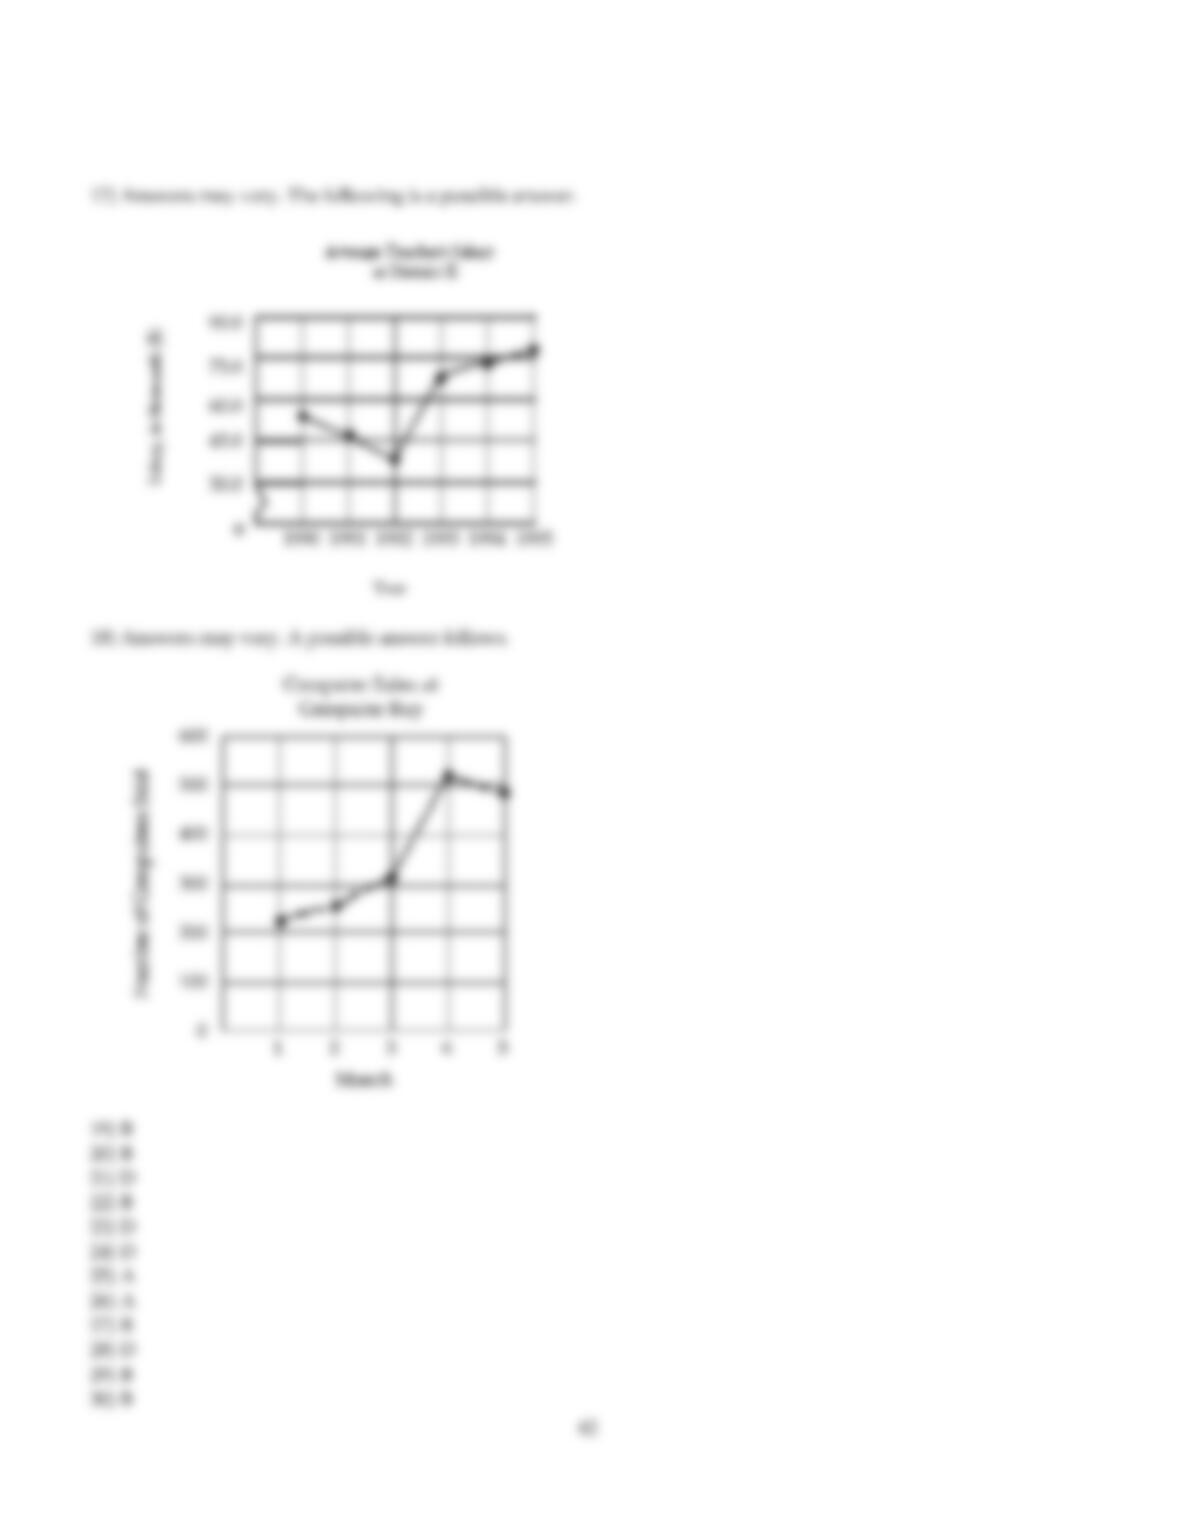
17)
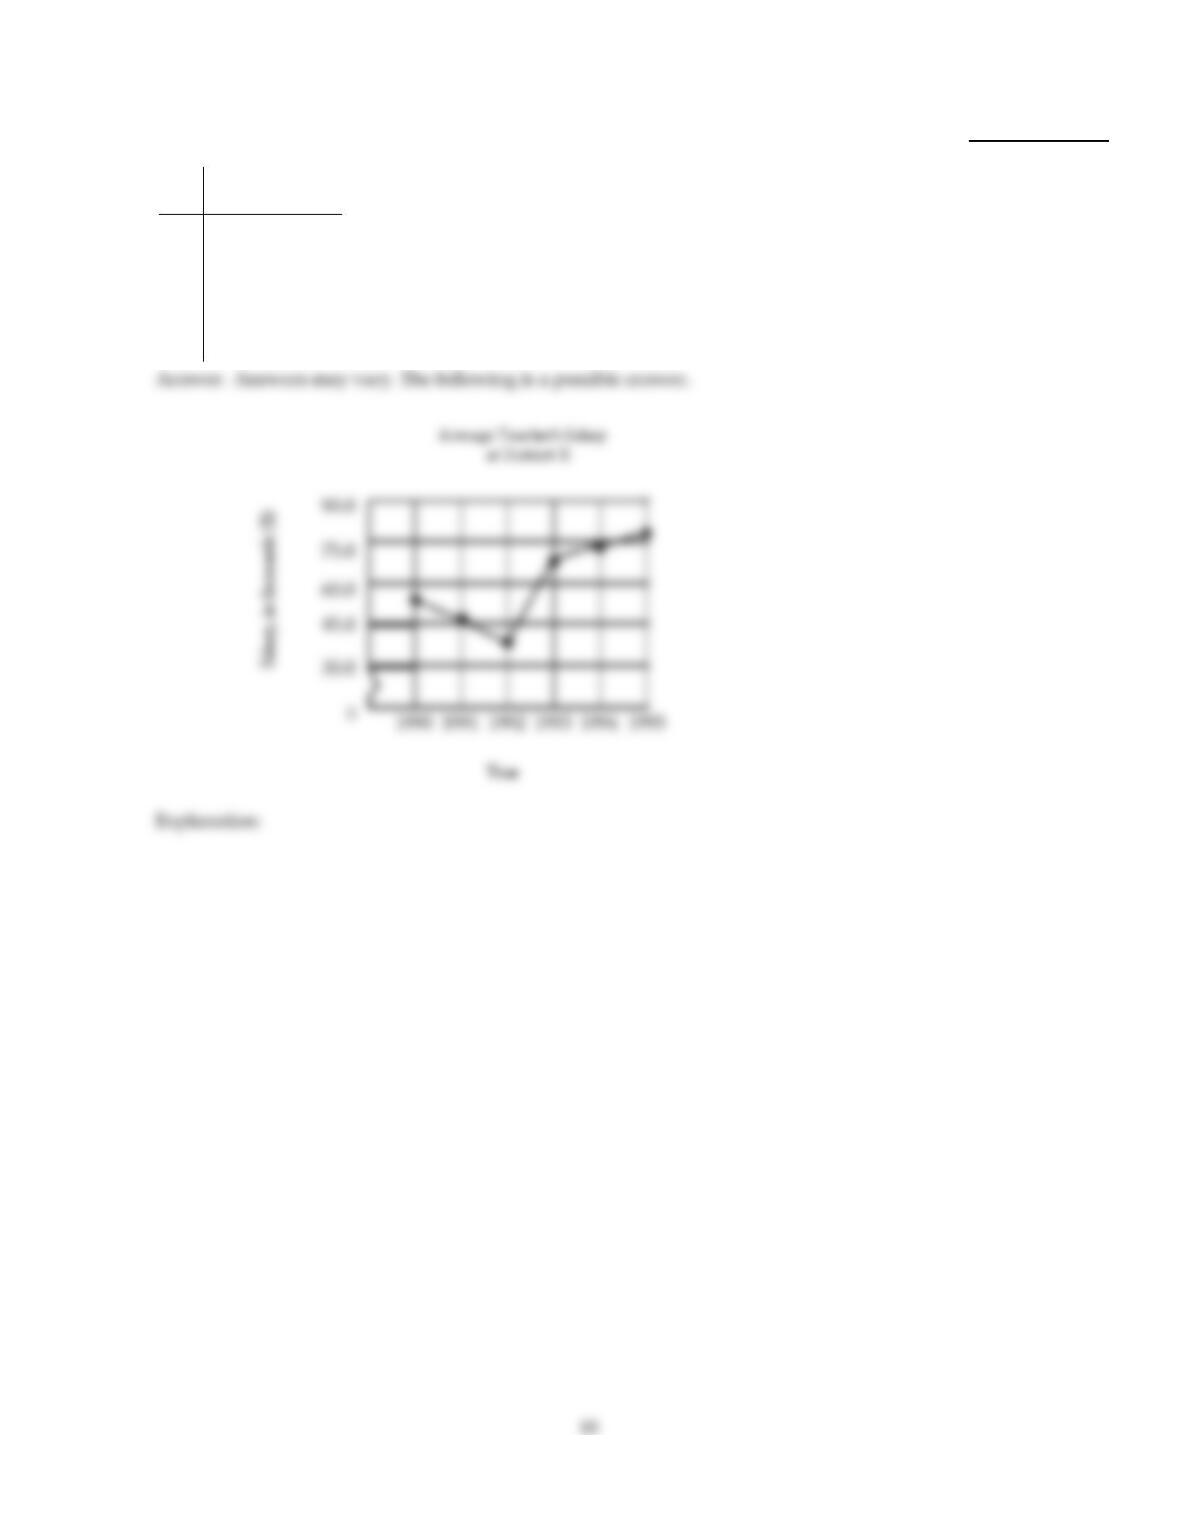
The following table shows the median teacher’s salary in District X over several years. Use
time on the horizontal scale for your line graph.
Year Average Salary,
in thousands
1990 $53.3
1991 46.5
1992 42.0
1993 69.0
1994 72.8
1995 80.3
17)
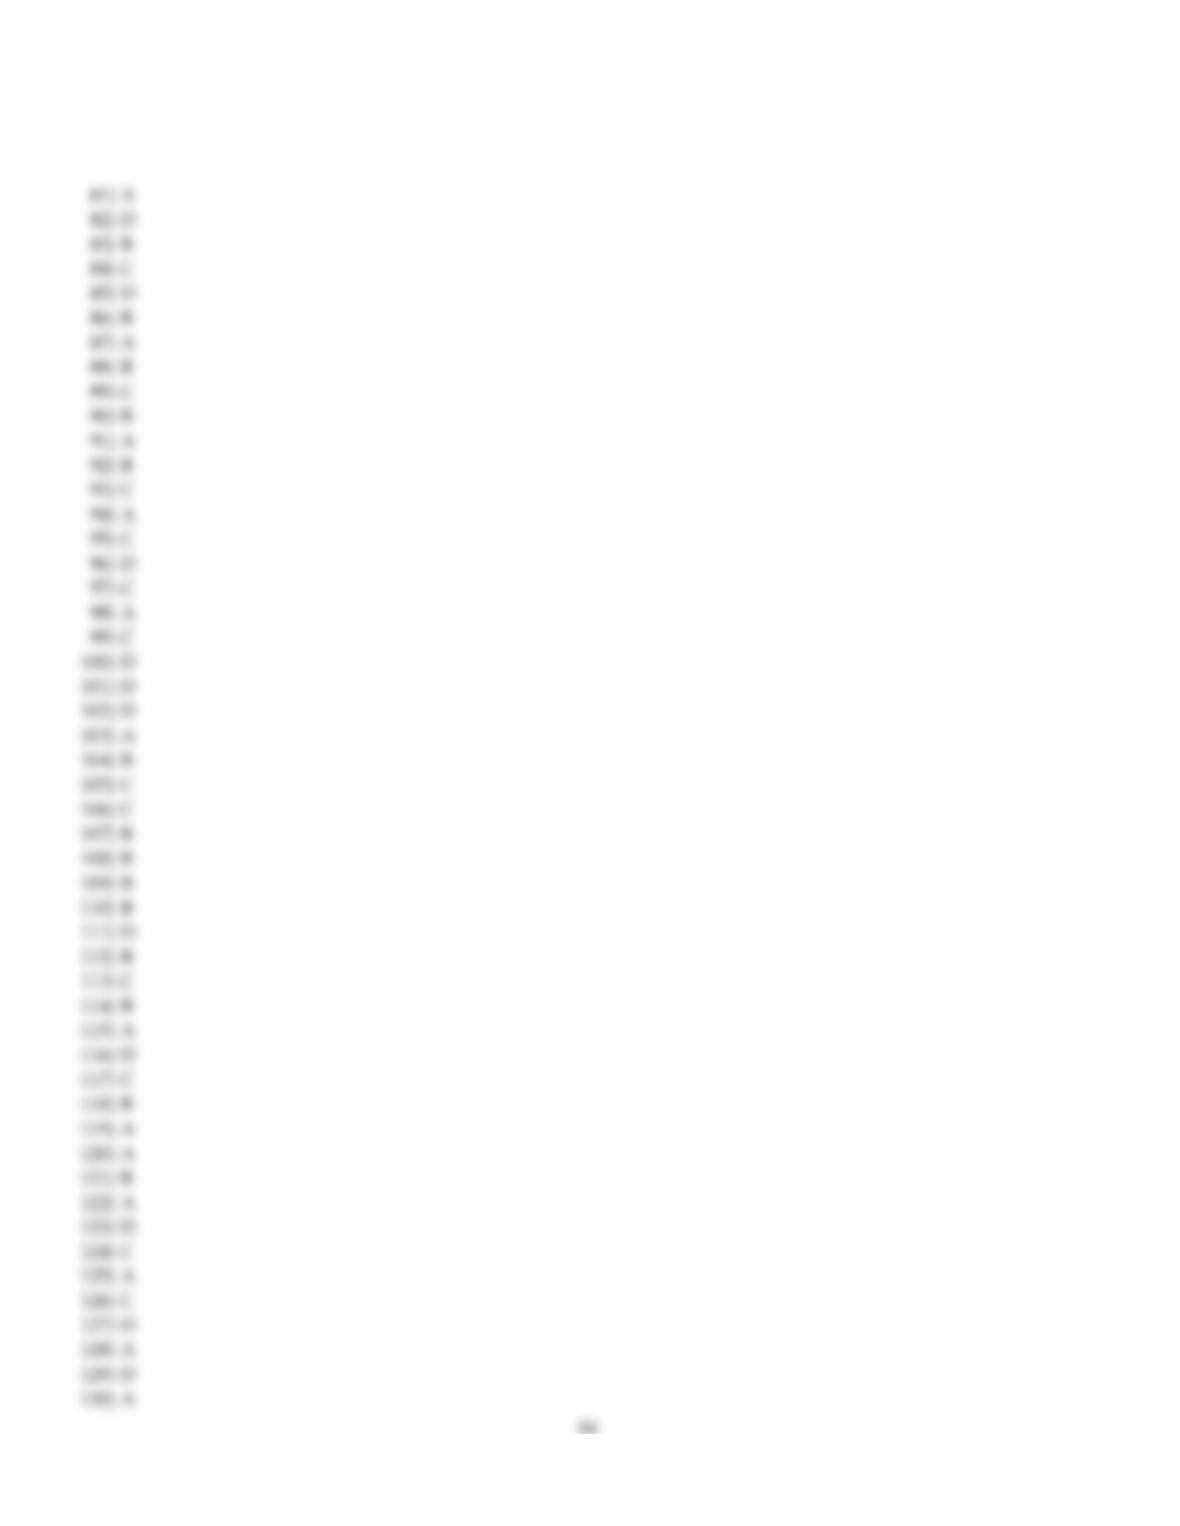
18)
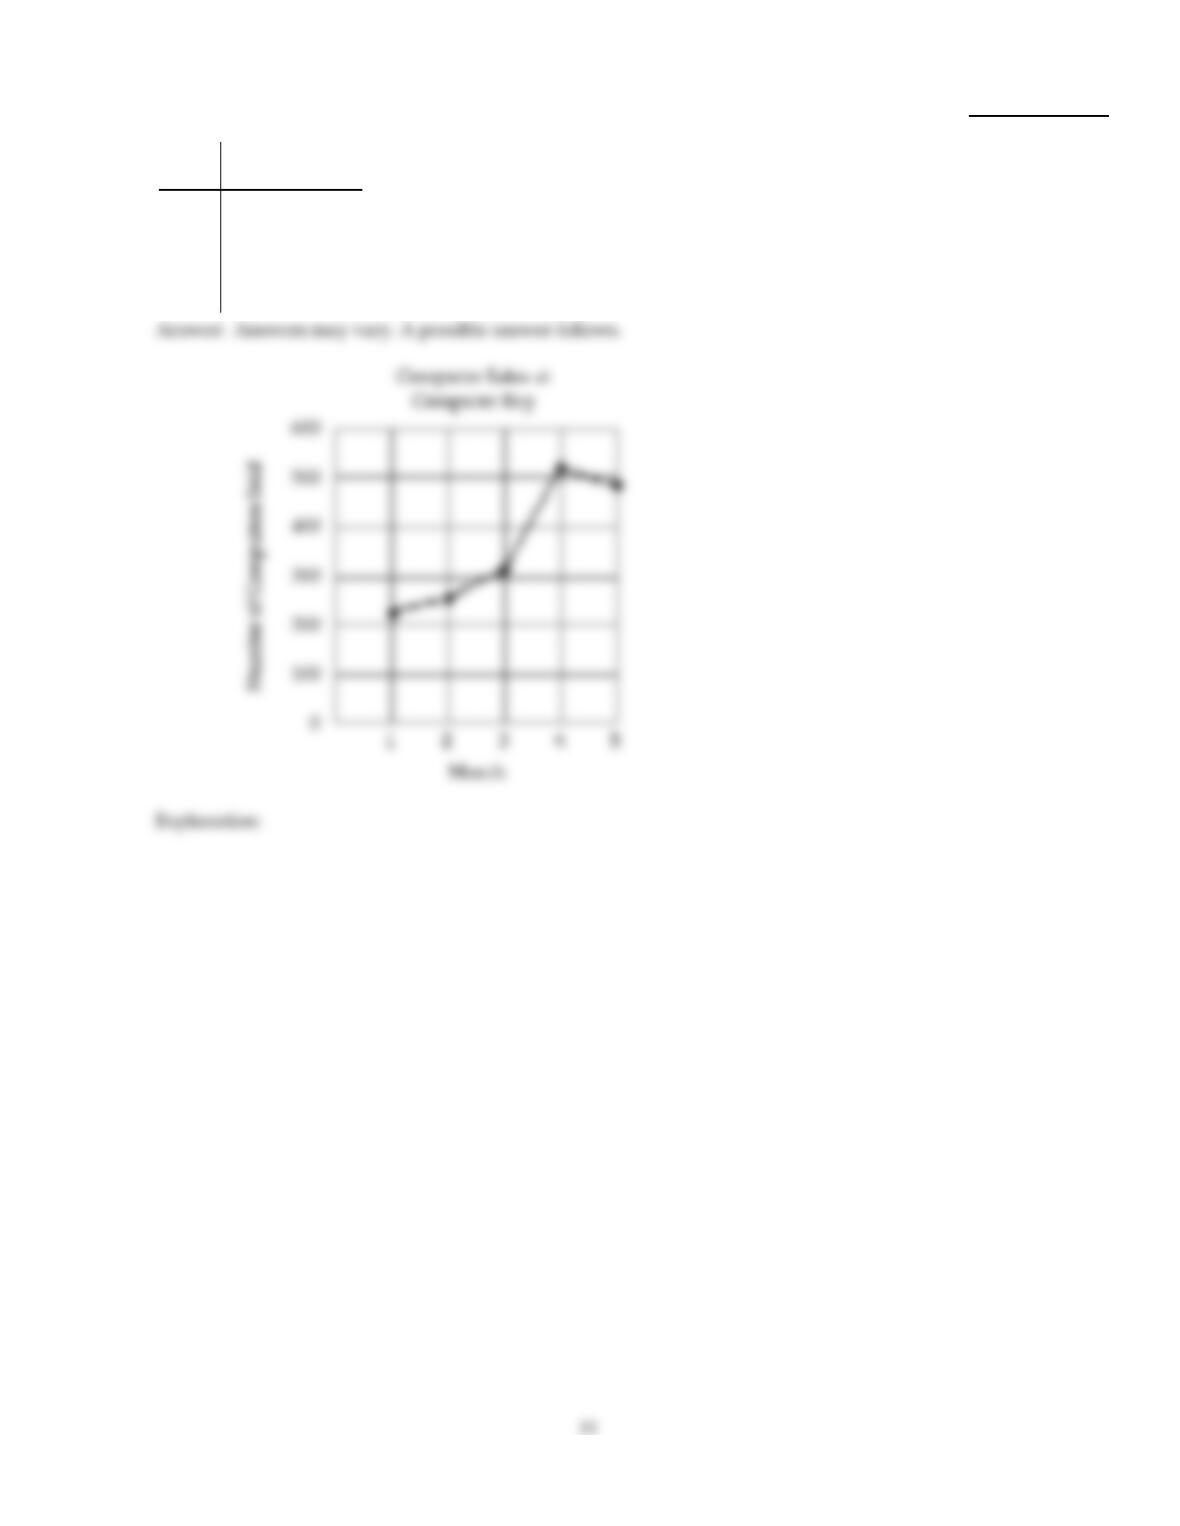
The following table shows the number of computer sales made at Computer Buy over five
months. Use time on the horizontal scale for your line graph.
Month Number of
Computers Sold
1213
2256
3311
4527
5489
18)
MULTIPLE CHOICE. Choose the one alternative that best completes the statement or answers the question.
Use the circle graph to solve the problem.
19)
The circle graph below gives the inventory of the men‘s department of a store.
Suits
$32,538 Trousers
$28,710
Underwear Shirts
$4466 $7656
Sweaters Socks
$12,122 Ties $2552
$6380
What is the total inventory?
19)
A)
$65,714
B)
$94,424
C)
$96,976
D)
$91,872
20)
9, 2, 25, 16, 26, 42, 37, 34
20)
A)
23.5
B)
25.5
C)
26
D)
25
21)
Moon Average Distance
from Geo I (km) Diameter (km) Time of Revolution
(in Earth time, years)
Luna 1 2000 418 0.50
Luna 2 2600 2163 1.54
Luna 3 80,000 303 2.72
Luna 4 115,200 721 38.96
Luna 5 264,000 1139 100.32
What is the average of the diameters of the moons?
21)
A)
512 km
B)
721 km
C)
303 km
D)
949 km
Find the median for the set of numbers.
22)
$30.85, $46.59, $34.56, $40.64, $36.06, $39.49
22)
A)
$36.06
B)
$37.78
C)
$39.49
D)
$38.03
23)
The Math Club kept track of the number of customers visiting the concession stand during the first
quarter of each home basketball game: 47, 23, 4, 4, 26, 14, 28, 31, 33, 32. Find the median number of
customers.
23)
A)
24 customers
B)
26 customers
C)
28 customers
D)
27 customers
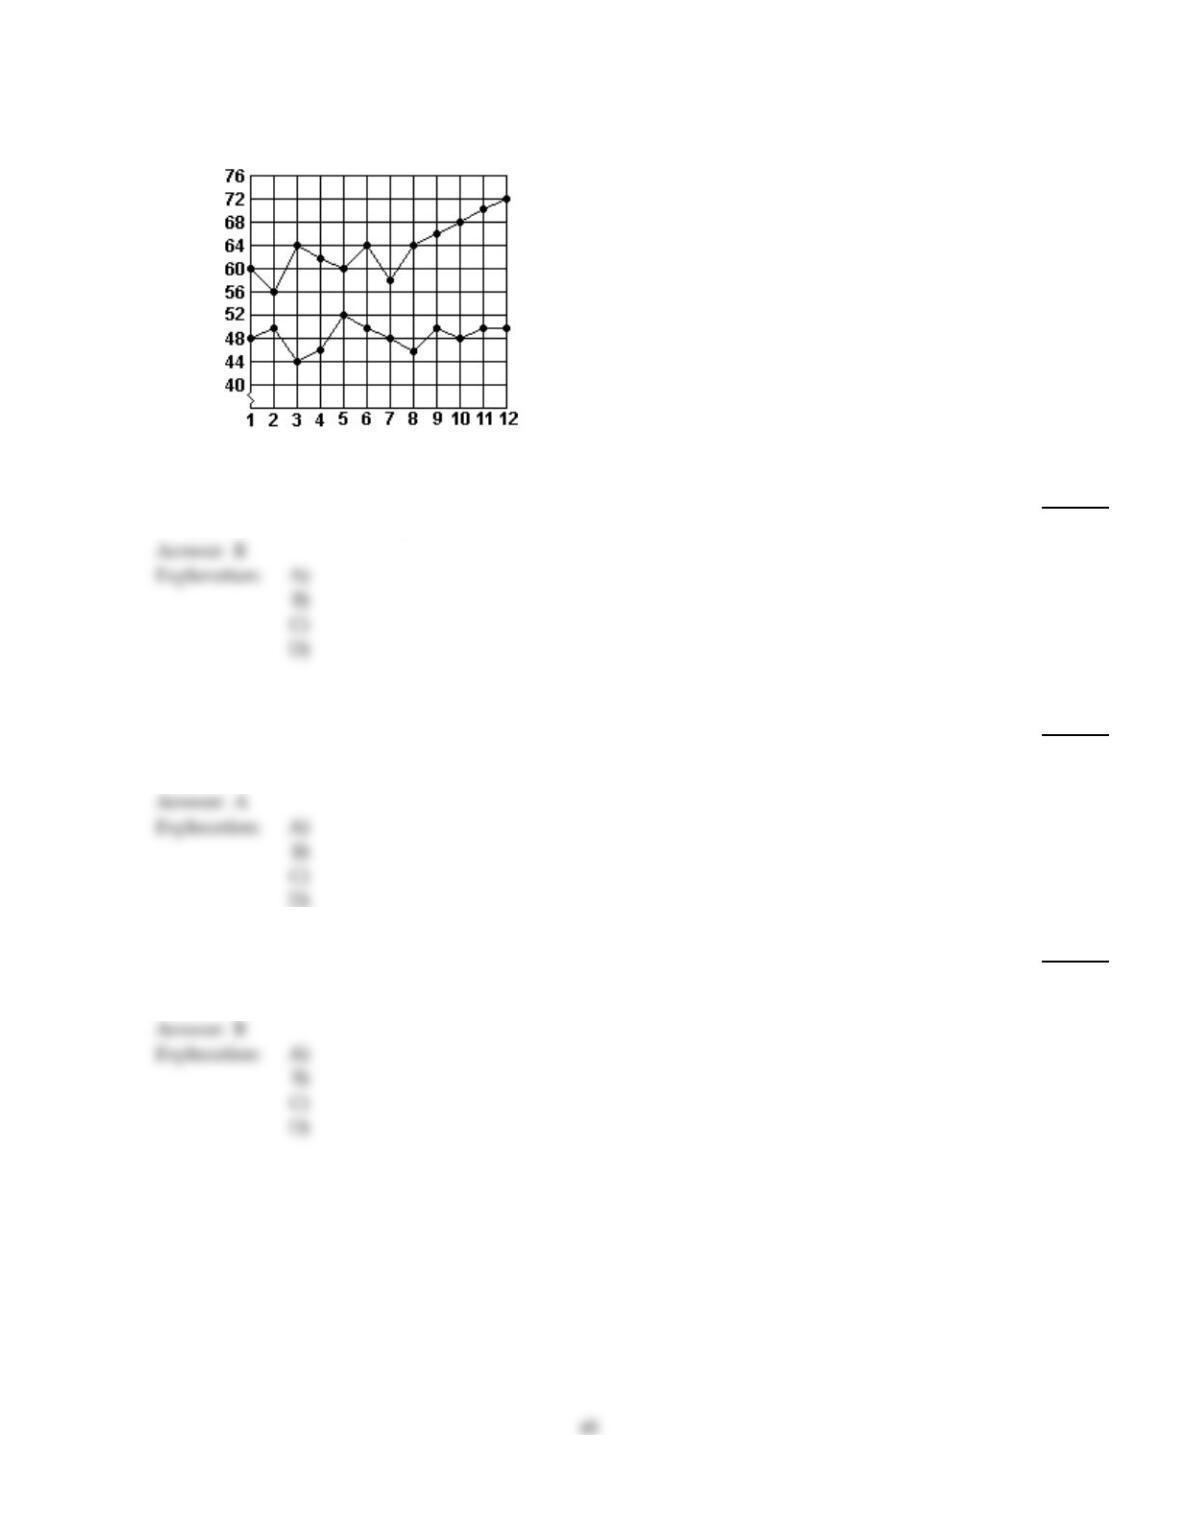
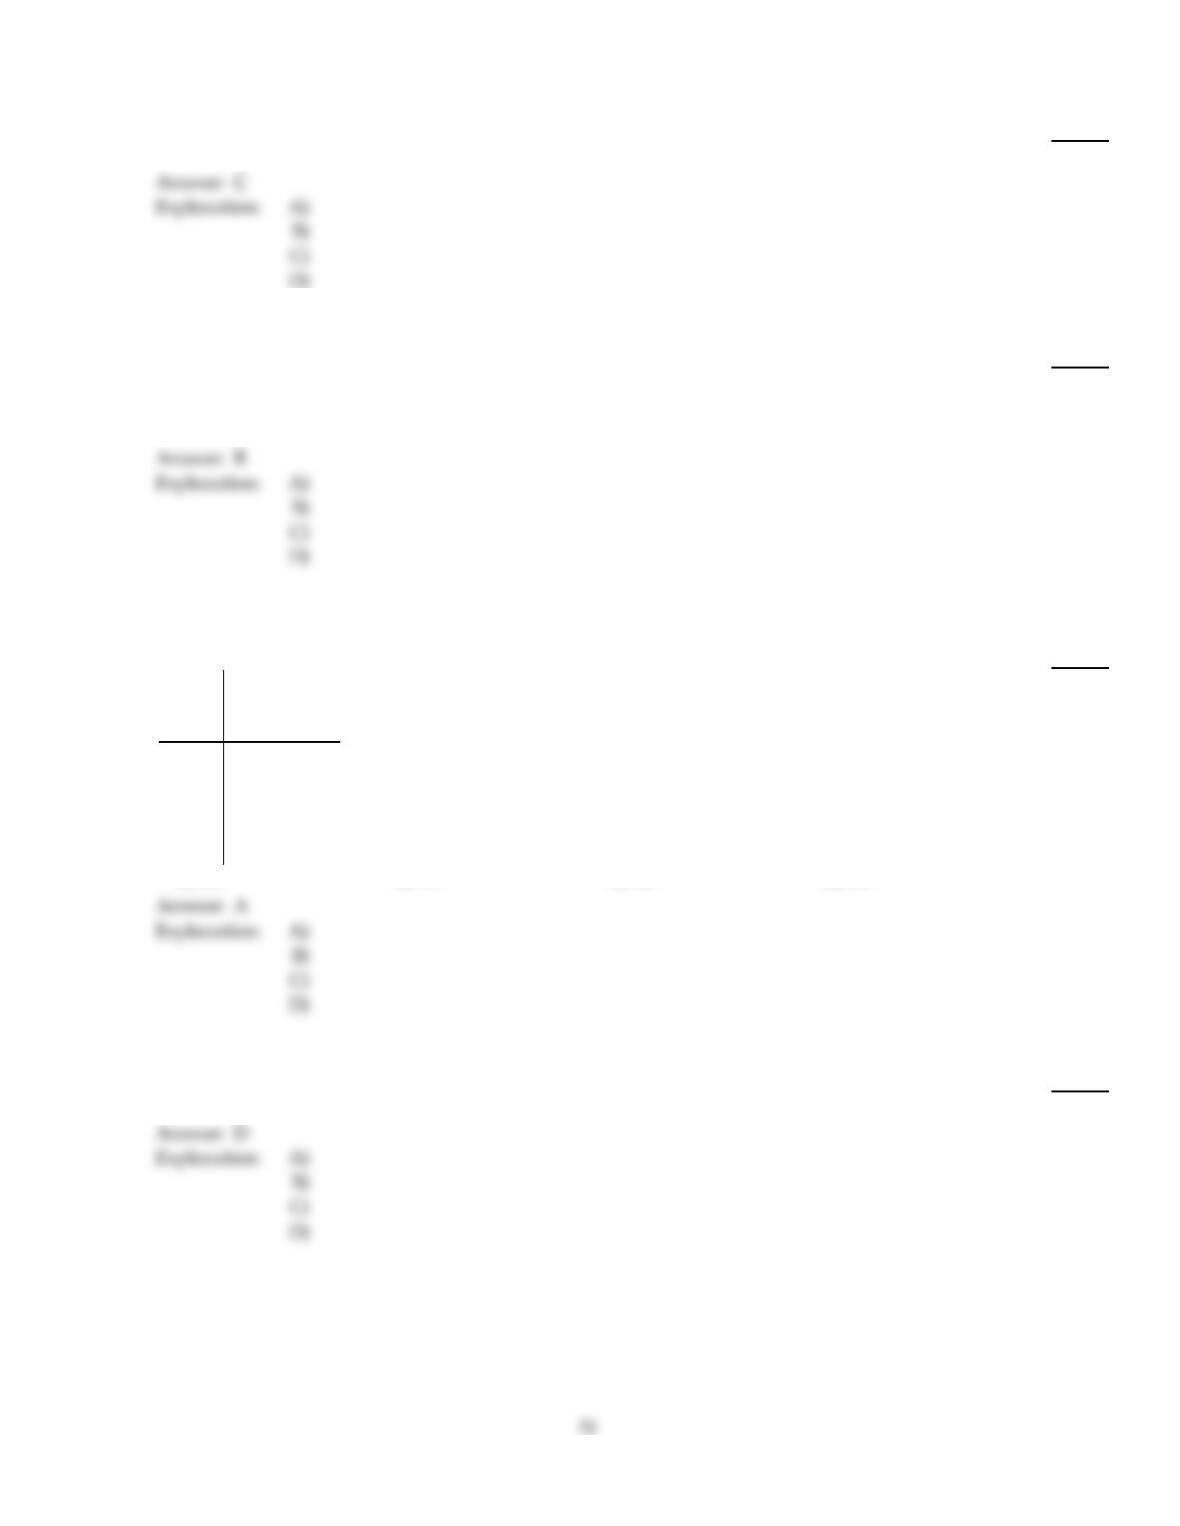
Use the graph to answer the question.
Big “D” Sales (2008–2009)
2009
Sales
(Thousands of $)
2008
Month
24)
What were the total sales for the first 6 months of 2008?
24)
A)
$240,000
B)
$366,000
C)
$46,000
D)
$290,000
Find the median for the set of numbers.
25)
2.5, 3.5, 7.7, 3.7
25)
A)
3.6
B)
3.7
C)
3.5
D)
5.10
Given the grades of a student for one semester, find the grade point average. Assume that the grade point values are 4.0
for an A, 3.0 for a B, and so on. Round to the nearest tenth.
26)
Grades
Number of
Credit Hours
in Course
A 2
A 6
C 3
26)
A)
3.5
B)
3.8
C)
2.5
D)
12.7
27)
The English department assigns a counselor to each student majoring in English. Each counselor is
assigned 20 students. How many counselors are needed?
27)
A)
24
B)
20
C)
27
D)
22
Use the graph to answer the question.
Big “D” Sales (2008–2009)
2009
Sales
(Thousands of $)
2008
Month
28)
What was the increase in sales between month 5 and month 6 of 2009?
28)
A)
$4
B)
$800
C)
$8000
D)
$4000
29)
What was the total increase in sales for the first 6 months from 2008 to 2009?
29)
A)
$18,000
B)
$76,000
C)
$12,000
D)
$652,000
Solve the problem.
30)
Juan experiments to see which of two drugs helps keep lab mice from rejecting transplanted organs
longer. He administers the drug to mice raised in similar conditions and measures the time, in
weeks, as follows. Which drug is better?
Drug X Drug Y
No. Weeks Before Rejection No. Weeks Before Rejection
7.89 5.66 4.13 4.47 8.76 4.13 4.13 5.66
8.76 7.32 8.93 8.76 4.13 7.32 4.47 7.89
5.66 4.13 6.75 5.66 4.47 5.66 8.93 6.75
30)
A)
Drug Y
B)
Drug X
Use the graph to answer the question.
Big “D” Sales (2008–2009)
2009
Sales
(Thousands of $)
2008
Month
31)
Which month in 2009 had the highest sales?
31)
A)
Month 6
B)
Month 3
C)
Month 12
D)
Month 5
Given the grades of a student for one semester, find the grade point average. Assume that the grade point values are 4.0
for an A, 3.0 for a B, and so on. Round to the nearest tenth.
32)
Grades
Number of
Credit Hours
in Course
B 4
B 5
A 1
C 5
D 4
32)
A)
1.4
B)
9.0
C)
2.4
D)
3.5
The following table contains information about moons orbiting a planet named Geo I. Use the table to solve the problem.
33)
Moon Average Distance
from Geo I (km) Diameter (km) Time of Revolution
(in Earth time, years)
Luna 1 4000 413 1.00
Luna 2 5200 2175 3.08
Luna 3 90,000 312 5.44
Luna 4 129,600 725 43.83
Luna 5 297,000 1138 112.86
What is the mode of the diameters of the moons?
33)
A)
952.6 km
B)
No mode exists
C)
312 km
D)
725 km
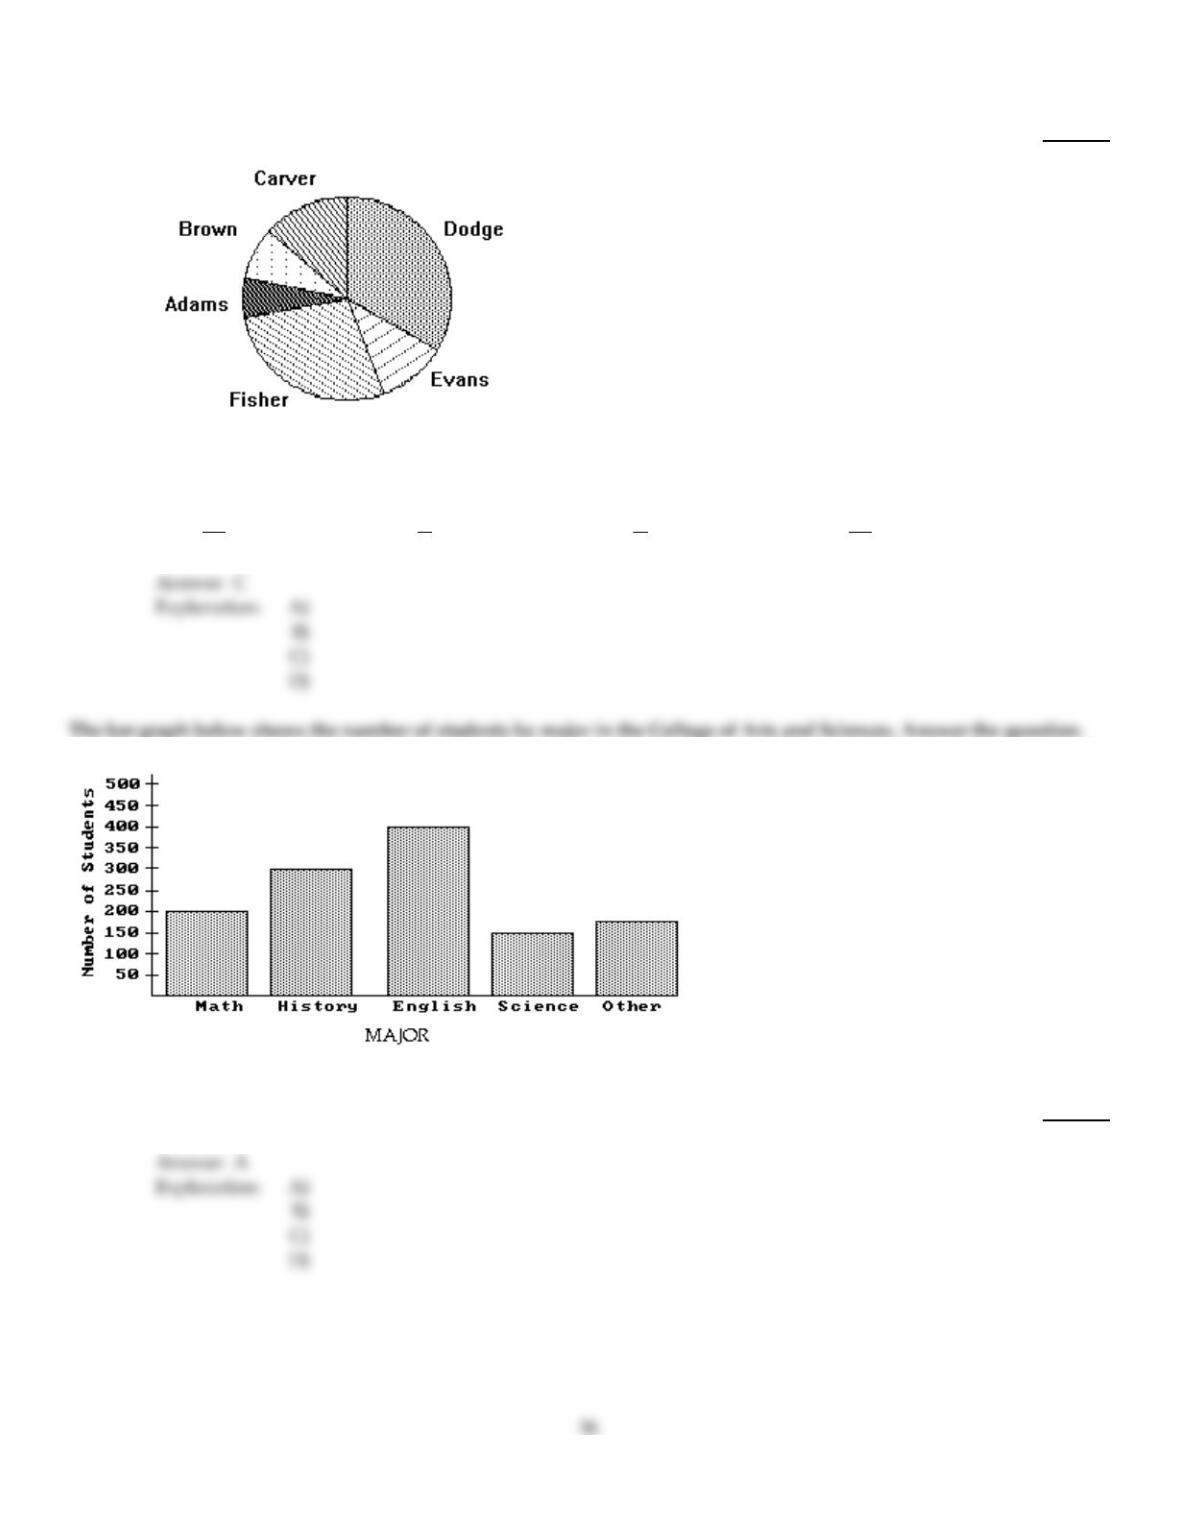
Use the circle graph to solve the problem.
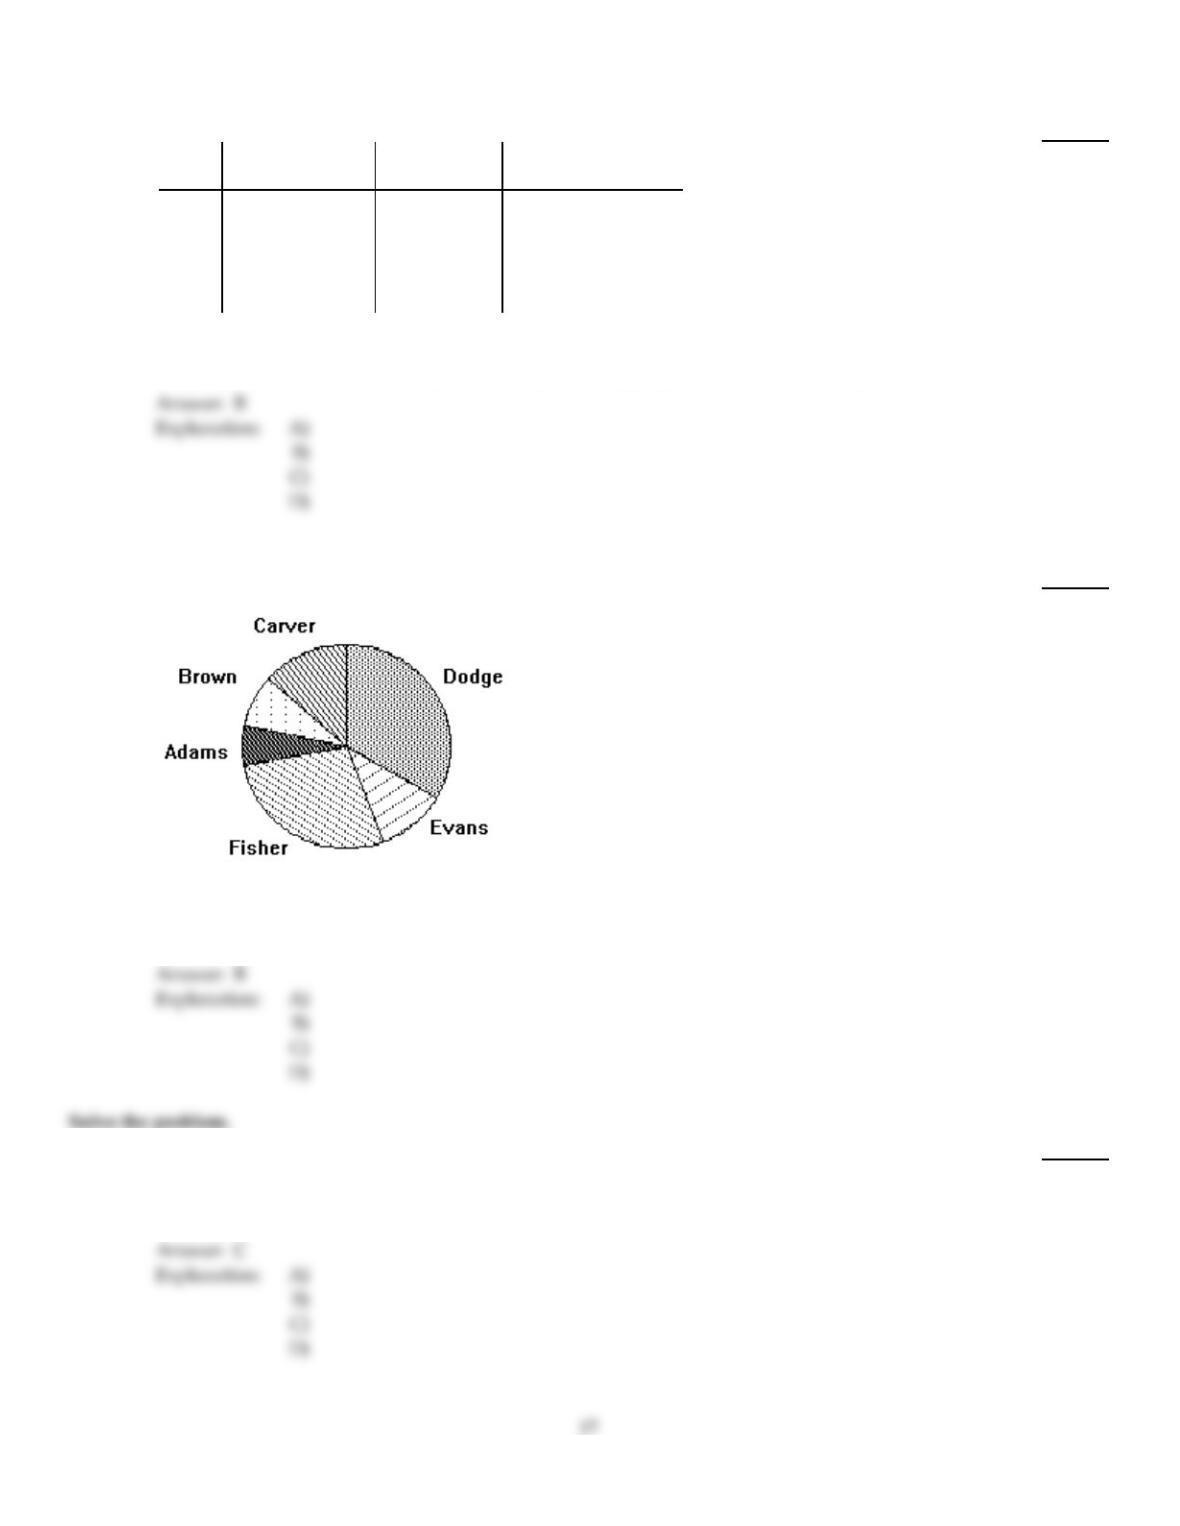
34)
The circle graph below gives the number of students in the residence halls at the state university.
162
144 324
132
150
282
Which residence hall has the lowest number of students?
34)
A)
Brown
B)
Adams
C)
Fisher
D)
Evans
35)
You decide to keep track of the number of text messages you send each day. You record the
following data: 9, 9, 23, 20, 27, 47, 40, 30. Find the median number of text messages you sent.
35)
A)
27 text messages
B)
25.5 text messages
C)
25 text messages
D)
23 text messages
36)
The Wellspring Company’s fleet of trucks get 17, 13, 18, 10, 18, 13, and 21 miles per gallon. What is
the average number of miles expected per gallon for the fleet? Round to the nearest whole number.
36)
A)
18 mpg
B)
16 mpg
C)
14 mpg
D)
17 mpg
37)
69, 26, 218, 121, 285, 240, 237
37)
A)
218
B)
237
C)
121
D)
171
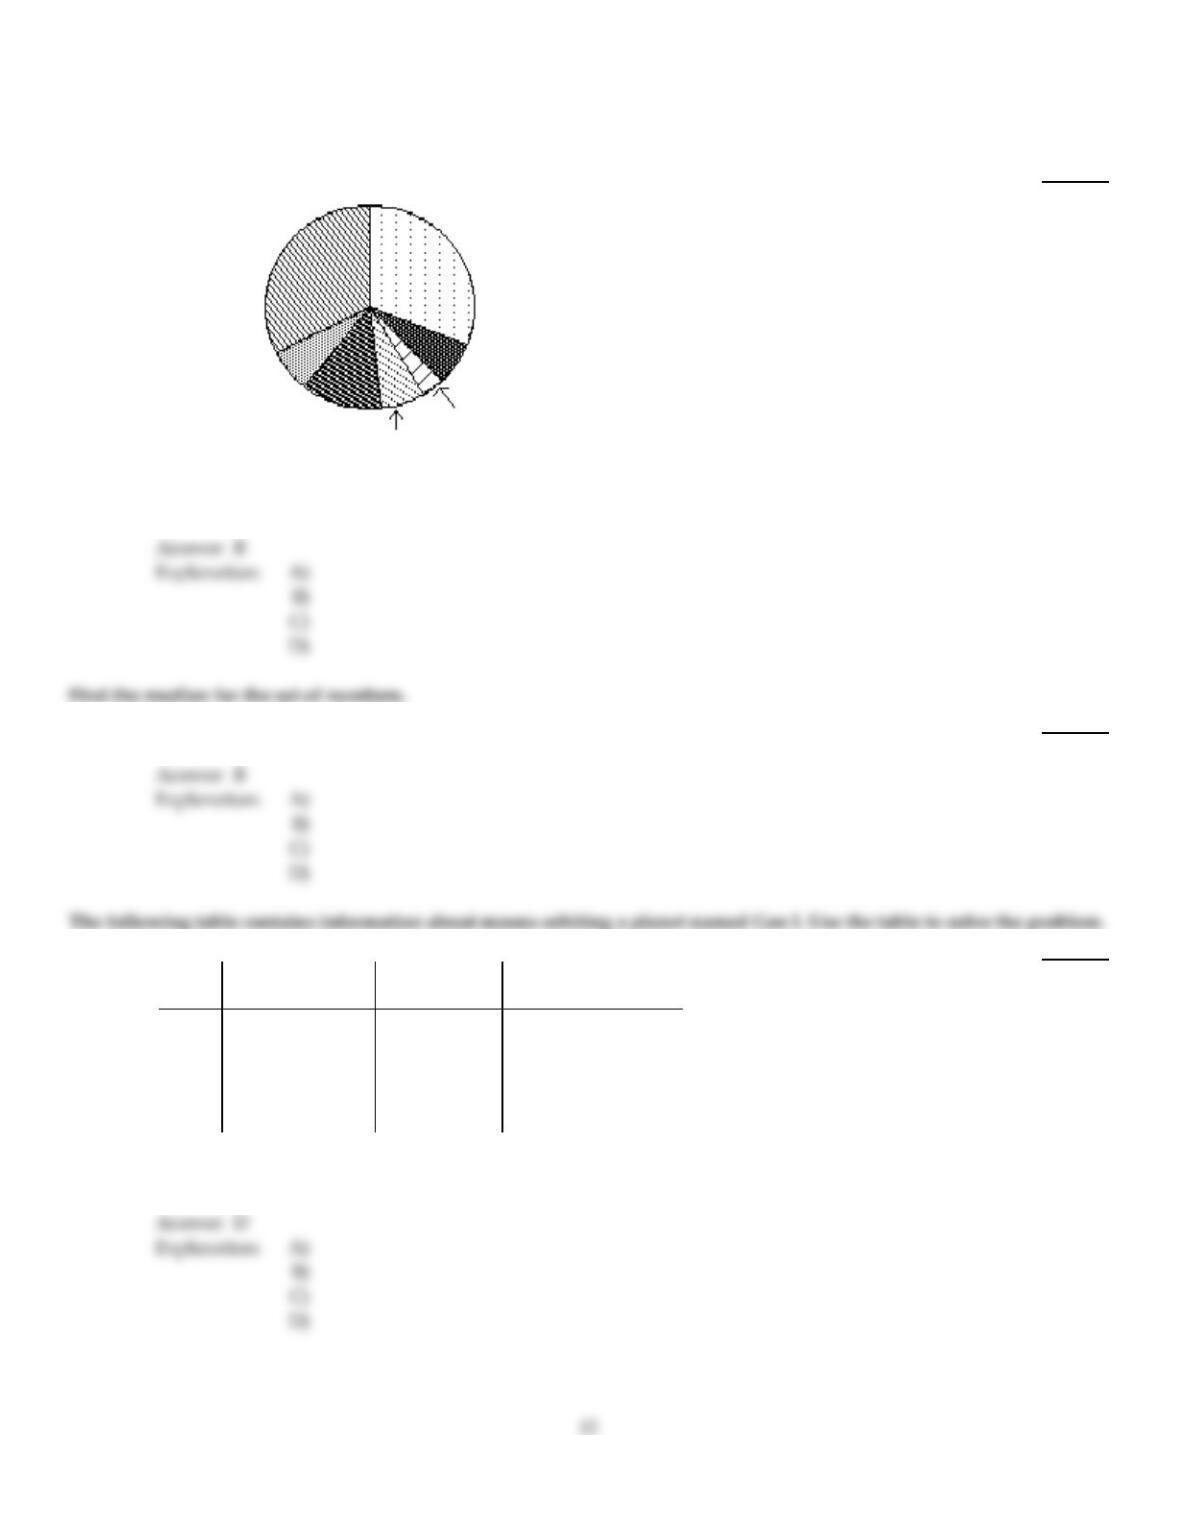
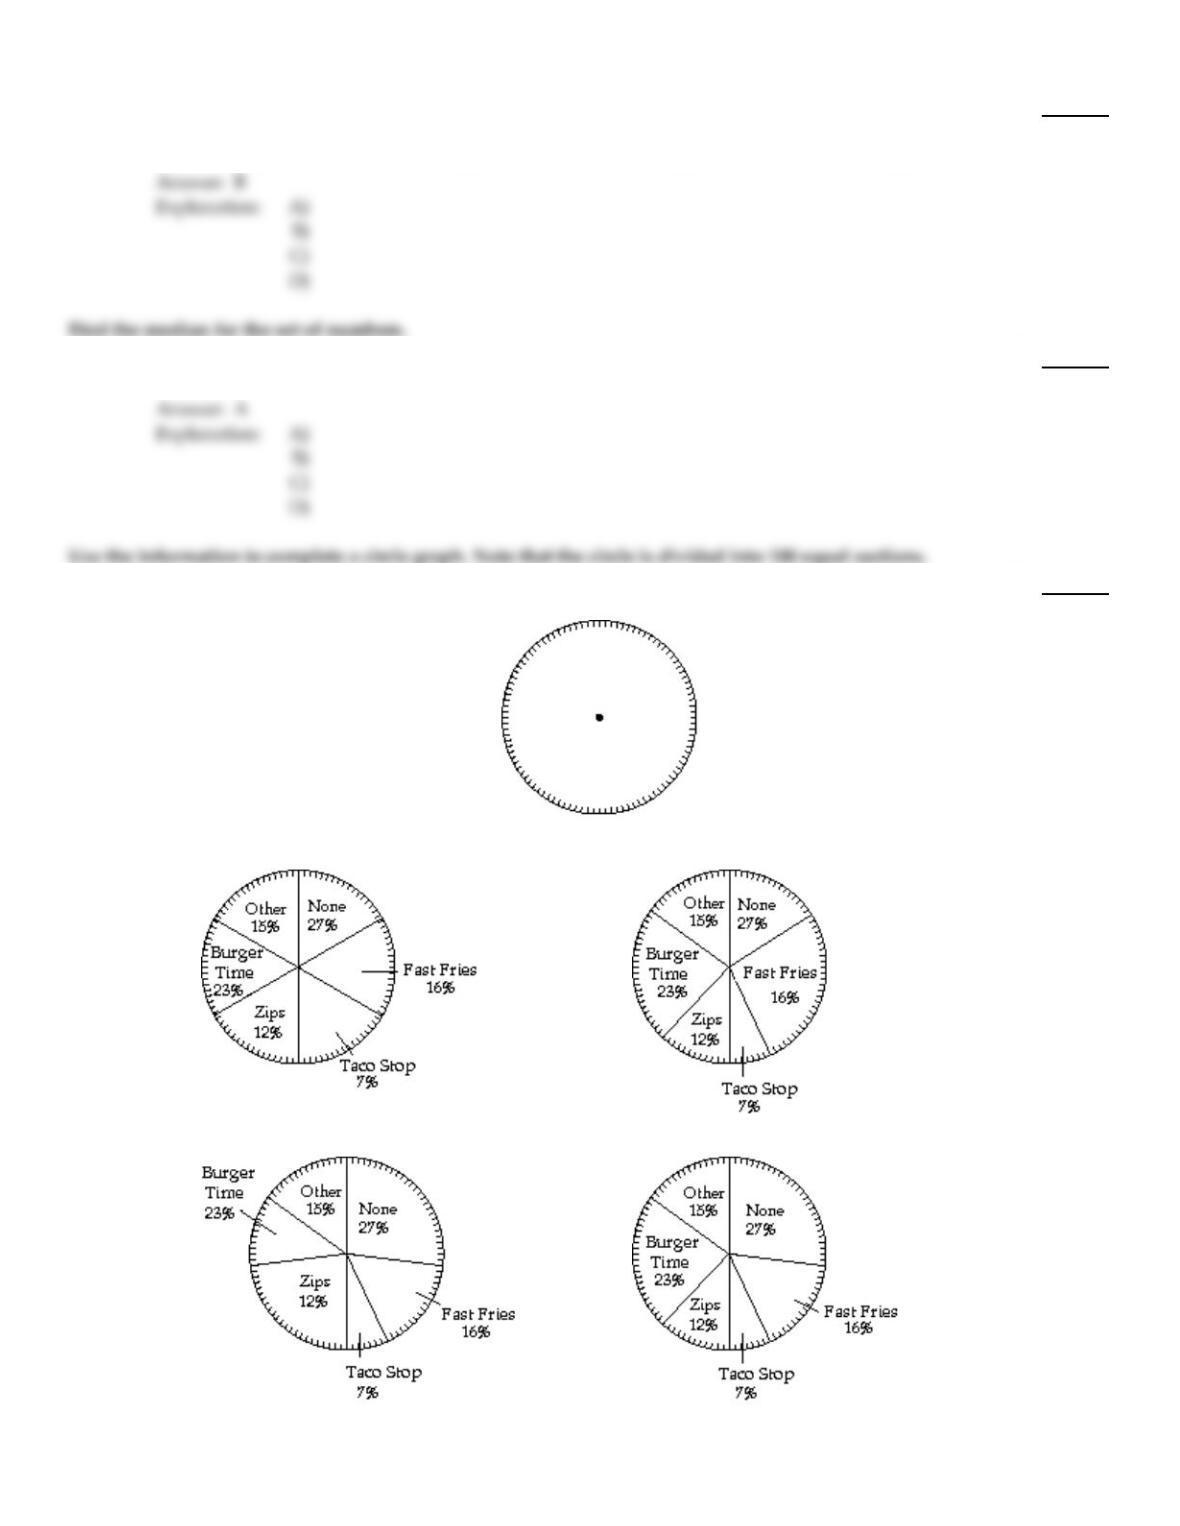
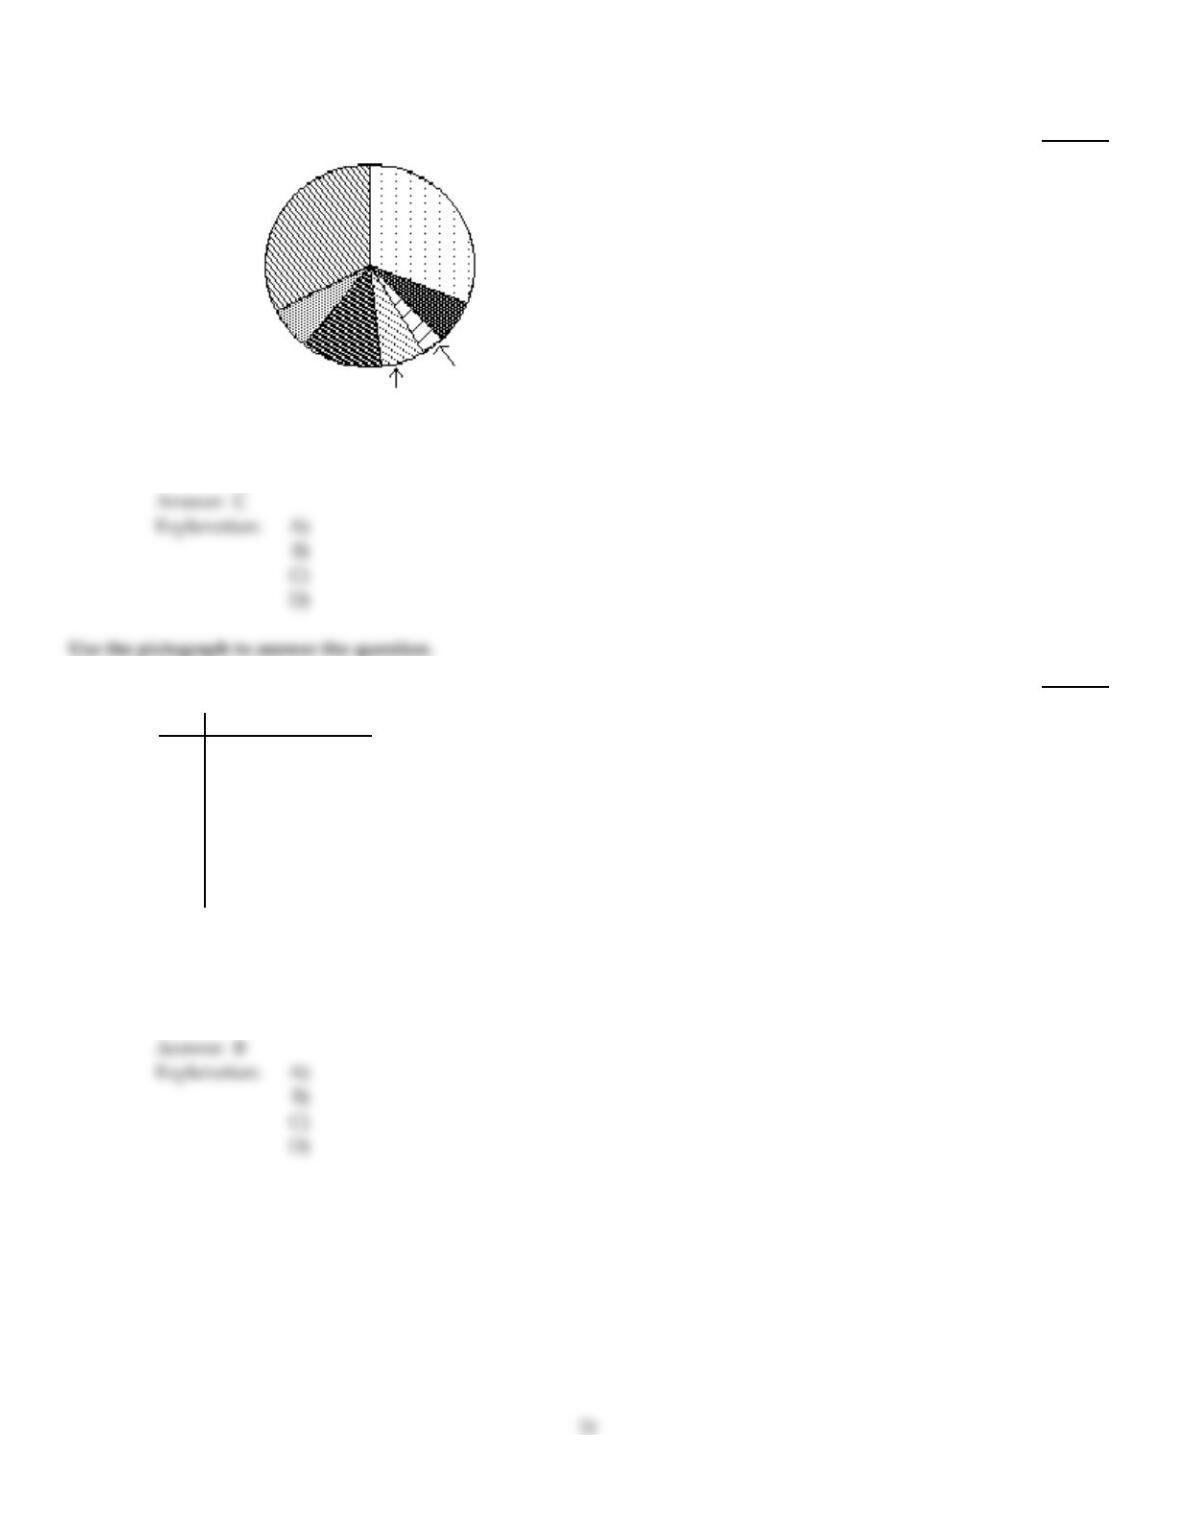
38)
Main fast food restaurants chosen by students of one school:
None: 27%
Fast Fries: 16%
Taco Stop: 7%
Zips: 12%
Burger Time: 23%
Other: 15%
38)
A)
B)
C)
D)
18
39)
Jeremy’s car got 248 miles (highway) on 8 gallons of gasoline. What was the average number of
miles expected per gallon?
39)
A)
32 mpg
B)
31 mpg
C)
30 mpg
D)
33 mpg
40)
$29.80, $18.00, $26.65, $24.00, $19.05
40)
A)
$19.58
B)
$29.38
C)
$23.50
D)
$24.00
41)
Moon Average Distance
from Geo I (km) Diameter (km) Time of Revolution
(in Earth time, years)
Luna 1 3000 415 0.75
Luna 2 3900 2166 2.31
Luna 3 50,000 307 4.08
Luna 4 72,000 722 24.35
Luna 5 165,000 1137 62.70
About how many Luna 3 diameters would it take to get one Luna 2 diameter?
41)
A)
3
B)
0.14
C)
7
D)
1859
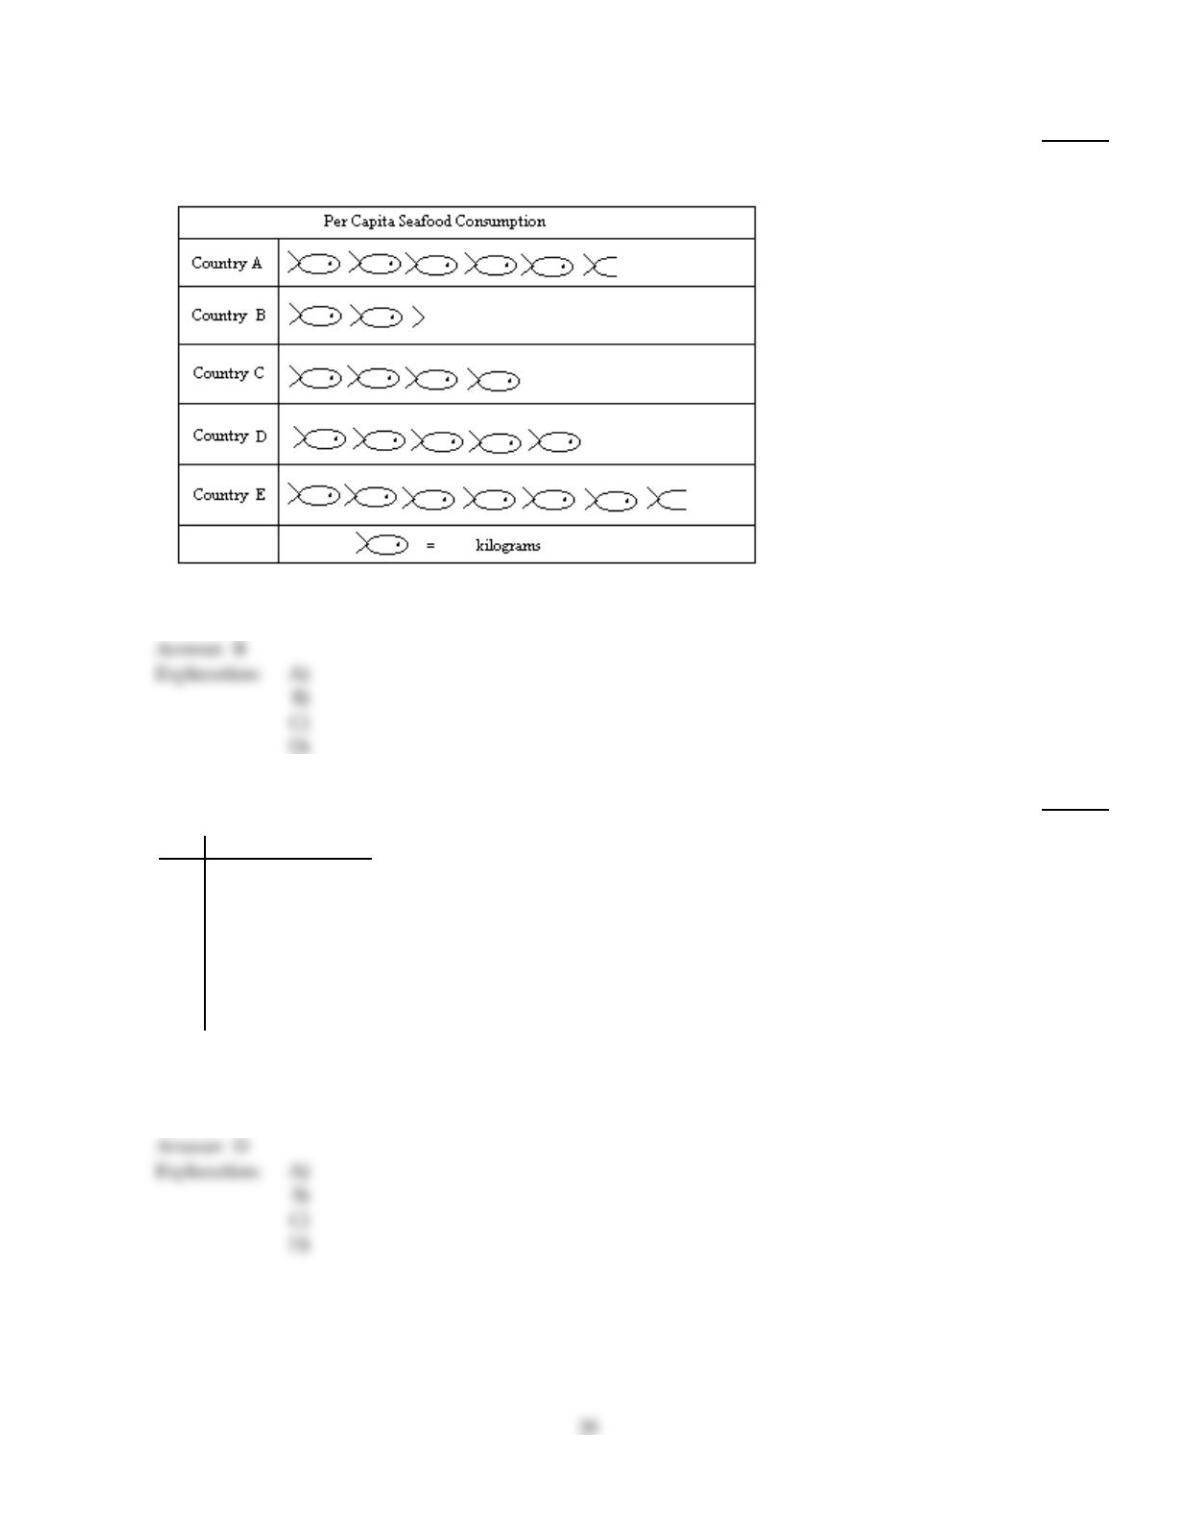
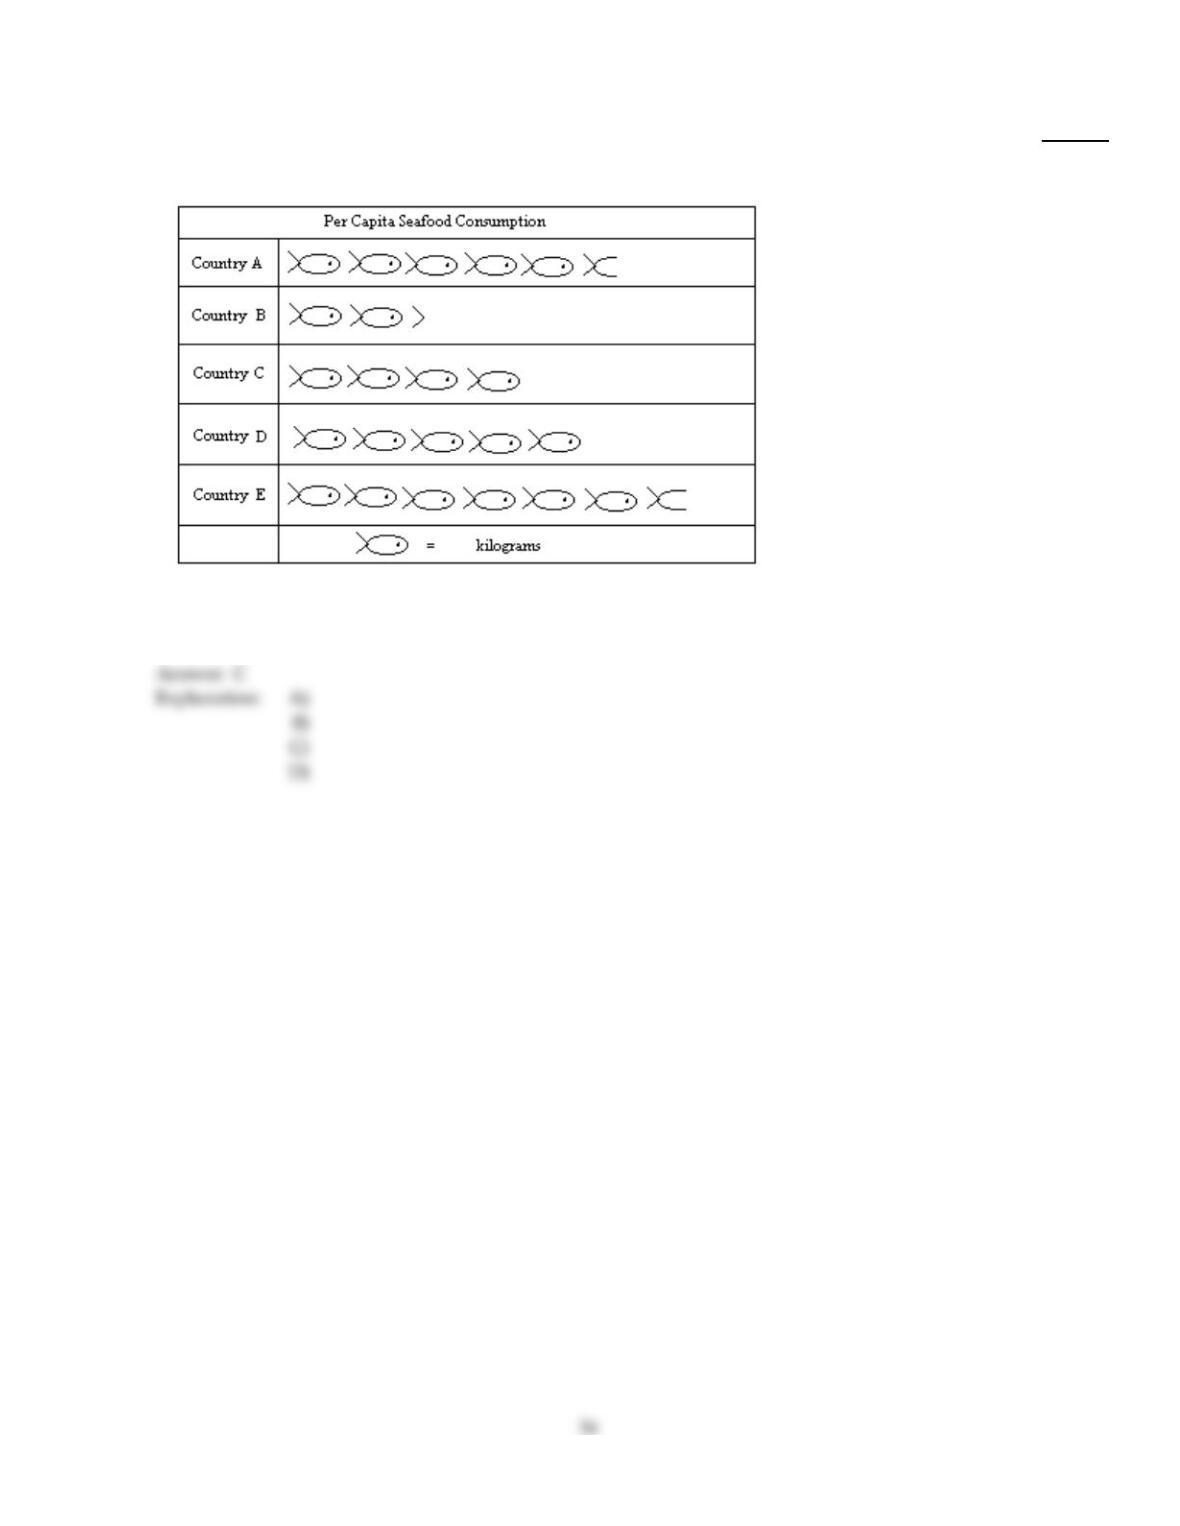
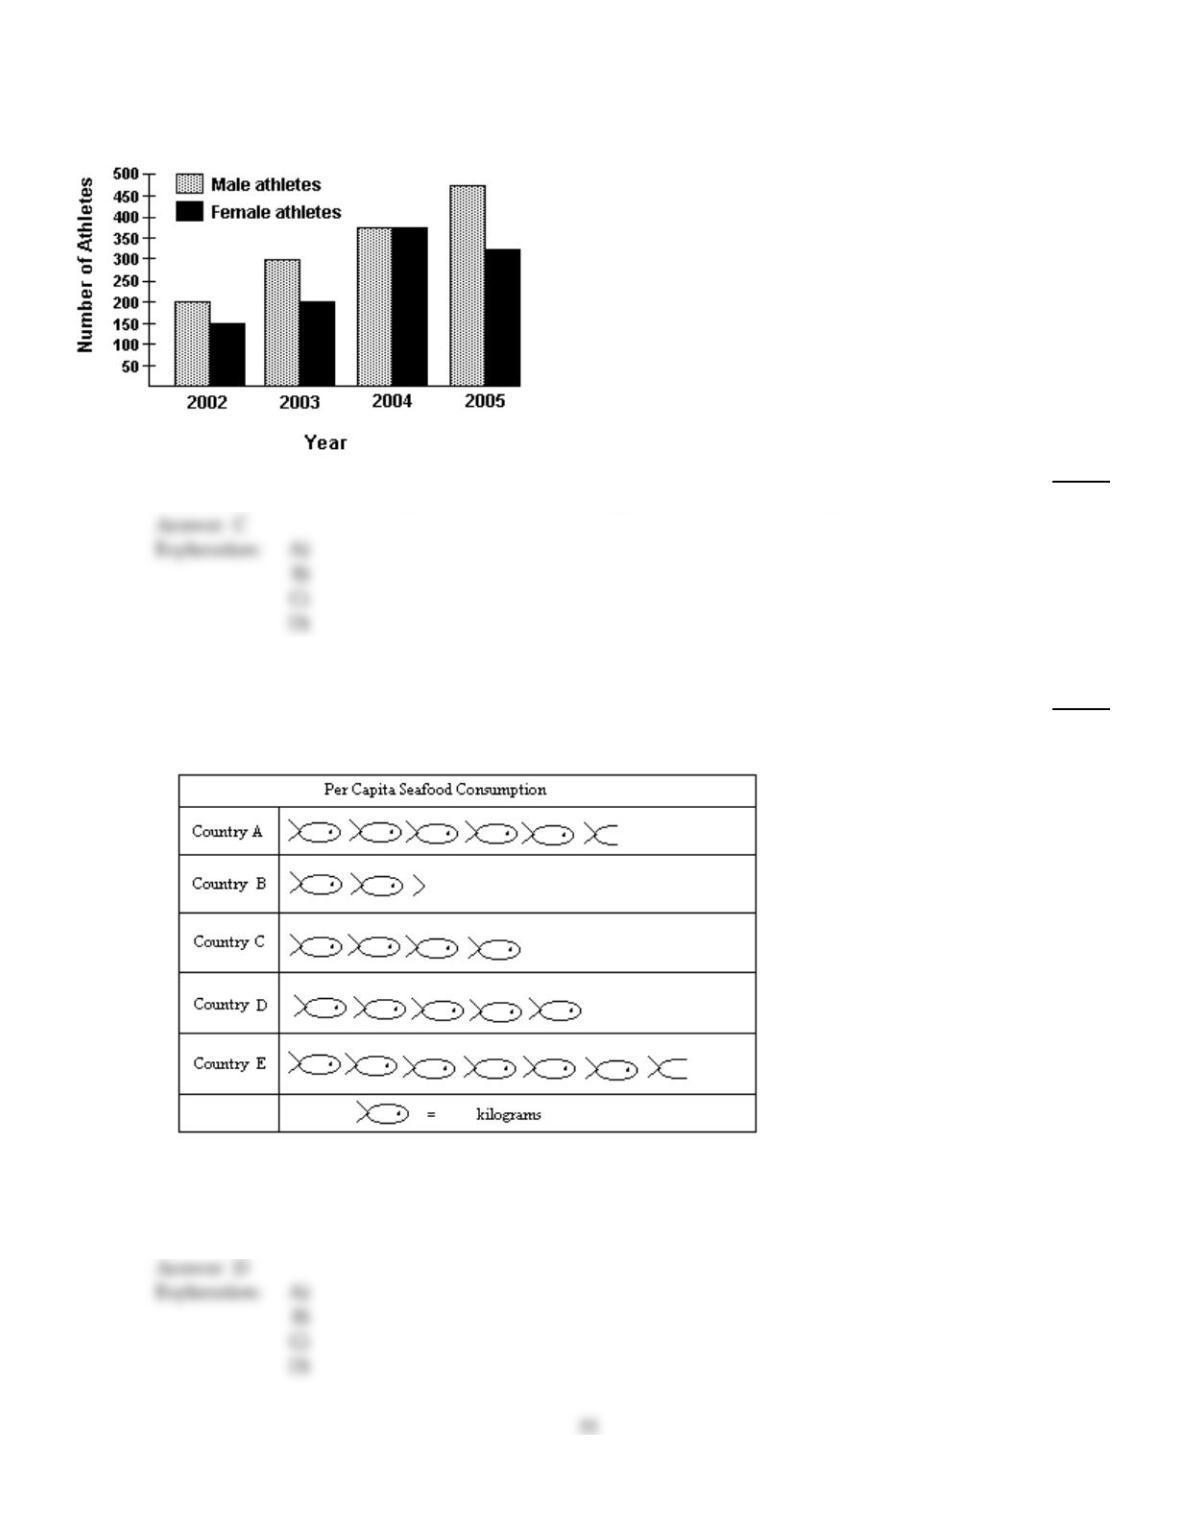
Use the pictograph to answer the question.
42)
For selected countries, this pictograph shows approximately how many kilograms of seafood are
consumed by each person (per capita) annually.
114
People in Country D eat approximately what percent more seafood than people in Country C?
42)
A)
125%
B)
25%
C)
75%
D)
50%
43)
This pictograph shows projected sales of compact disks (CDs) for a popular rock band for seven
consecutive years.
Year Projected CD Sales
2013
2012
2011
2010
2009
2008
2007
=10,000 CDs
Approximately how many fewer CDs will be sold in 2009 than in 2011?
43)
A)
50,000 CDs
B)
60,000 CDs
C)
4 CDs
D)
40,000 CDs
Use the circle graph to solve the problem.
44)
The circle graph below gives the inventory of the men‘s department of a store.
Suits
$37,232 Trousers
$28,640
Underwear Shirts
$4296 $6444
Sweaters Socks
$17,184 Ties $2864
$5728
In which item of apparel does the store have the smallest investment?
44)
A)
Suits
B)
Shirts
C)
Socks
D)
Underwear
45)
This pictograph shows projected sales of compact disks (CDs) for a popular rock band for seven
consecutive years.
Year Projected CD Sales
2012
2011
2010
2009
2008
2007
2006
=1000 CDs
In which year will the greatest number of CDs be sold?
45)
A)
2007
B)
2009
C)
2012
D)
Not enough information is given.
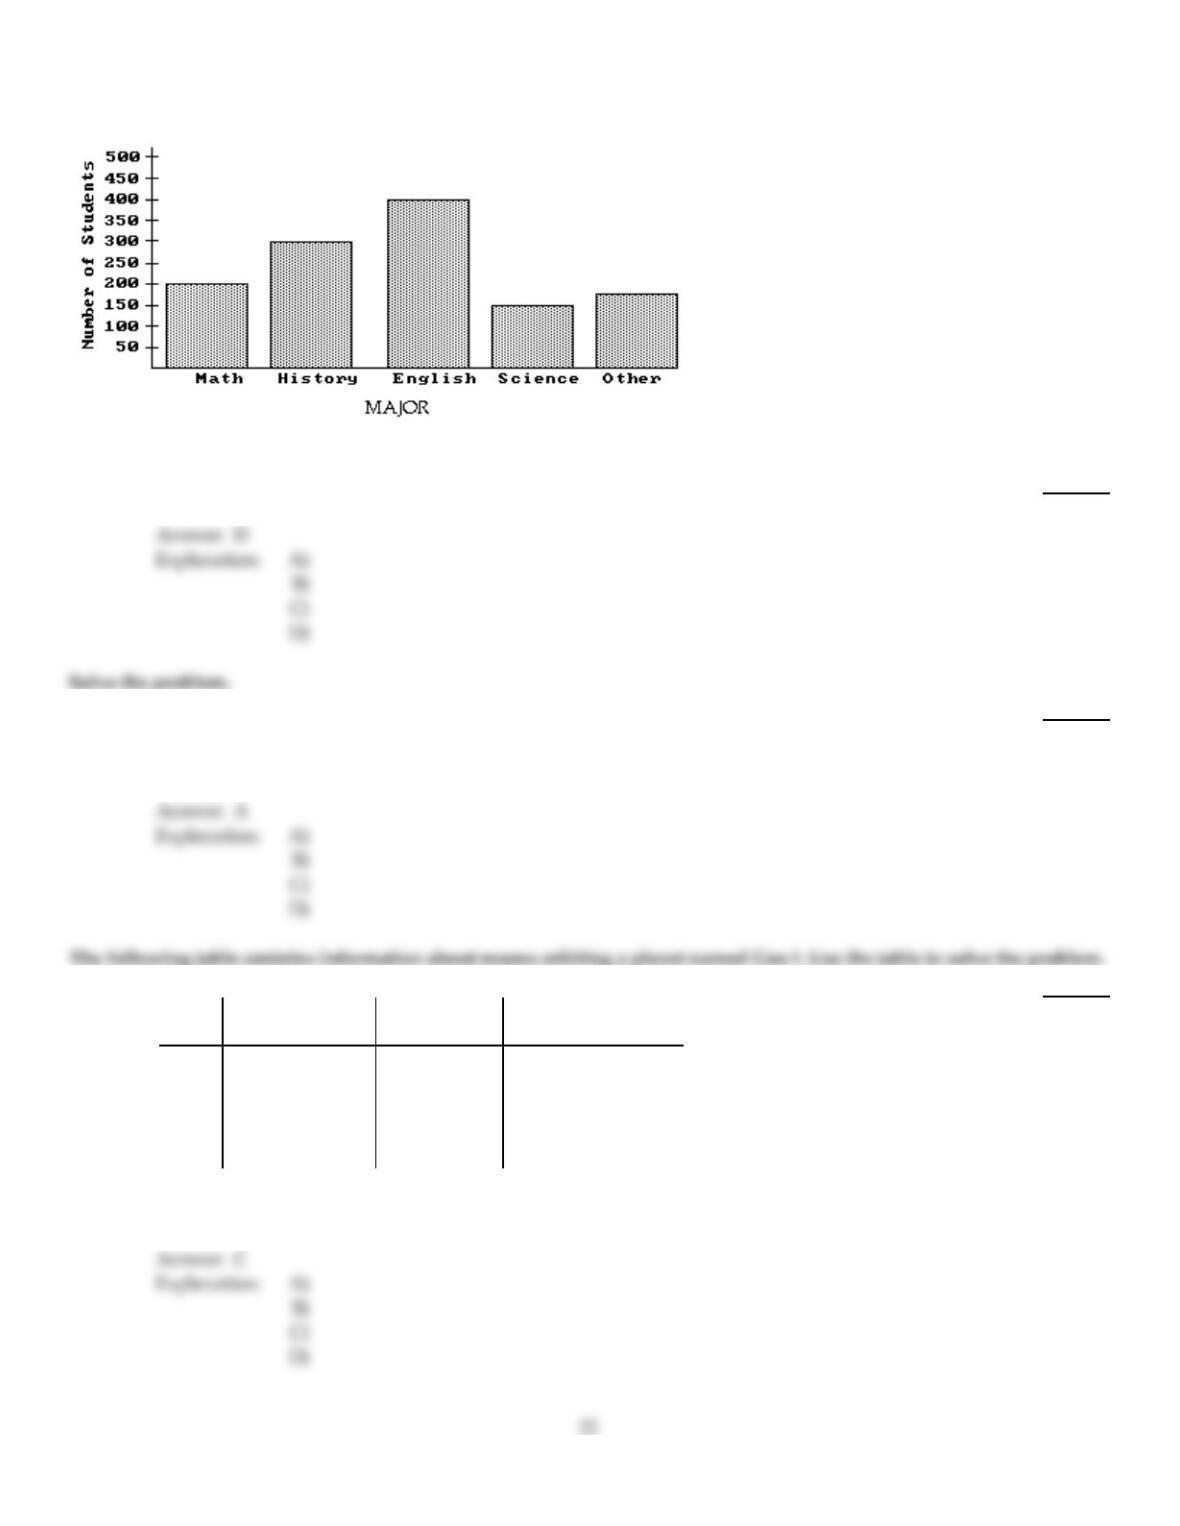
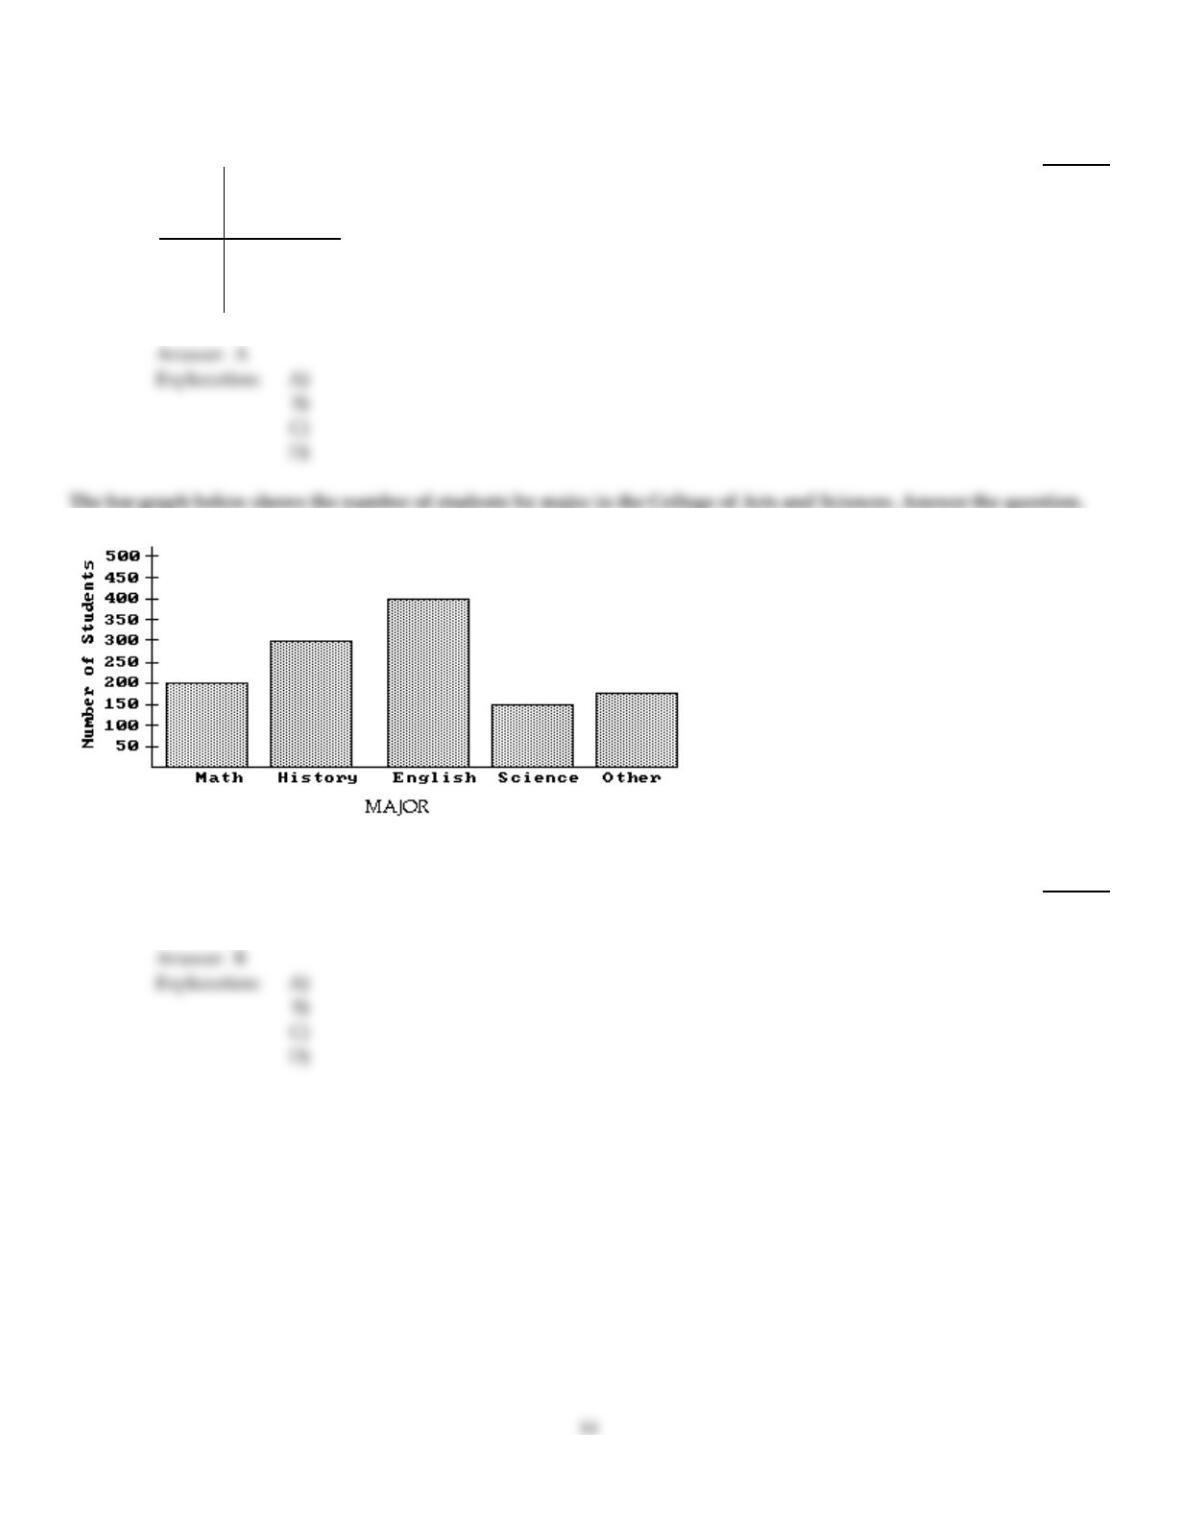
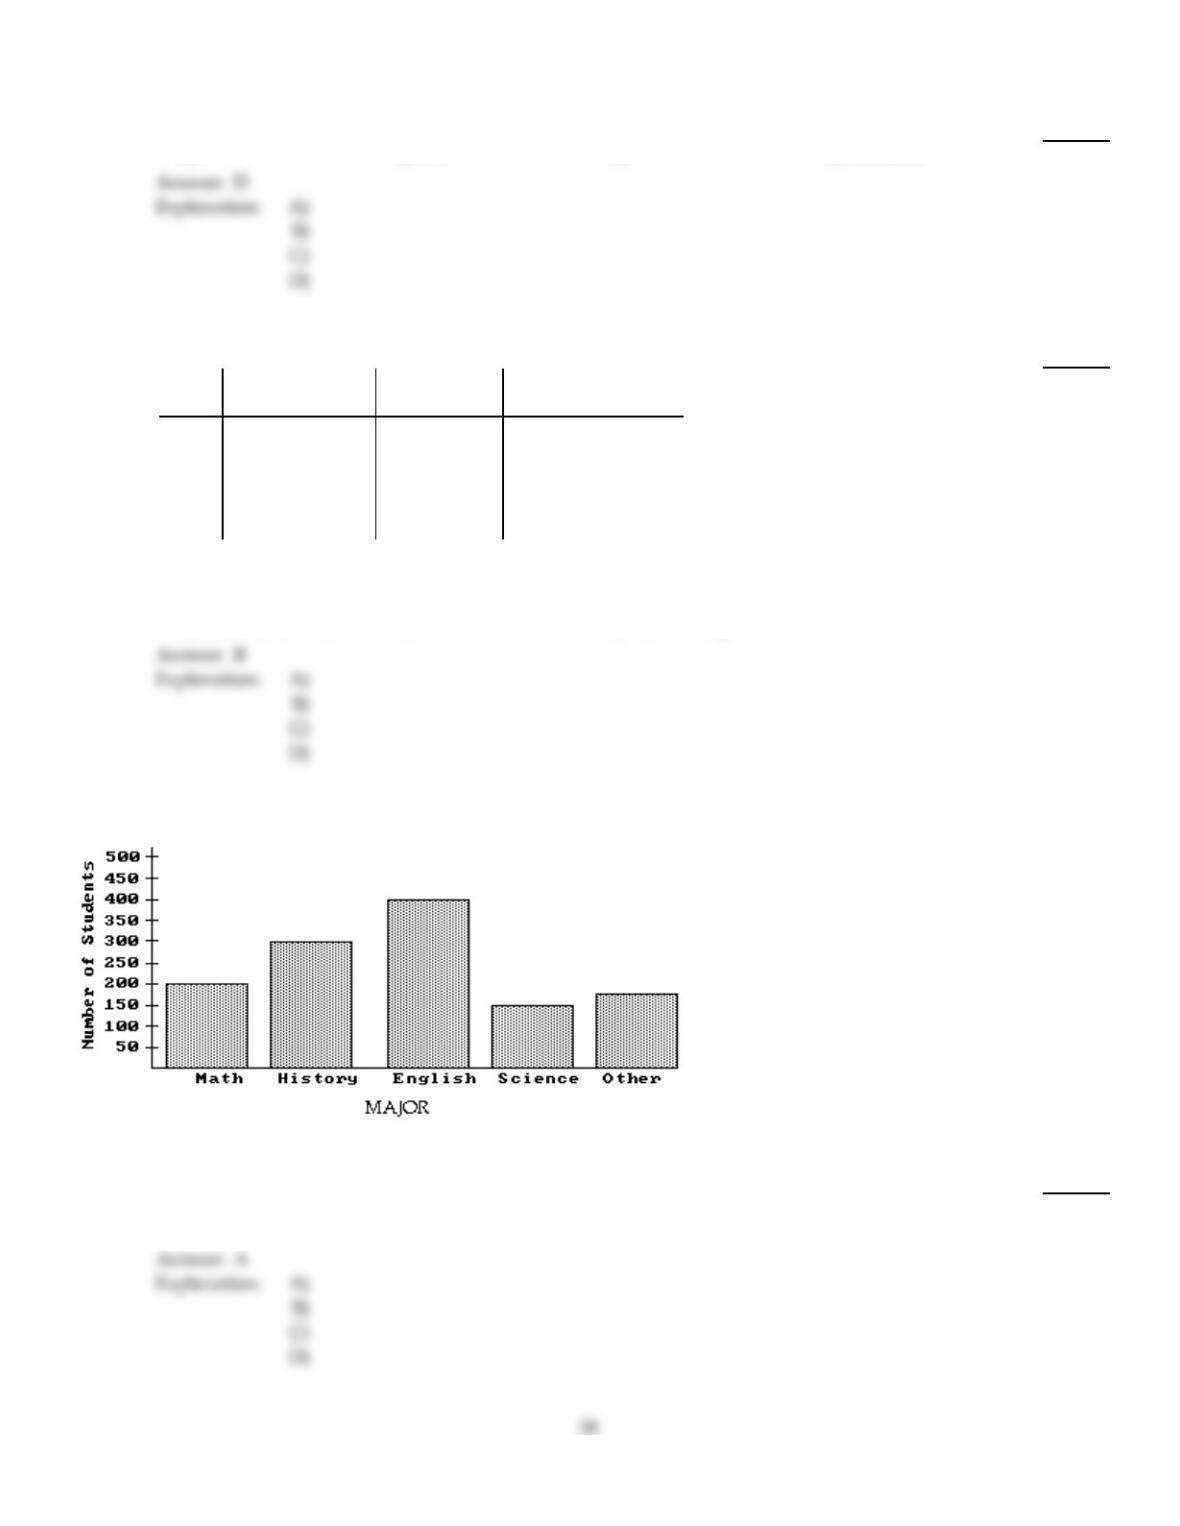
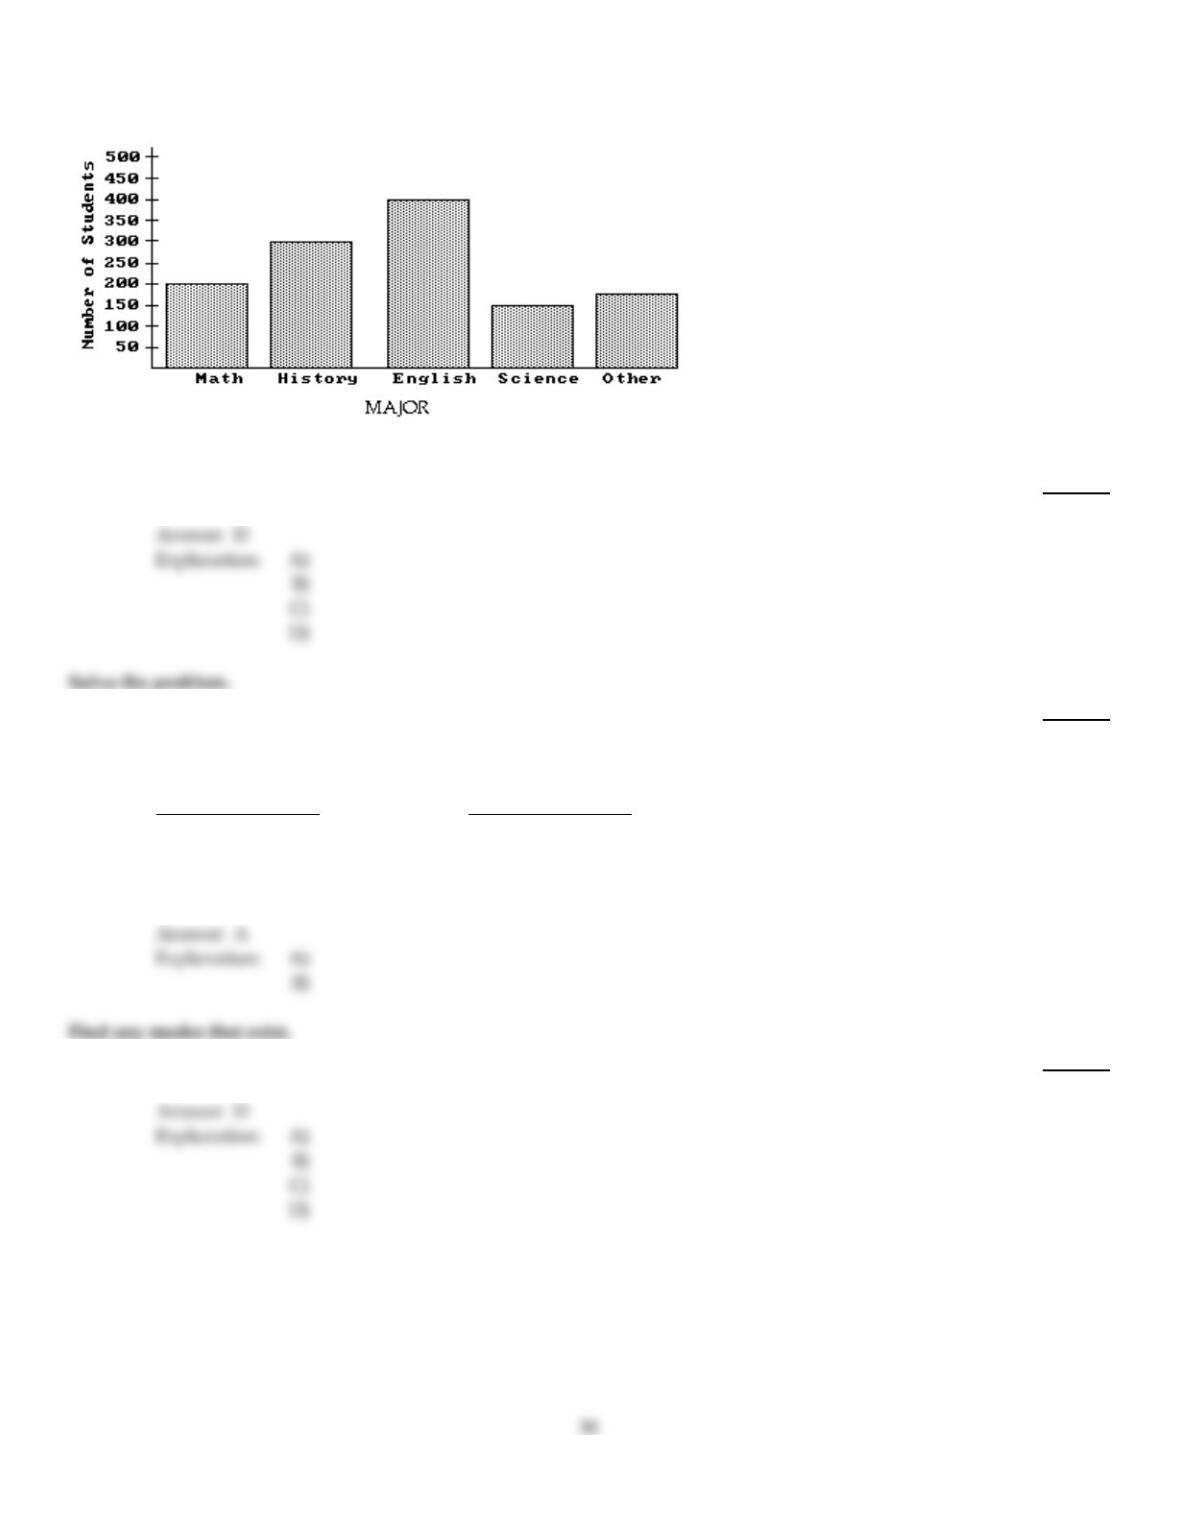
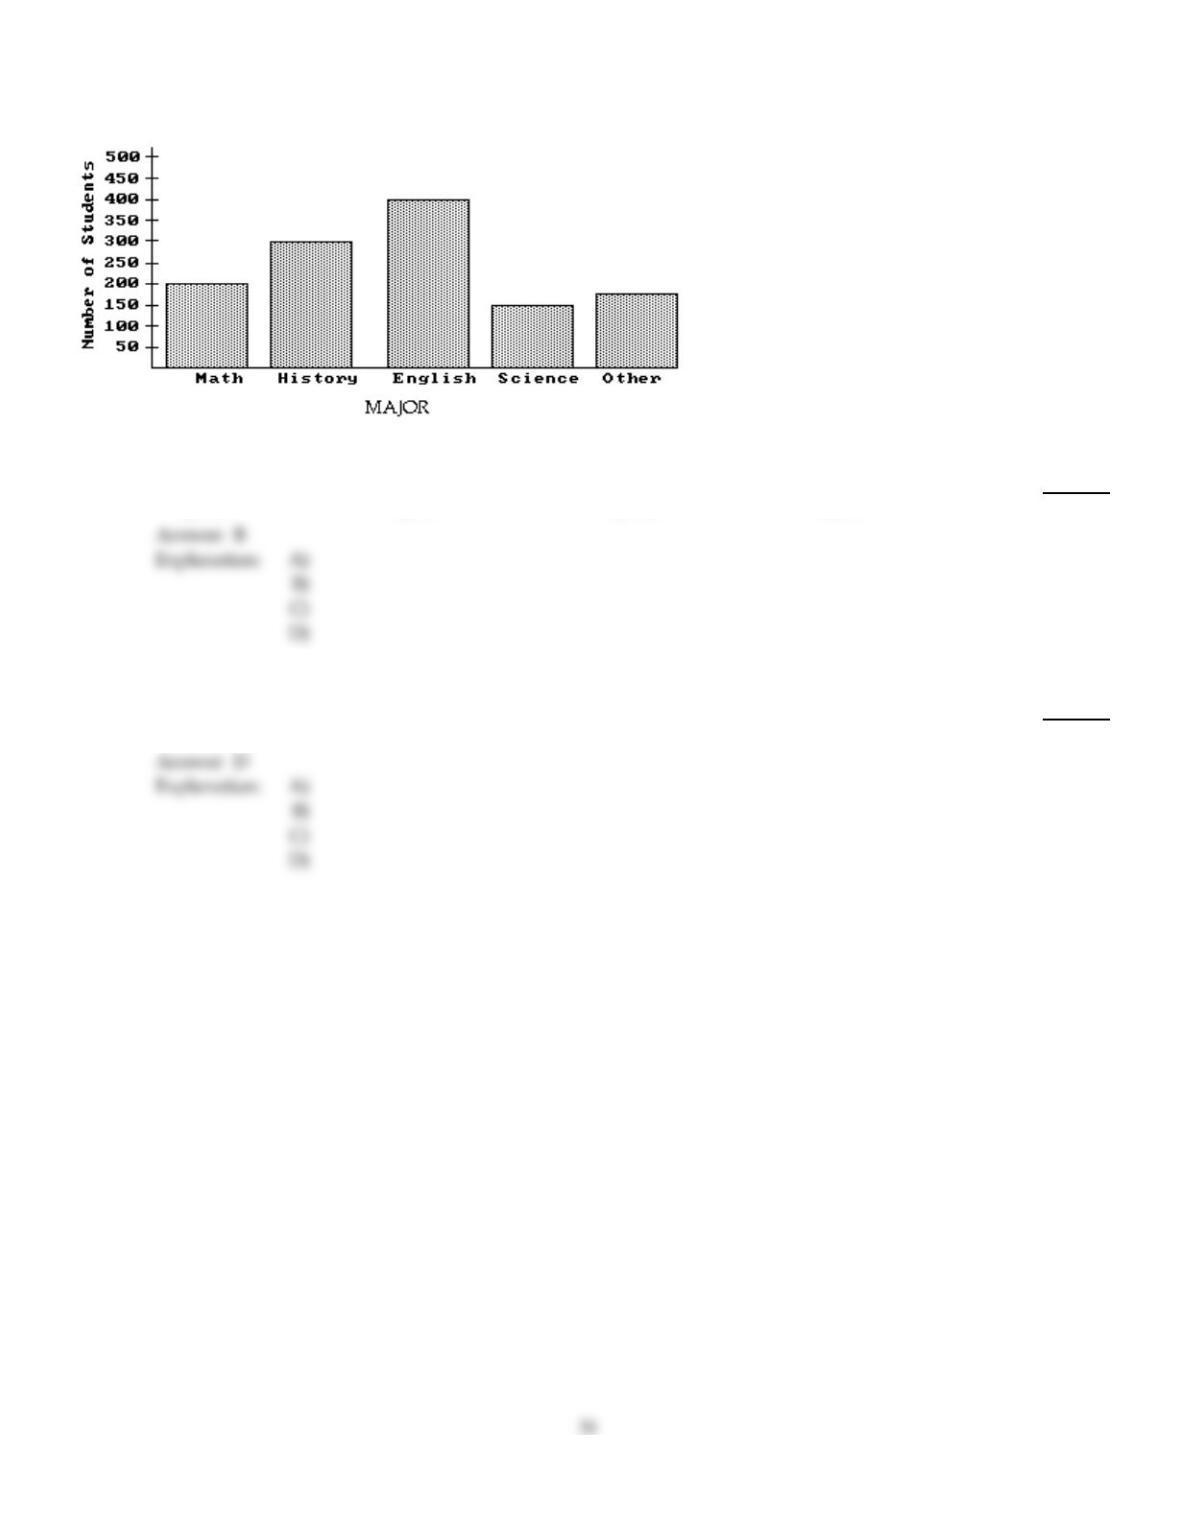
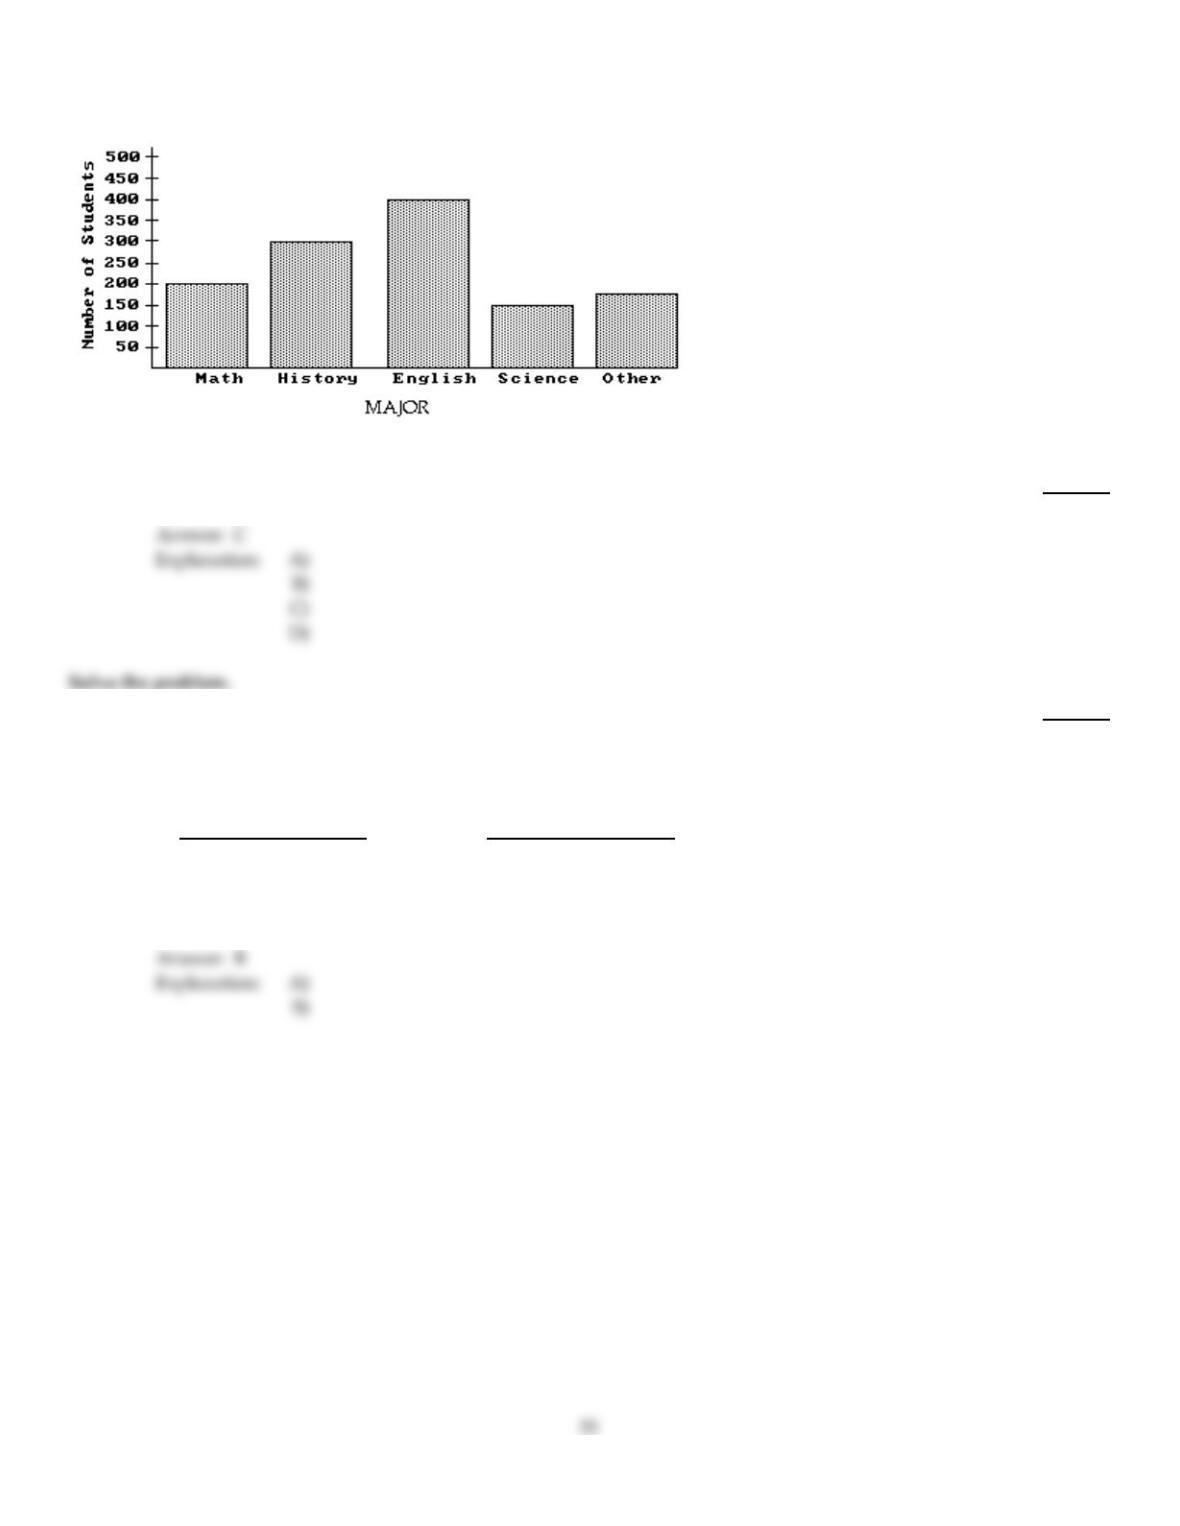
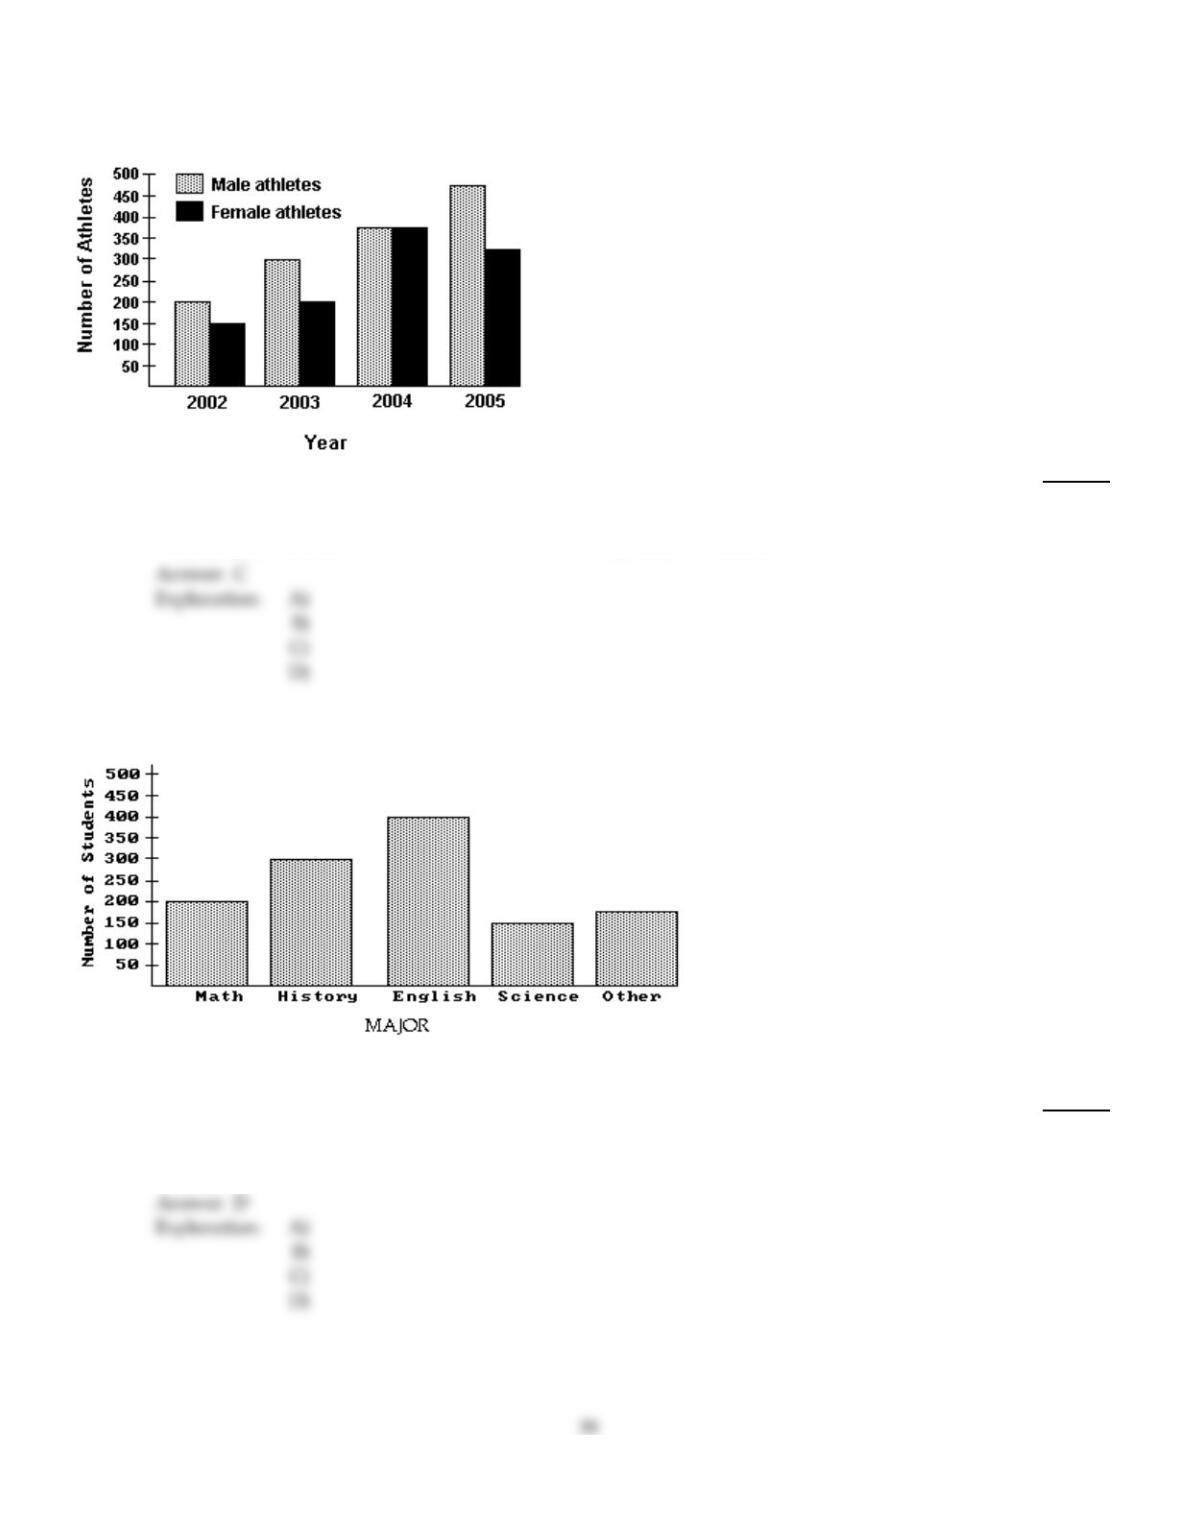
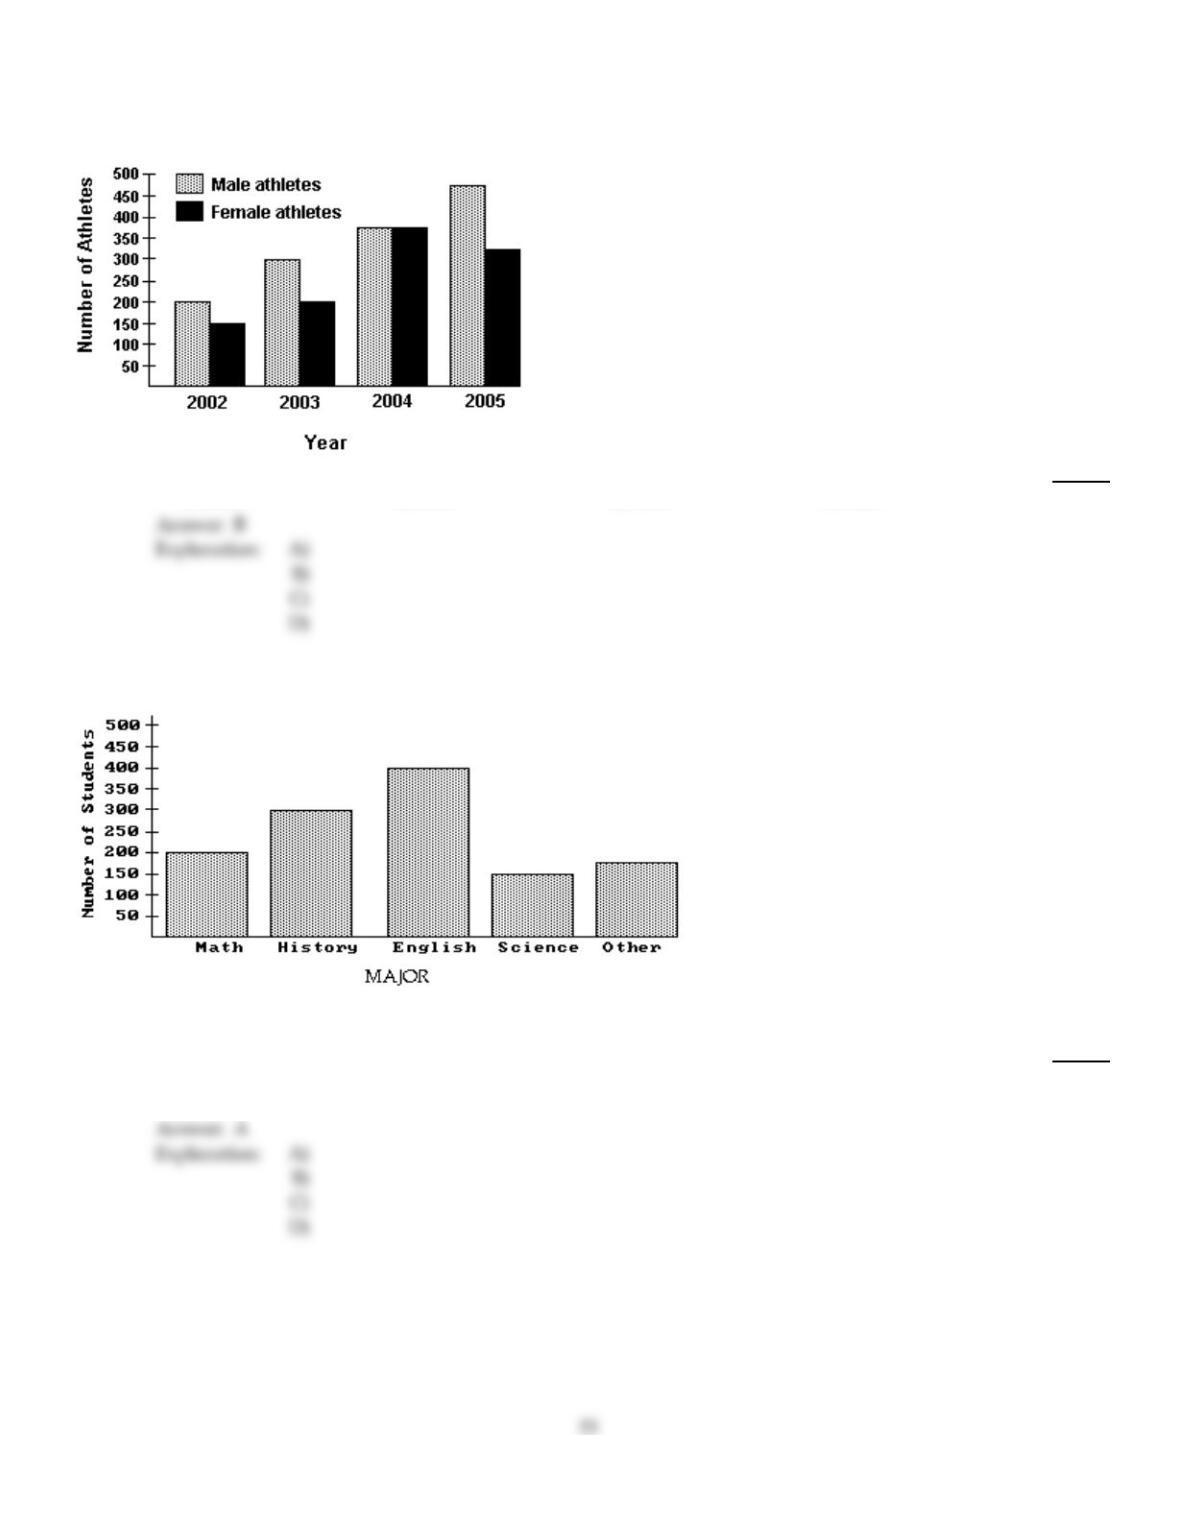
The bar graph below shows the number of students by major in the College of Arts and Sciences. Answer the question.
46)
Which major has the largest number of students?
46)
A)
History
B)
Math
C)
Science
D)
English
47)
The batting percentages of some of the players on the company softball team are .212, .295, .219,
.331, .248, .291, and .267. What is the average batting percentage of these players? Round to the
nearest thousandth.
47)
A)
.266
B)
.242
C)
.279
D)
.311
48)
Moon Average Distance
from Geo I (km) Diameter (km) Time of Revolution
(in Earth time, years)
Luna 1 2000 411 0.50
Luna 2 2600 2178 1.54
Luna 3 90,000 315 2.72
Luna 4 129,600 726 43.83
Luna 5 297,000 1137 112.86
Which moon has a diameter of 315 kilometers?
48)
A)
Luna 2
B)
Luna 4
C)
Luna 3
D)
Luna 1
Find any modes that exist.
49)
7.15, 7.41, 7.56, 7.15, 7.88, 7.99, 7.62
49)
A)
7.54
B)
7.41
C)
7.56
D)
7.15
50)
Moon Average Distance
from Geo I (km) Diameter (km) Time of Revolution
(in Earth time, years)
Luna 1 1000 416 0.25
Luna 2 1300 2181 0.77
Luna 3 80,000 311 1.36
Luna 4 115,200 727 38.96
Luna 5 264,000 1143 100.32
What is the median of the average distance from Geo 1 of the moons?
50)
A)
311 km
B)
115,200 km
C)
80,000 km
D)
92,300 km
C
51)
This pictograph shows projected sales of compact disks (CDs) for a popular rock band for seven
consecutive years.
Year Projected CD Sales
2012
2011
2010
2009
2008
2007
2006
=10,000 CDs
How many sales do 8 CD symbols represent?
51)
A)
10,000
B)
Not enough information is given.
C)
80,000
D)
8
C
D
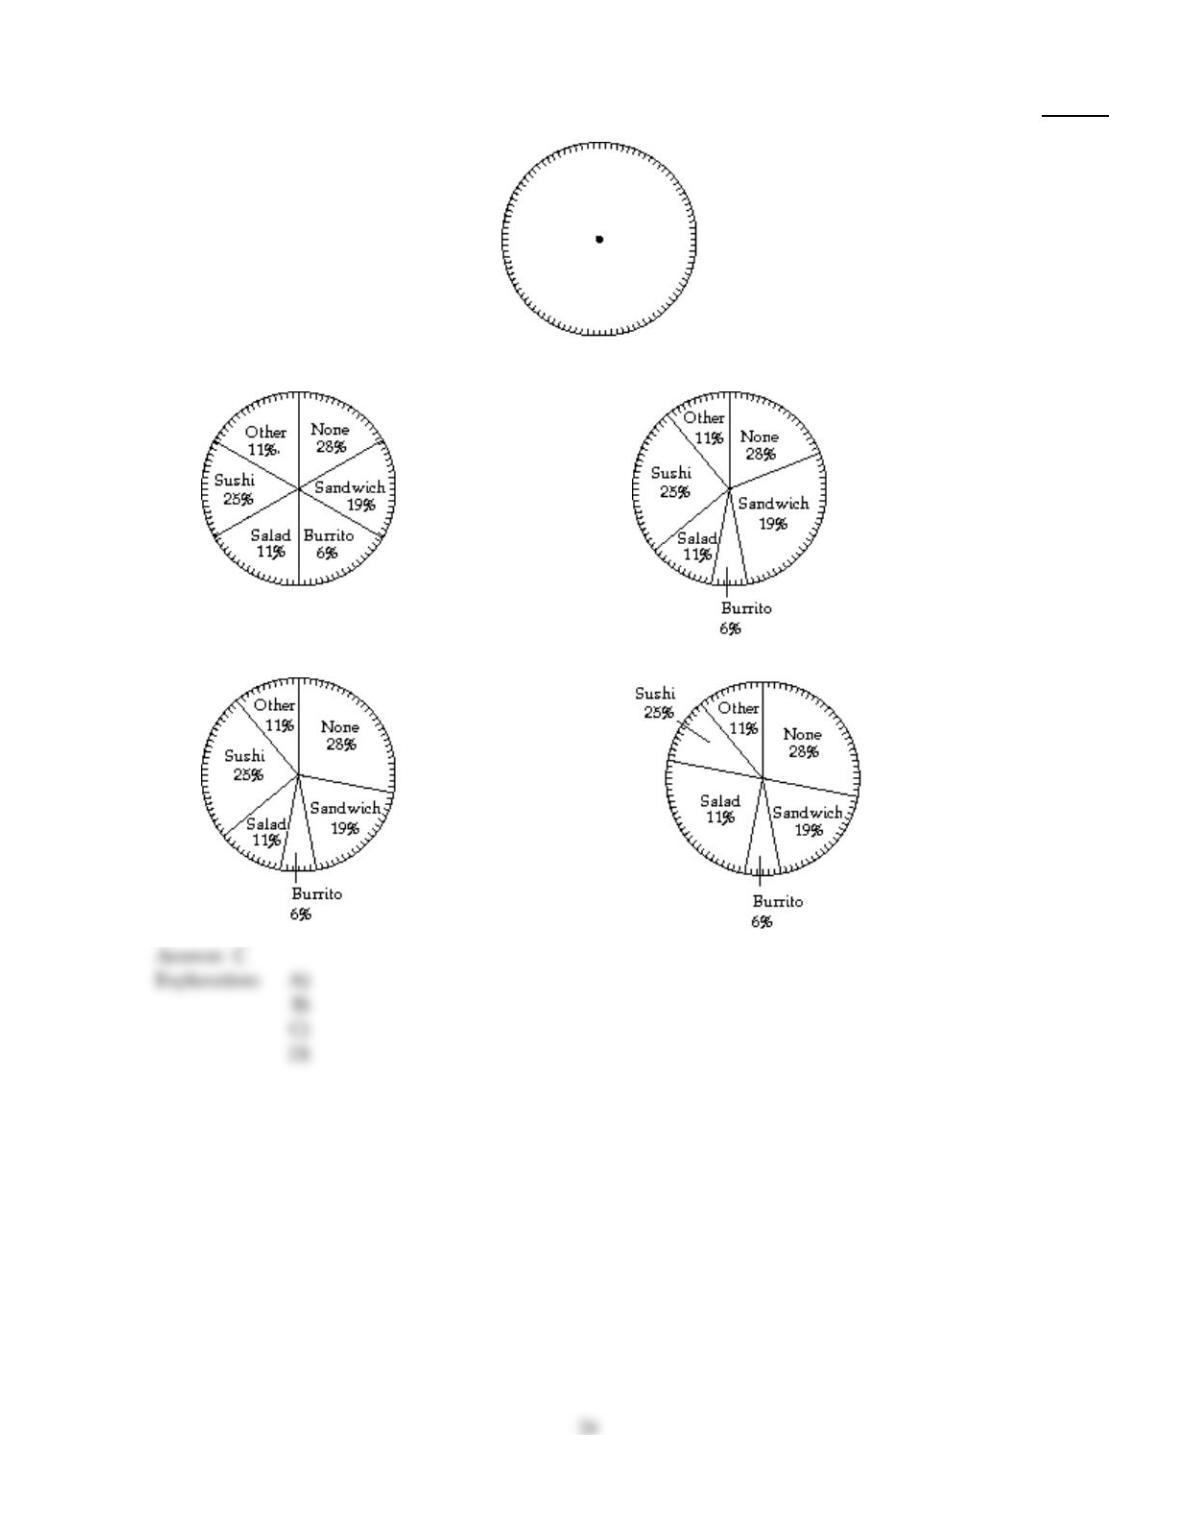
52)
Main lunch entrees chosen by employees of one company:
None: 28%
Sandwich: 19%
Burrito: 6%
Salad: 11%
Sushi: 25%
Other: 11%
52)
A)
B)
C)
D)
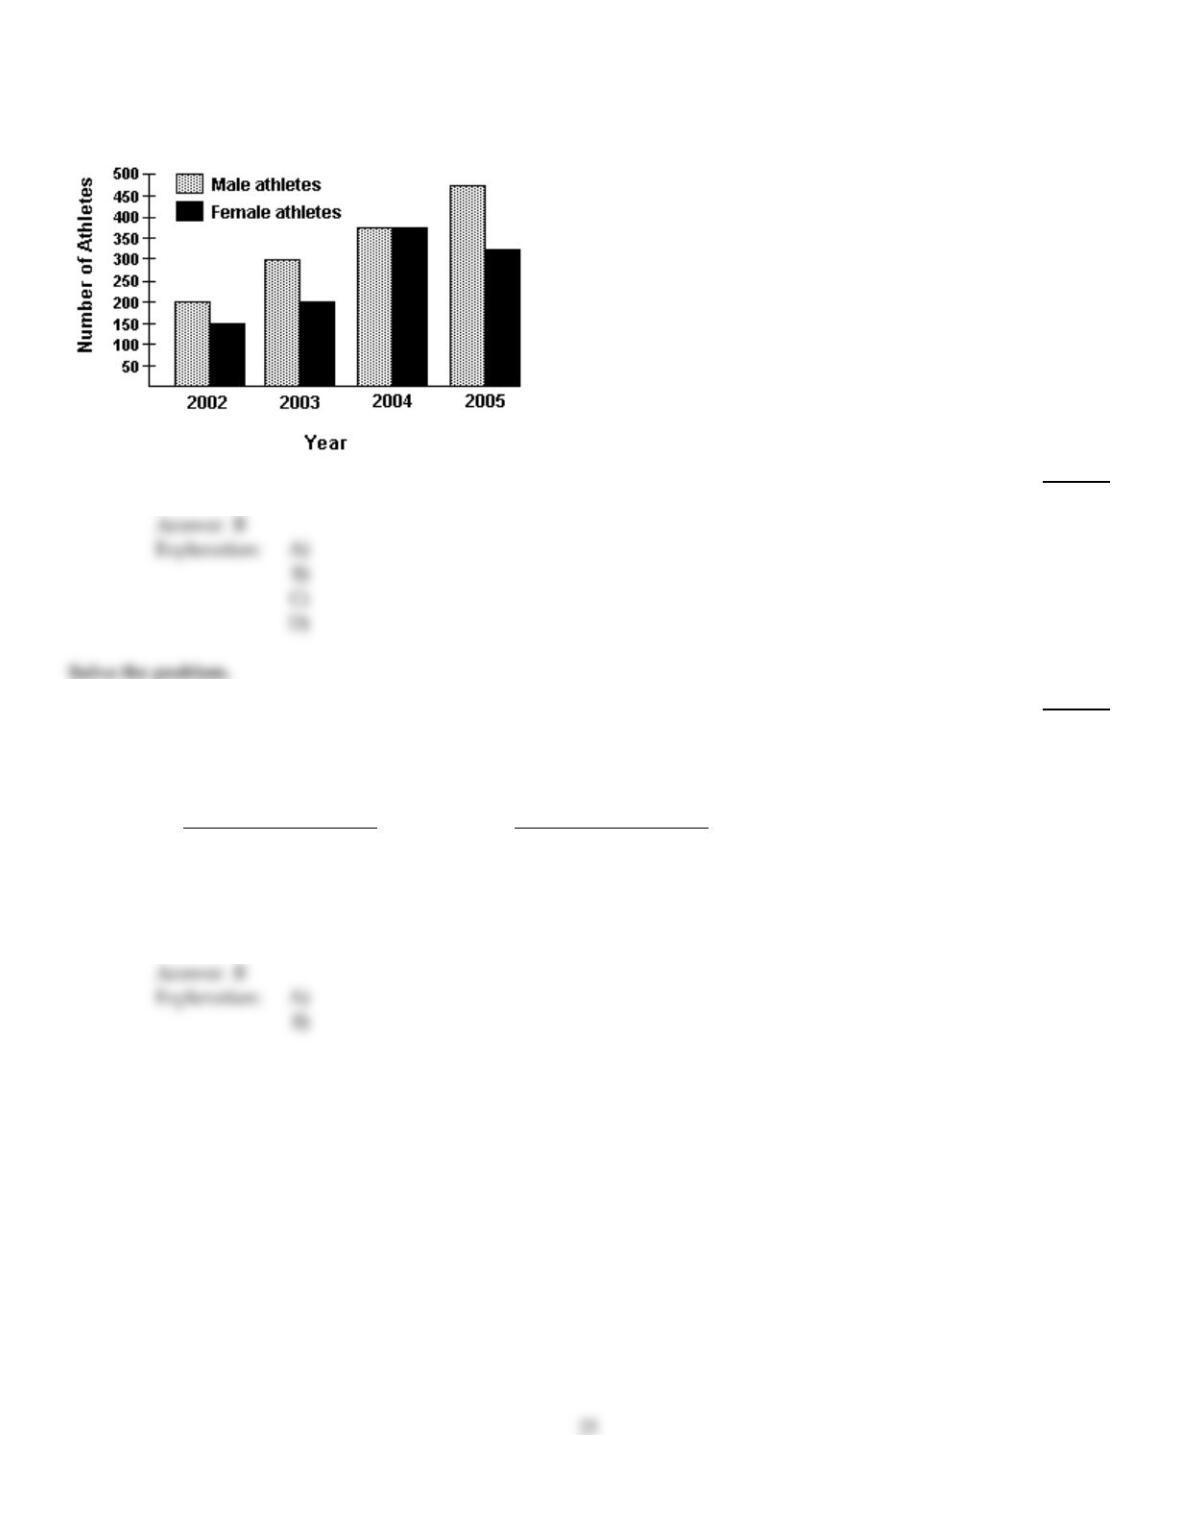
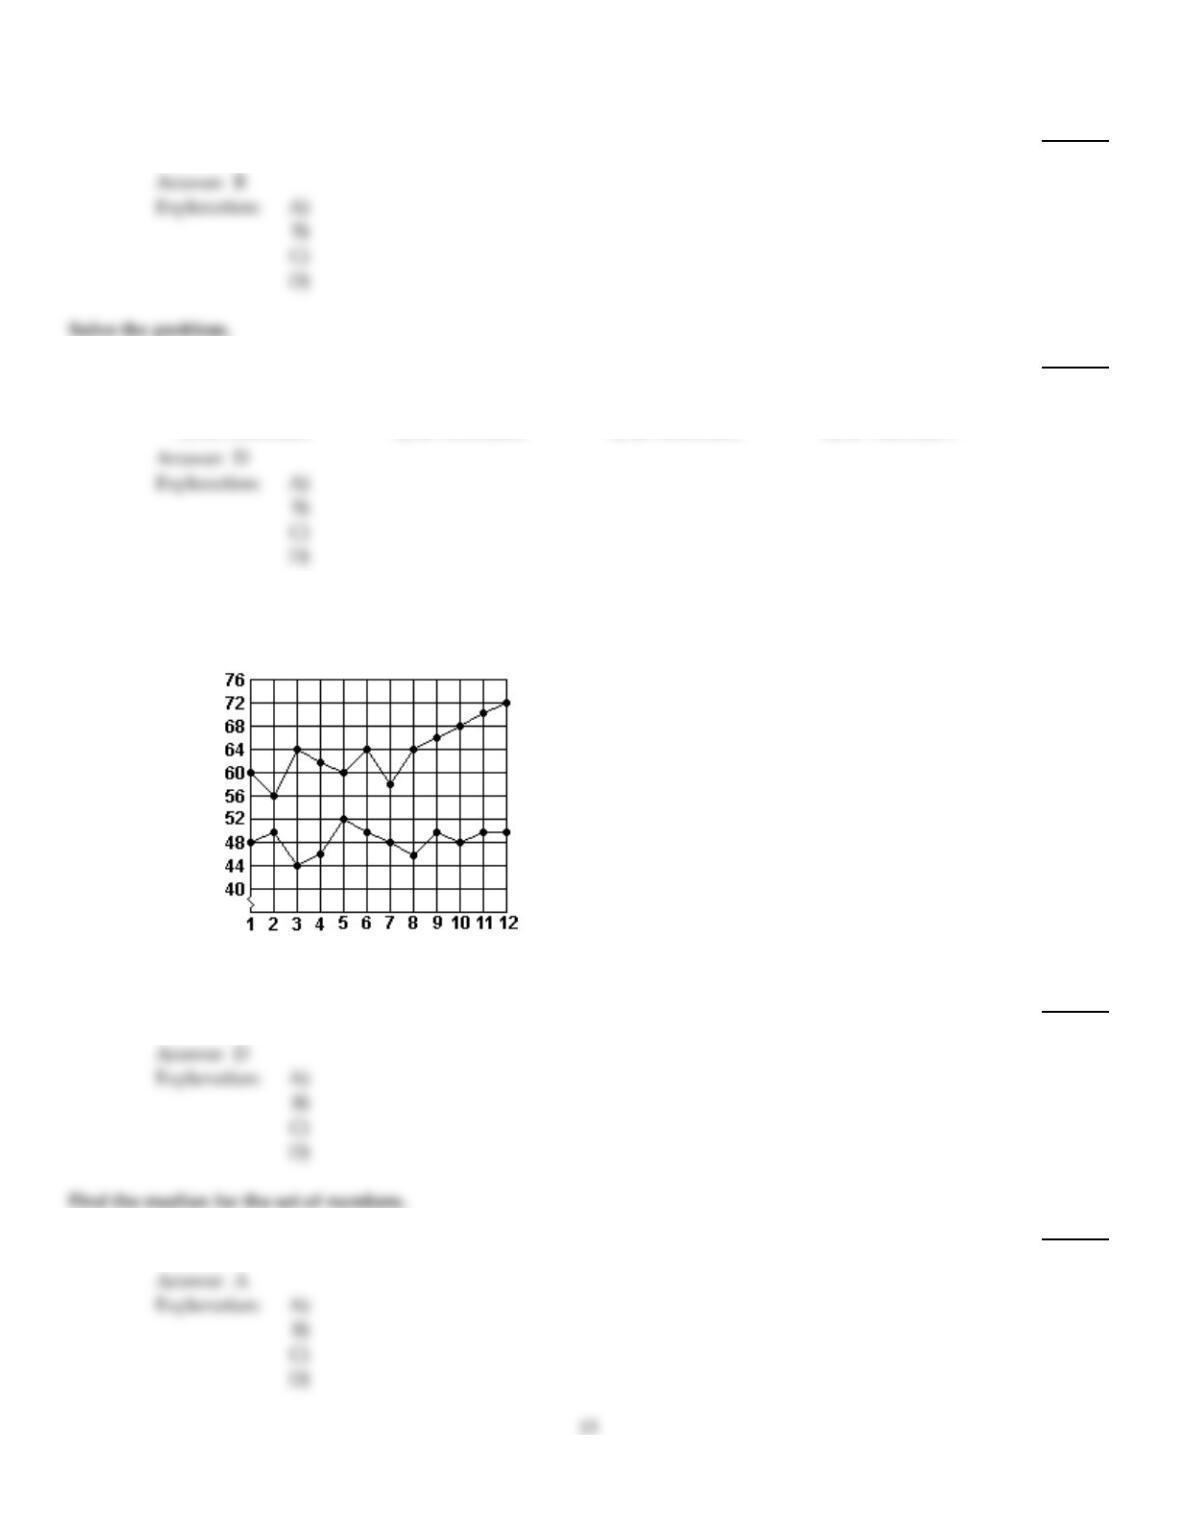
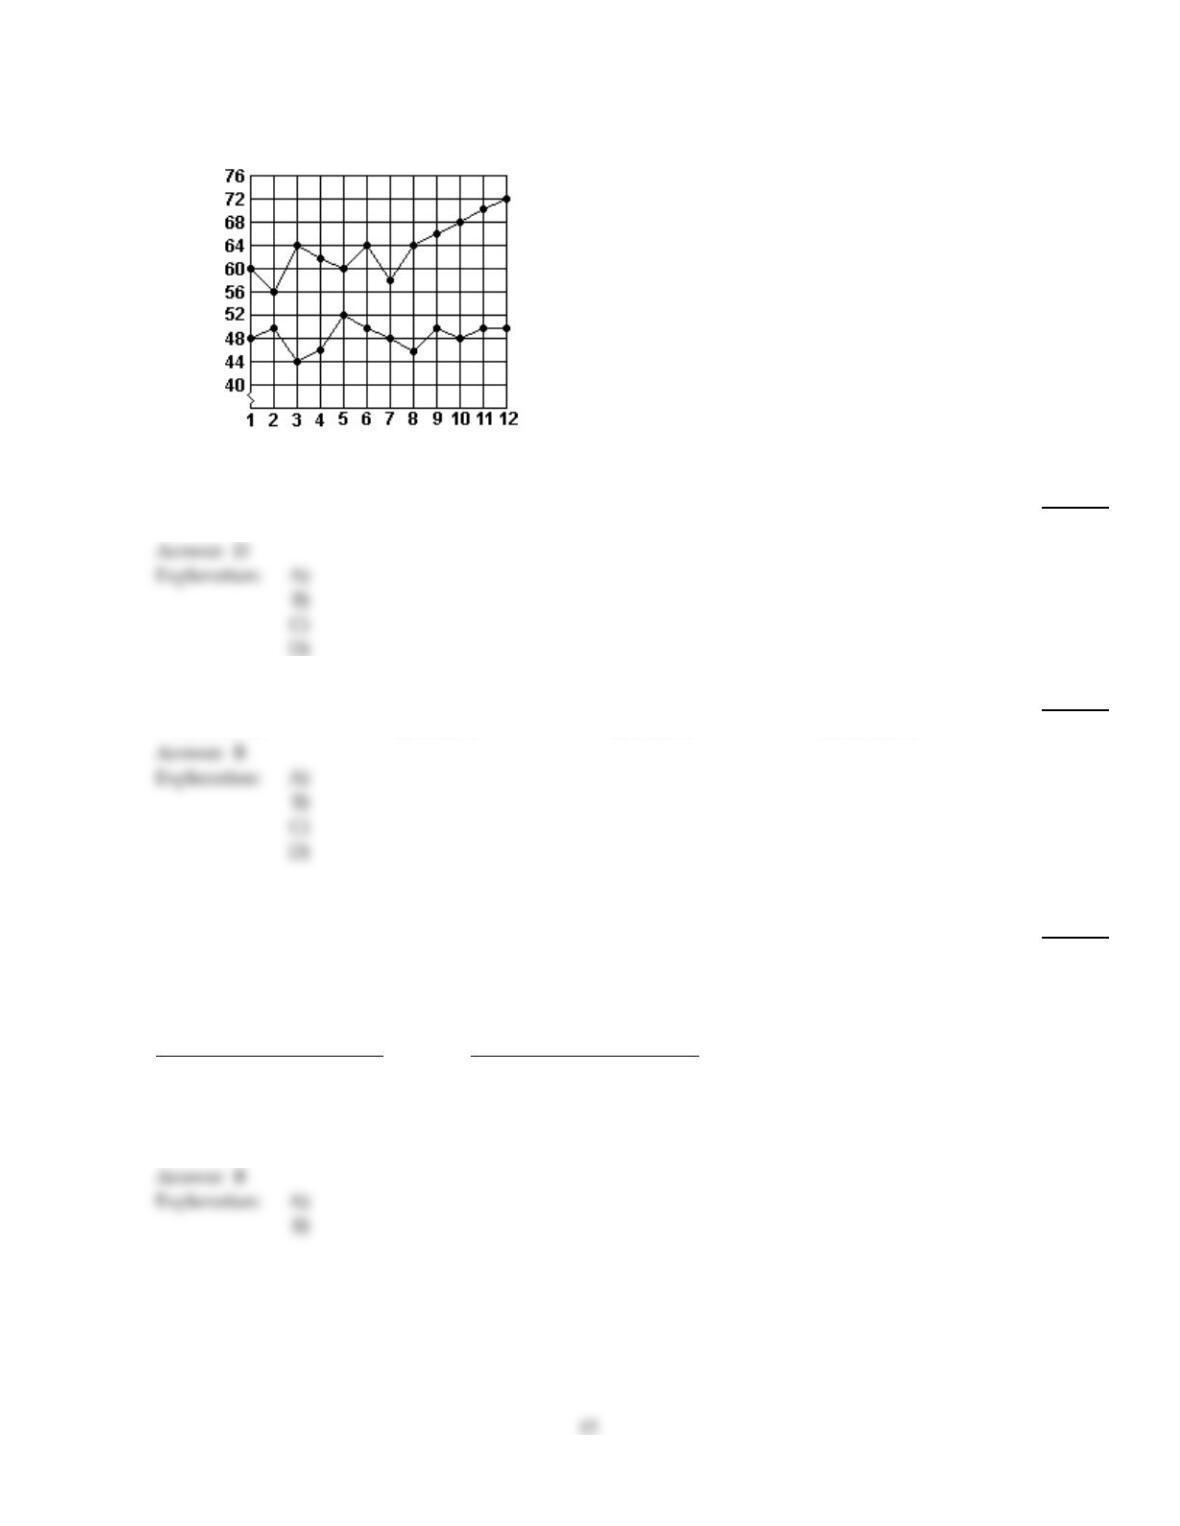
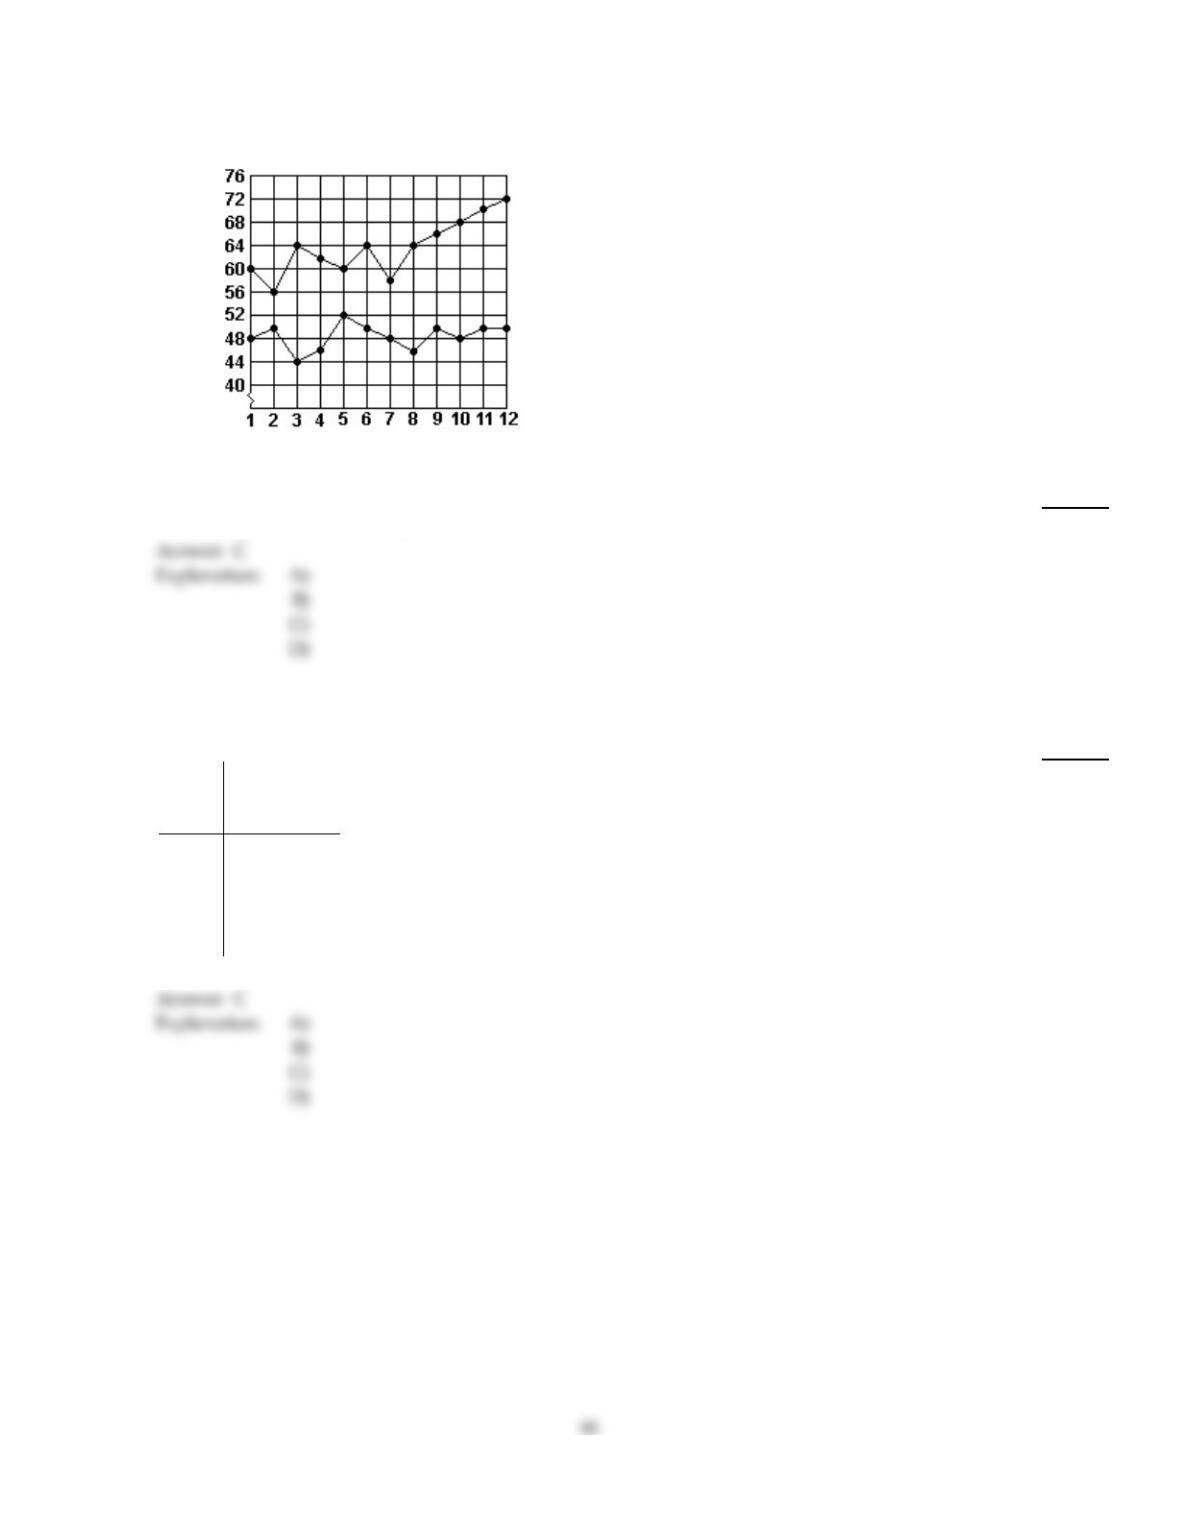
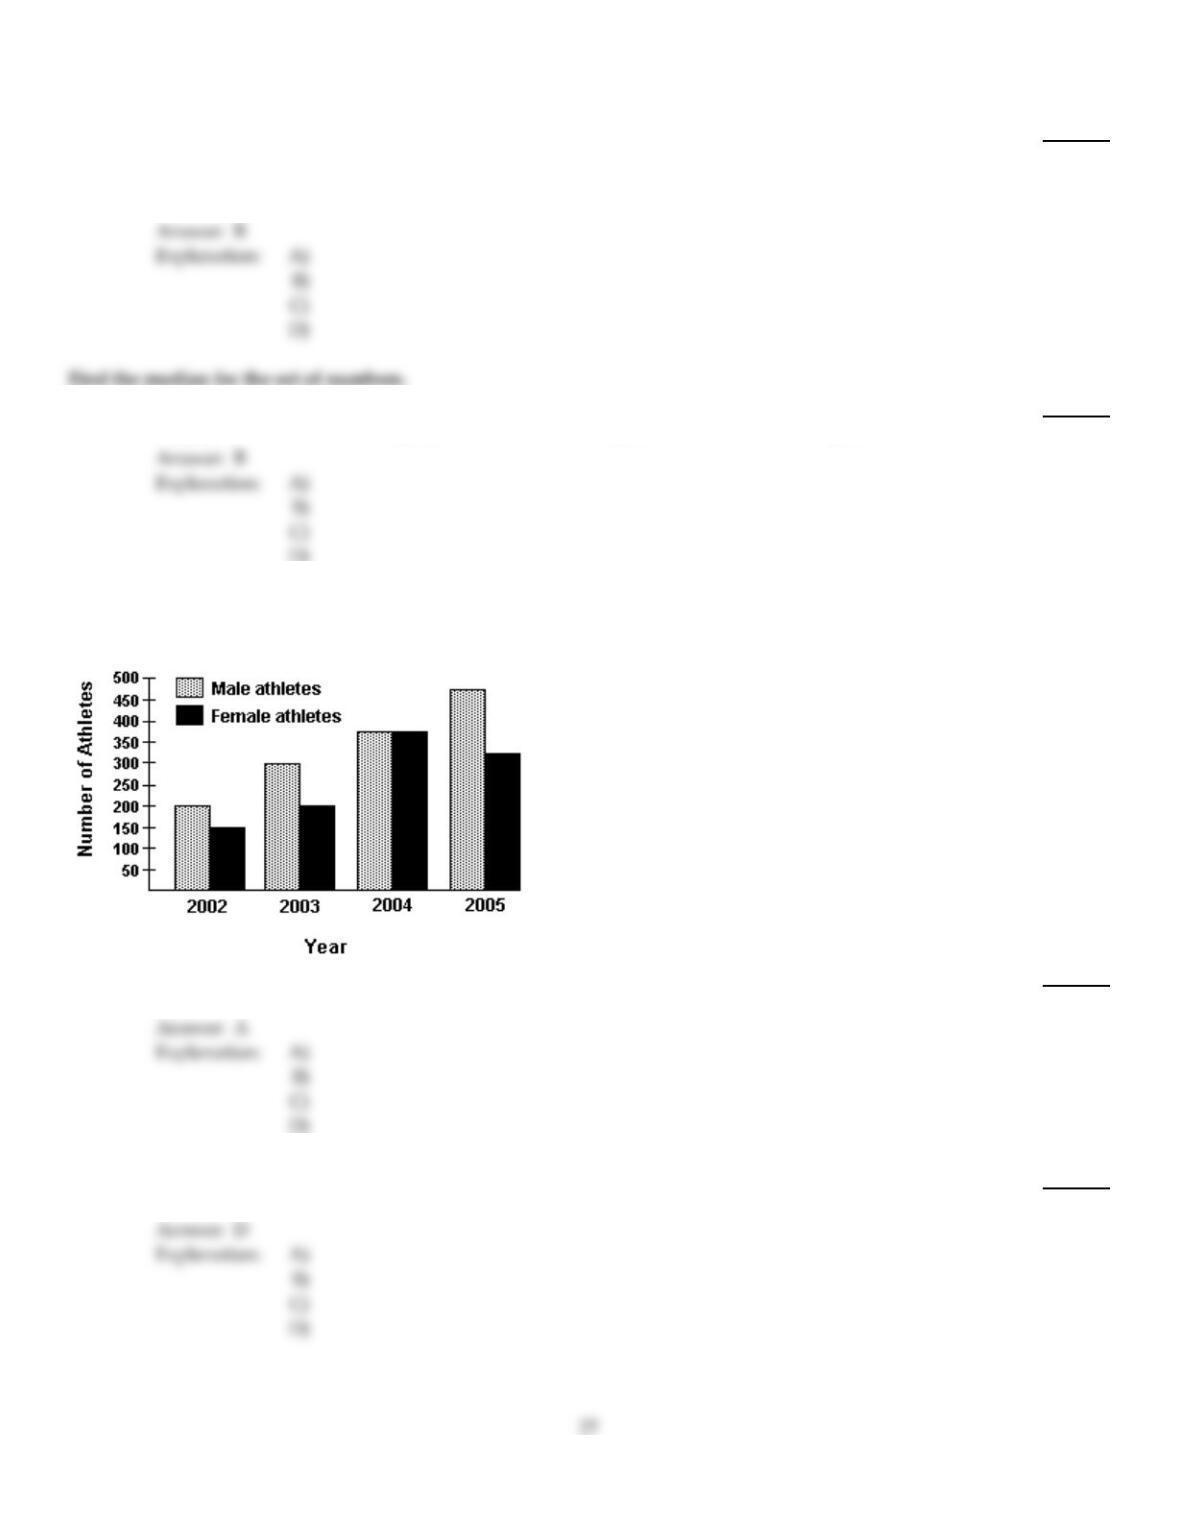
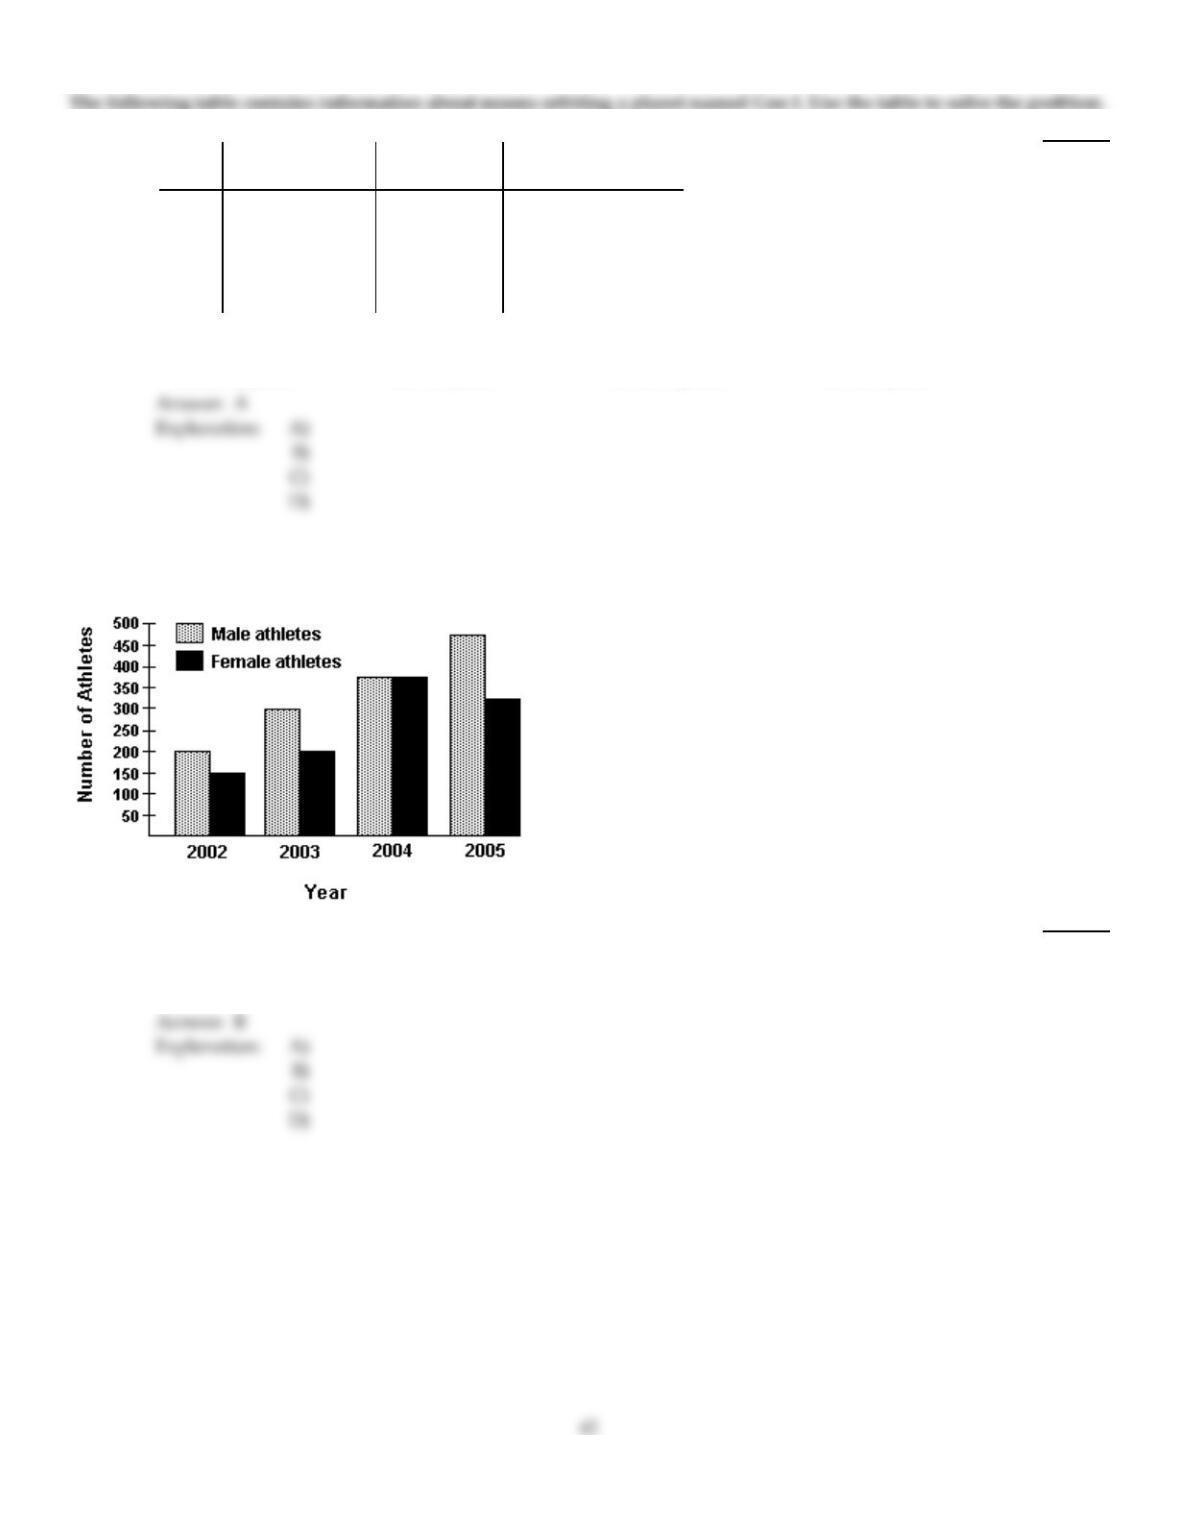
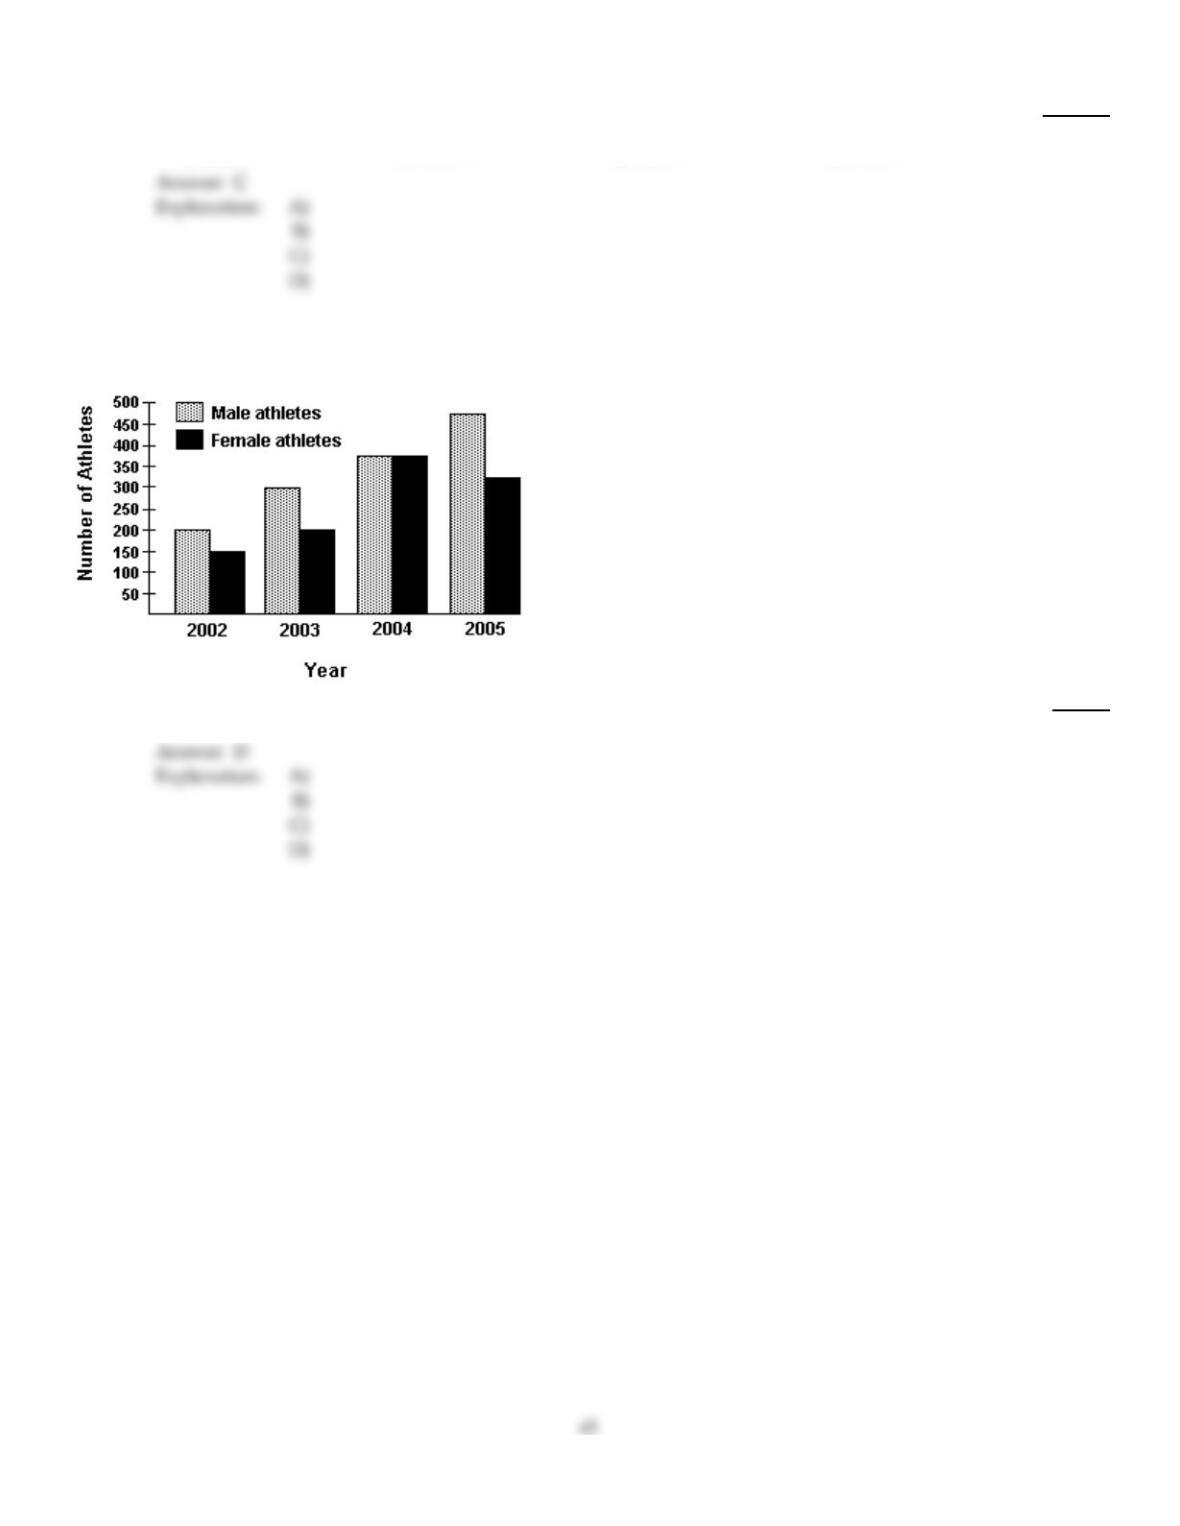
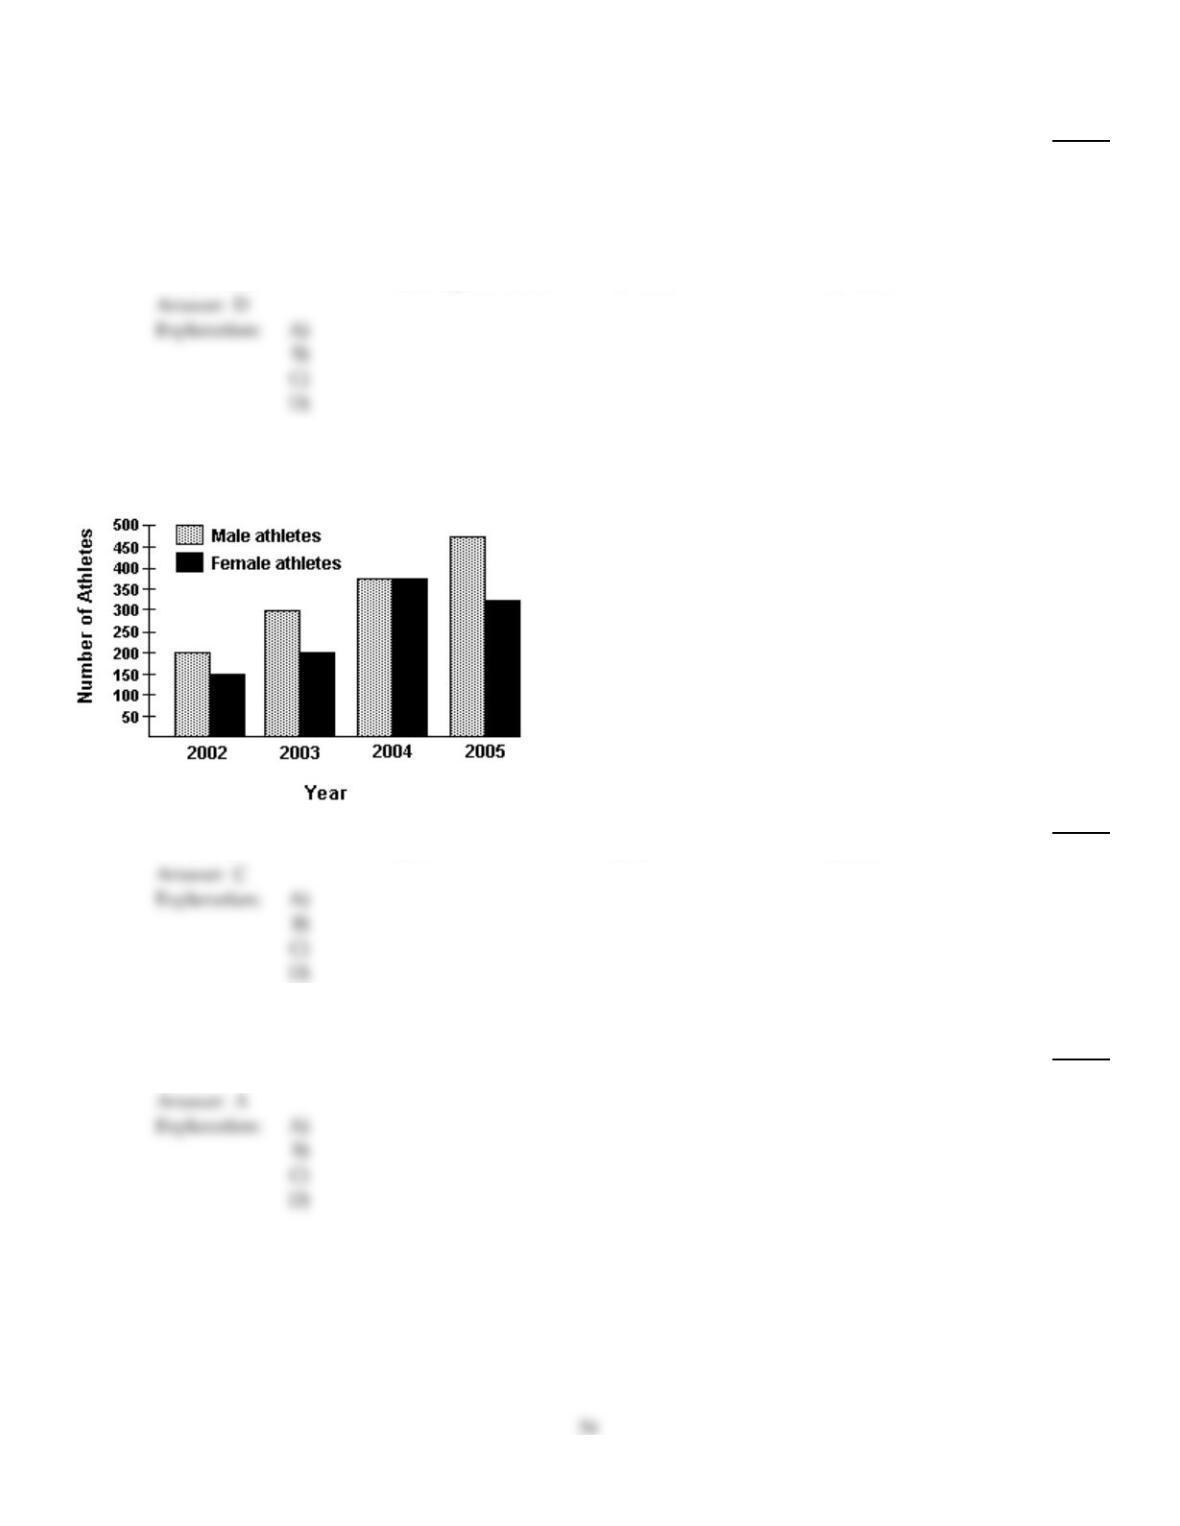
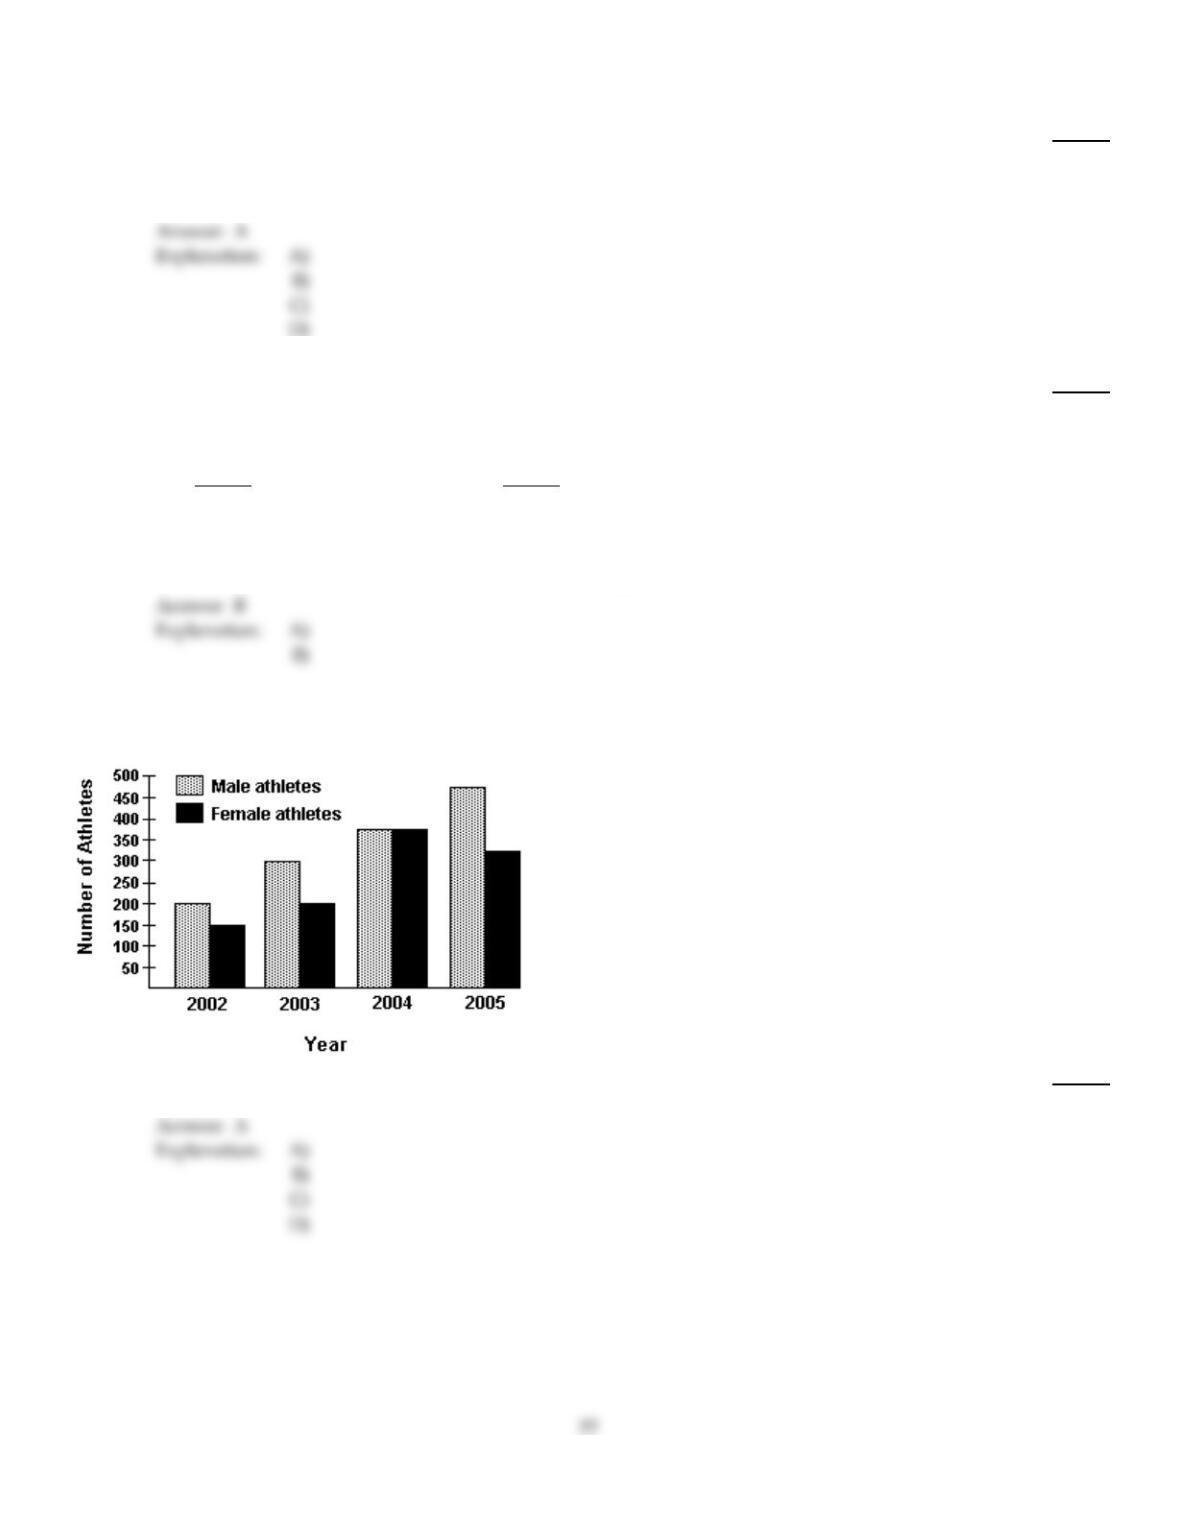
Refer to the double–bar graph below which shows the number of male and female athletes at a university over a
four–year period. Solve the problem.
53)
What was the percent of decrease in the number of female athletes from 2004 to 2005?
53)
A)
18.75%
B)
13.3%
C)
50%
D)
25%
54)
Patty experiments to see which of two breeds of sheep produces thicker wool fleeces. She raises
both under similar conditions and measures the fleece thickness, in centimeters, as follows. Which
type of sheep produces better wool fleece?
Sheep Breed X Sheep Breed Y
Fleece Thickness, in cm Fleece Thickness, in cm
3.8 2.2 5.7 2.2 2.2 4.7 3.6 2.7
3.6 4.7 4.5 4.5 2.7 4.7 5.6 4.5
3.6 2.7 2.2 3.6 3.6 5.7 3.8 2.2
3.8 4.5 2.2 3.8 2.2 4.5 3.8 4.7
54)
A)
Breed X
B)
Breed Y
The following table contains information about moons orbiting a planet named Geo I. Use the table to solve the problem.
55)
Moon Average Distance
from Geo I (km) Diameter (km) Time of Revolution
(in Earth time, years)
Luna 1 4000 412 1.00
Luna 2 5200 2181 3.08
Luna 3 90,000 315 5.44
Luna 4 129,600 727 43.83
Luna 5 297,000 1139 112.86
What is the average time of revolution of the moons?
55)
A)
5.44 years
B)
3.08 years
C)
33.24 years
D)
954.80 years
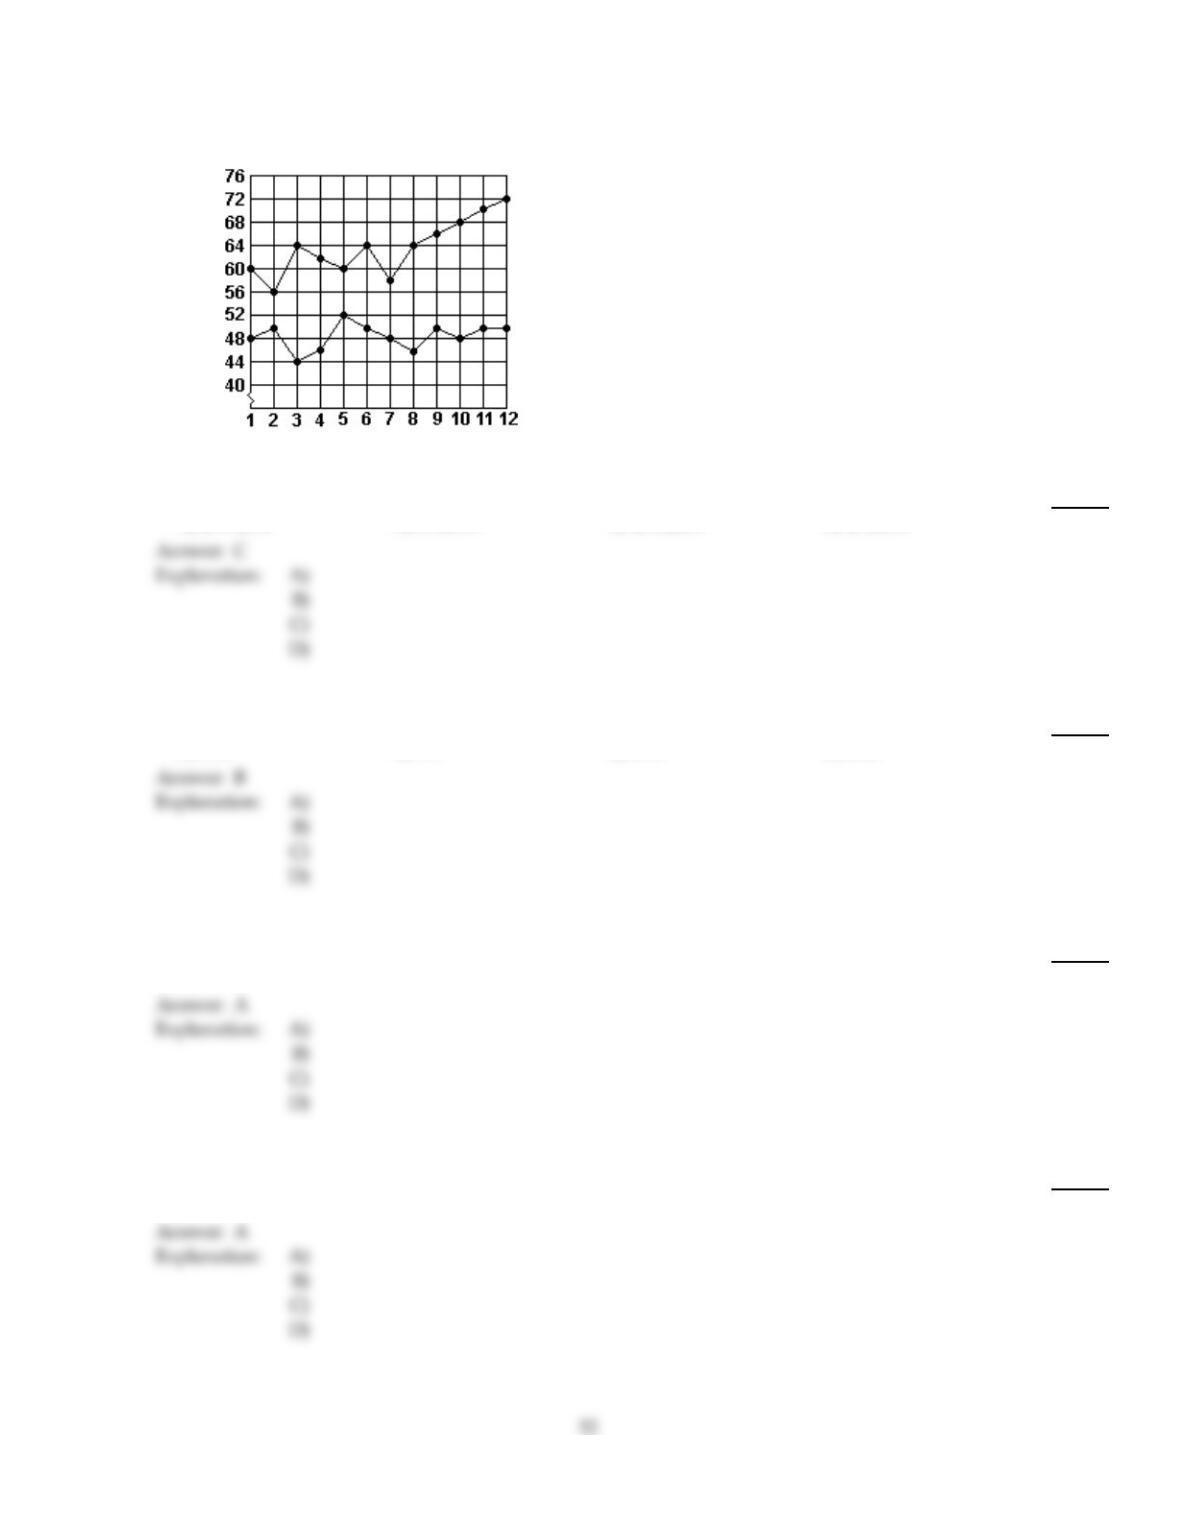
Use the graph to answer the question.
Big “D” Sales (2008–2009)
2009
Sales
(Thousands of $)
2008
Month
56)
What was the percent of increase in sales between month 2 and month 12 of 2009? Round your
answer to the nearest tenth.
56)
A)
25.0%
B)
28.6%
C)
14.3%
D)
22.2%
Solve the problem.
57)
Bengisu was pregnant 270 days and 263 days for her first two pregnancies. In order for Bengisu’s
average pregnancy to equal a national average of 265 days, how long must her third pregnancy
last?
57)
A)
267 days
B)
262 days
C)
241 days
D)
266 days
58)
10, 22, 30, 52, 66, 68, 86
58)
A)
48
B)
52
C)
30
D)
66
D)
Refer to the double–bar graph below which shows the number of male and female athletes at a university over a
four–year period. Solve the problem.
59)
Find the increase in the number of male athletes from 2003 to 2005.
59)
A)
175
B)
150
C)
275
D)
125
D)
60)
How many students were involved in athletics in 2004?
60)
A)
650
B)
700
C)
800
D)
750
D)
D)
Find any modes that exist.
61)
5, 9, 54, 3, 2, 8, 35, 1, 4, 16
61)
A)
8
B)
13.1
C)
9
D)
No mode
The following table contains information about moons orbiting a planet named Geo I. Use the table to solve the problem.
62)
Moon Average Distance
from Geo I (km) Diameter (km) Time of Revolution
(in Earth time, years)
Luna 1 4000 414 1.00
Luna 2 5200 2163 3.08
Luna 3 80,000 307 5.44
Luna 4 115,200 721 38.96
Luna 5 264,000 1135 100.32
Which moons have average distance from Geo I less than ten thousand kilometers?
62)
A)
None
B)
Luna 1 and Luna 2
C)
Luna 3, Luna 4, and Luna 5
D)
Luna 1 only
The bar graph below shows the number of students by major in the College of Arts and Sciences. Answer the question.
63)
What is the average number of students taking History, English, and Math? Round your answer to
the nearest whole student if necessary.
63)
A)
300 students
B)
367 students
C)
225 students
D)
1000 students
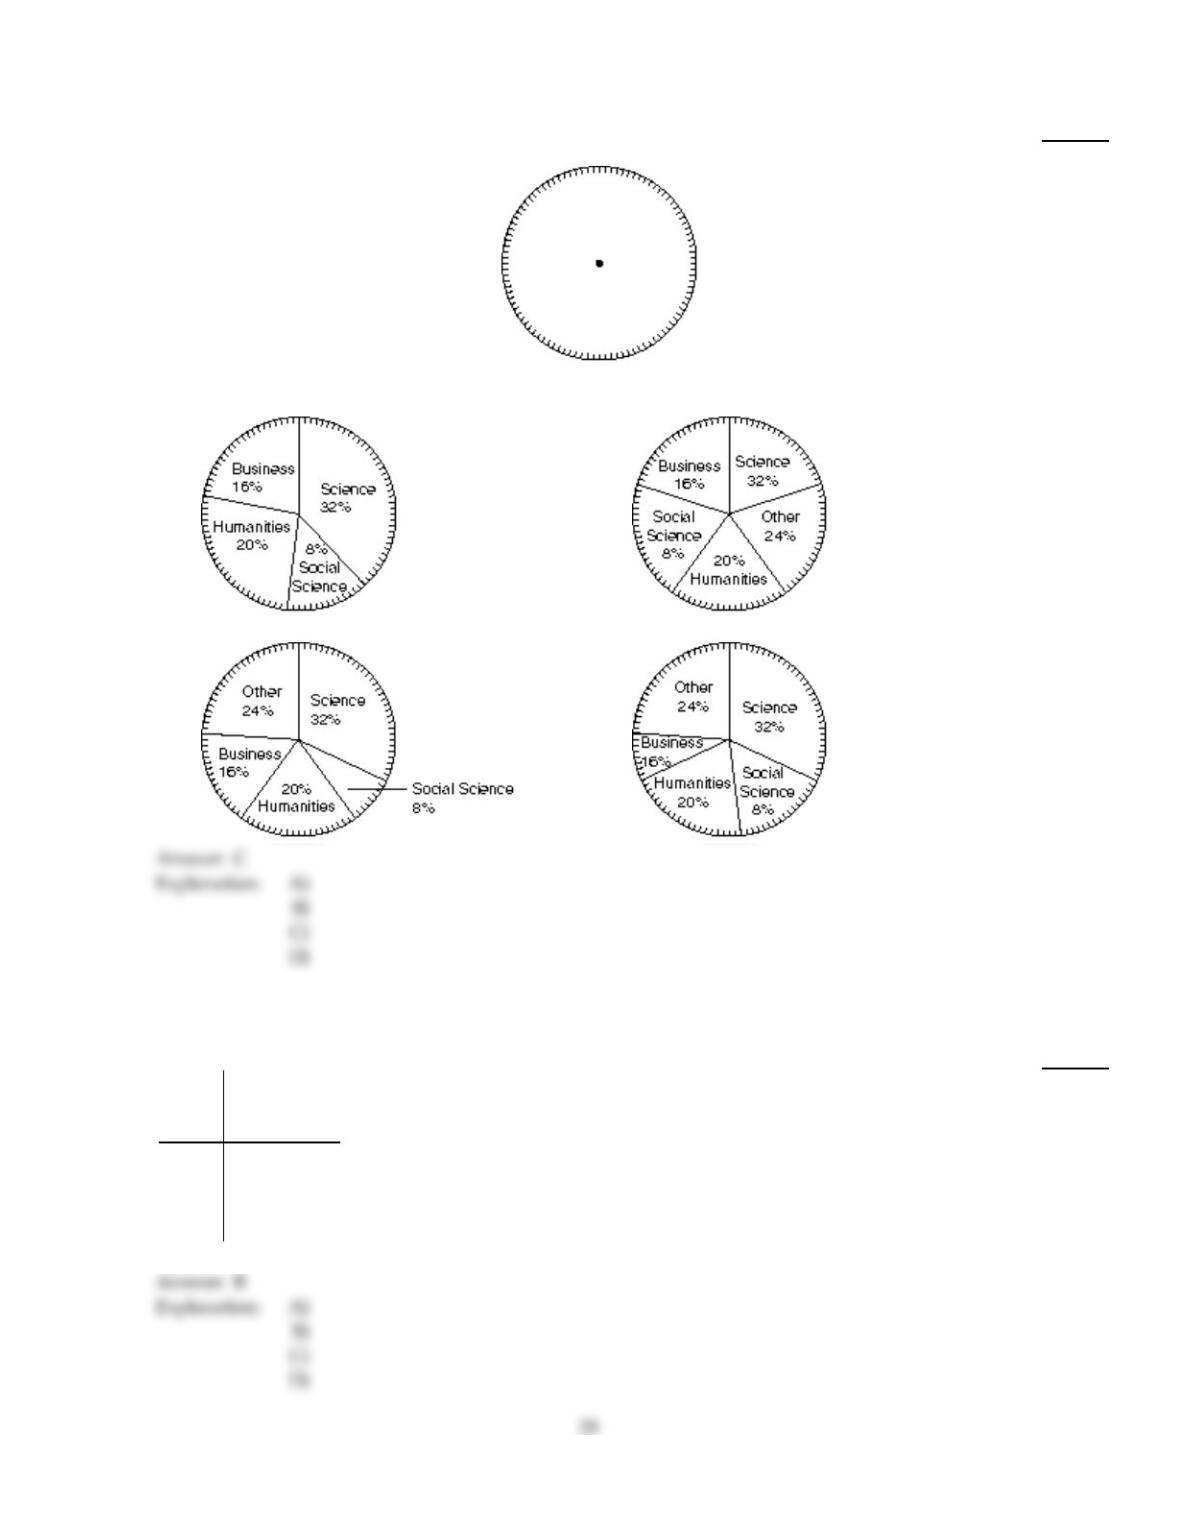
Use the information to complete a circle graph. Note that the circle is divided into 100 equal sections.
64)
Intended major of high school students:
Science: 32%
Social Science: 8%
Humanities: 20%
Business: 16%
Other: 24%
64)
A)
B)
C)
D)
Given the grades of a student for one semester, find the grade point average. Assume that the grade point values are 4.0
for an A, 3.0 for a B, and so on. Round to the nearest tenth.
65)
Grades
Number of
Credit Hours
in Course
C 3
B 1
A 5
A 5
65)
A)
8.3
B)
3.5
C)
2.3
D)
3.7
The bar graph below shows the number of students by major in the College of Arts and Sciences. Answer the question.
66)
What is the median number of students taking English, Science, and Math?
66)
A)
400 students
B)
150 students
C)
300 students
D)
200 students
67)
An experiment is done to compare the strength of two types of fishing lines. Several lengths of each
type were tested and the results are in the two tables below. Which type of fishing line is better?
Line X Line Y
Strength, in pounds Strength, in pounds
104 102 105 104 105 106
104 102 106 113 104 113
102 113 102 104 104 106
67)
A)
Line Y
B)
Line X
68)
$85, $75, $32, $75, $29, $85
68)
A)
$85
B)
No mode
C)
$75
D)
$85, $75
The bar graph below shows the number of students by major in the College of Arts and Sciences. Answer the question.
69)
How many more students are majoring in math than in science?
69)
A)
150
B)
50
C)
100
D)
10
Find the average.
70)
$63.68, $95.14, $81.15, $86.35, $63.68
70)
A)
$65.00
B)
$63.68
C)
$81.15
D)
$78.00
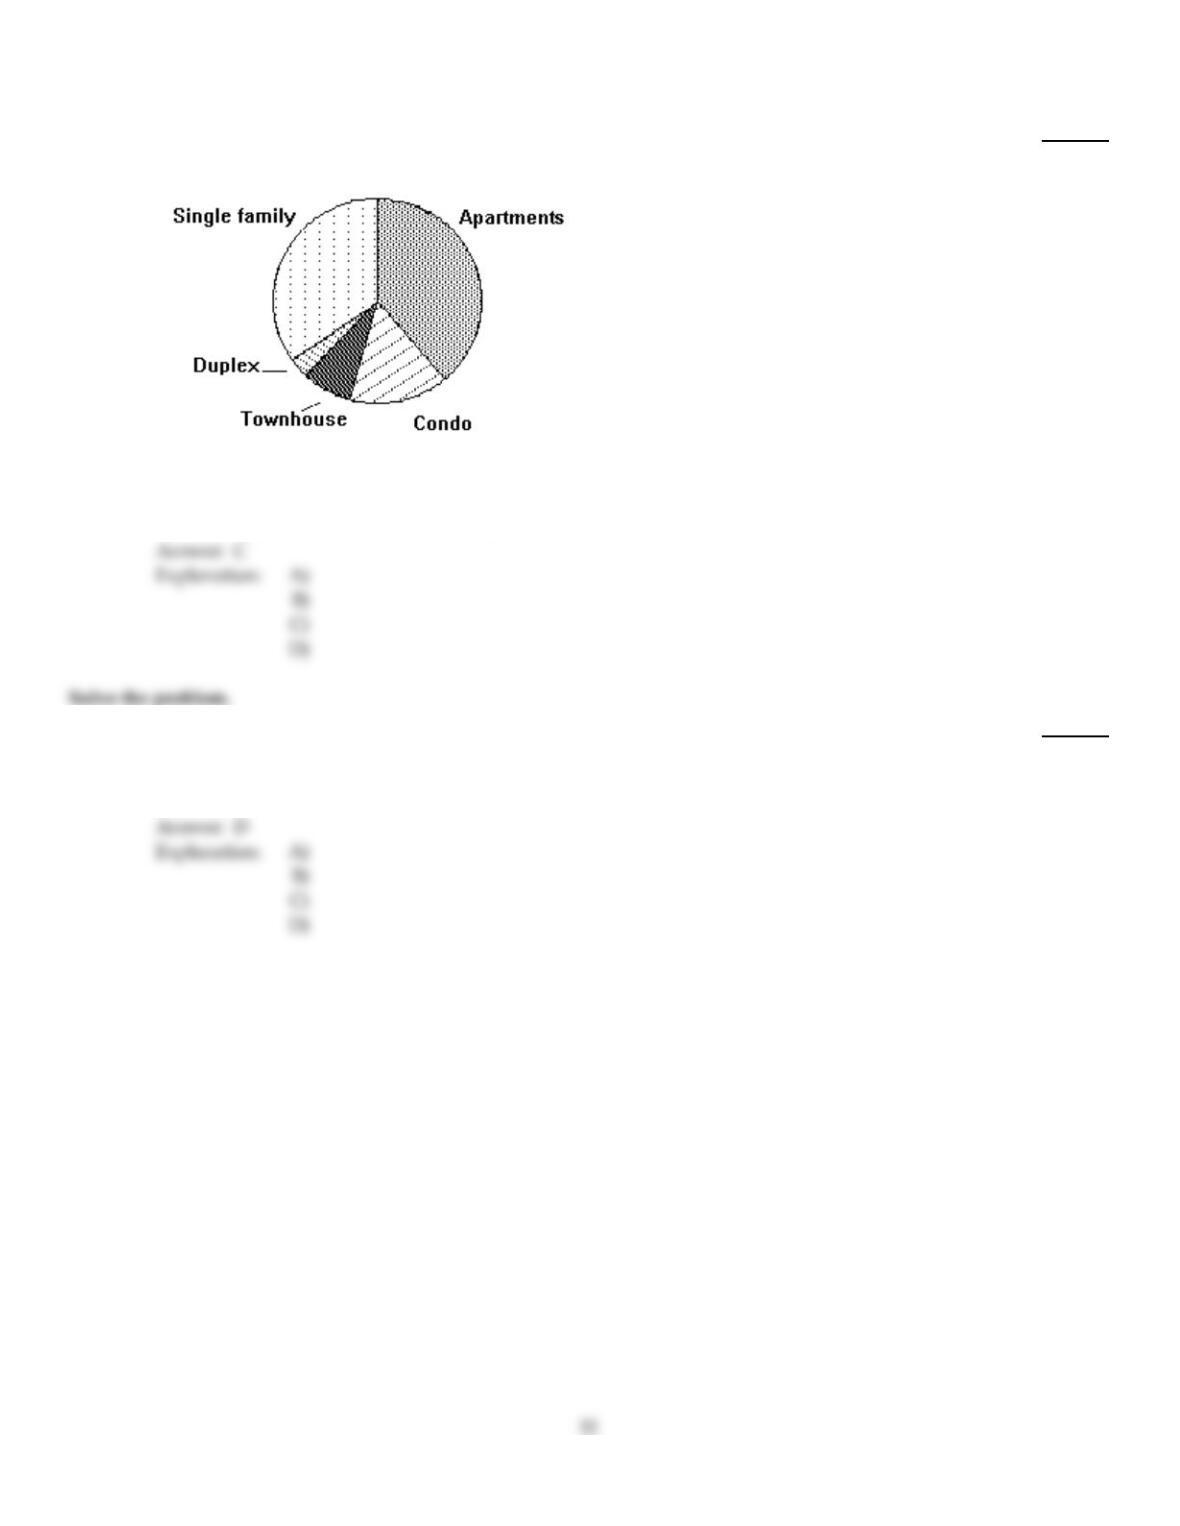
Use the circle graph to solve the problem.
71)
The circle graph shows the percent of the total population of 52,400 of Springfield living in the
given types of housing.
40%29%
5%
10%16%
Find the number of people who live in condos. Round your result to the nearest whole number.
71)
A)
16 people
B)
5764 people
C)
8384 people
D)
44,016 people
72)
Anthony wanted to buy a particular kind of cheese. He checked in five different stores and found
the following prices per pound: $6.30, $5.60, $6.60, $5.80, $5.60. What was the average price per
pound?
72)
A)
$6.08
B)
$5.80
C)
$6.30
D)
$5.98
The bar graph below shows the number of students by major in the College of Arts and Sciences. Answer the question.
73)
Which major has about 150 students?
73)
A)
English
B)
Math
C)
Science
D)
History
74)
An experiment is done to compare the average fuel economy of two models of cars. Several cars of
each model were tested under similar conditions. The results are in the two tables below. Which car
model is better?
Car X Car Y
Fuel Economy, in mpg Fuel Economy, in mpg
22 20 26 25 22 18 20 22
20 20 26 26 26 25 20 25
22 25 18 22 20 18 20 25
74)
A)
Car Y
B)
Car X
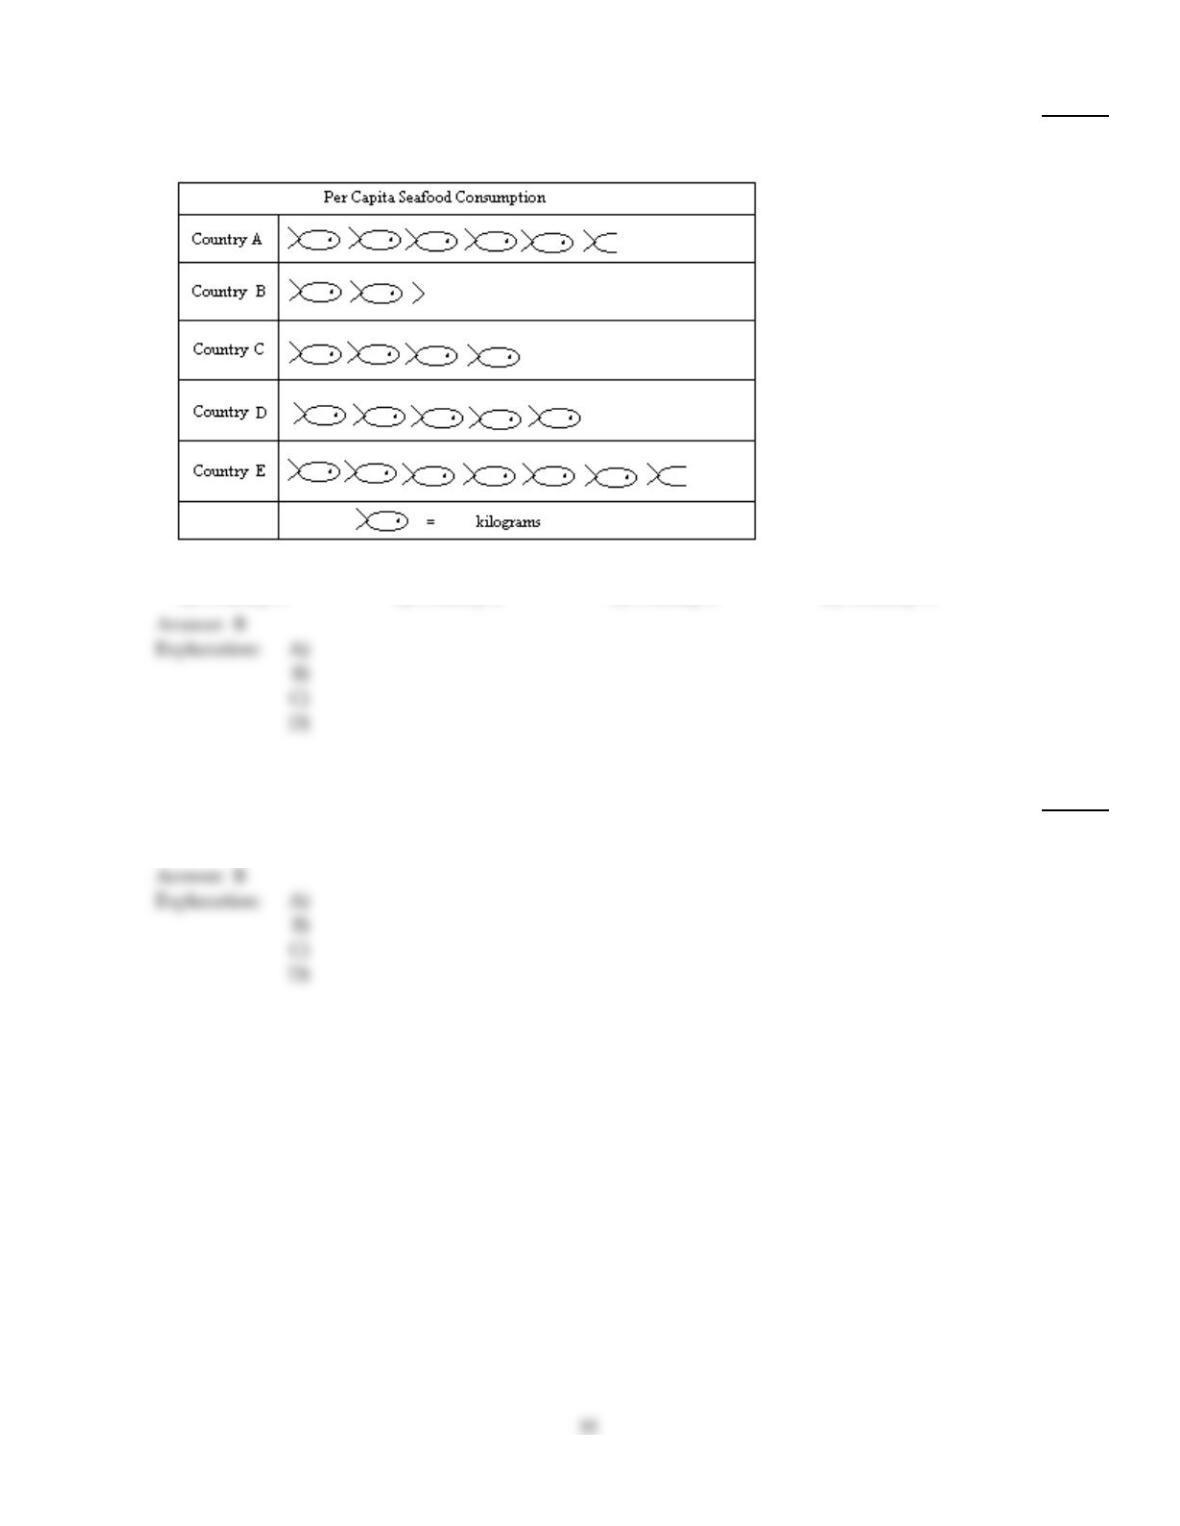
Use the pictograph to answer the question.
75)
For selected countries, this pictograph shows approximately how many kilograms of seafood are
consumed by each person (per capita) annually.
862
What is the approximate seafood consumption in Country E?
75)
A)
5172 kilograms
B)
6034 kilograms
C)
5818.5 kilograms
D)
5387.5 kilograms
76)
For selected countries, this pictograph shows approximately how many kilograms of seafood are
consumed by each person (per capita) annually.
365
Which country consumes the most seafood?
76)
A)
Country C
B)
Country E
C)
Country B
D)
Country A
Solve the problem.
77)
To get a C in history, Nandan must average 71 on four tests. Scores on the first three tests were 66,
78, and 63. What is the lowest score that Nandan can get on the last test and still receive a C?
77)
A)
6
B)
77
C)
69
D)
70
Use the circle graph to solve the problem.
78)
The circle graph below gives the number of residents in the residence halls at the state university.
140
105 290
100
130
215
Write the ratio as a fraction in lowest terms of the number of residents at Brown to the number of
students at Carver.
78)
A)
15
28
B)
4
3
C)
3
4
D)
3
28
79)
How many students are majoring in English?
79)
A)
400
B)
450
C)
500
D)
350
Given the grades of a student for one semester, find the grade point average. Assume that the grade point values are 4.0
for an A, 3.0 for a B, and so on. Round to the nearest tenth.
80)
Grades
Number of
Credit Hours
in Course
A 4
A 5
C 1
80)
A)
3.8
B)
11.0
C)
4.1
D)
4.4
Solve the problem.
81)
An experiment is done to determine which of two cleaners cleans better. Twelve lab technicians test
each kind of cleaner and give it a rating from 1 to 10. The results are in the two tables below. Which
type of cleaner is better?
Cleaner X Cleaner Y
10 6 8 6 6 8 8 2
6 2 10 6 2 6 6 2
6 6 8 2 6 2 10 6
81)
A)
Cleaner X
B)
Cleaner Y
82)
Moon Average Distance
from Geo I (km) Diameter (km) Time of Revolution
(in Earth time, years)
Luna 1 3000 412 0.75
Luna 2 3900 2187 2.31
Luna 3 80,000 317 4.08
Luna 4 115,200 729 38.96
Luna 5 264,000 1141 100.32
How much further from Geo I is Luna 4 than Luna 2?
82)
A)
3900 km
B)
112,200 km
C)
115,200 km
D)
111,300 km
Use the circle graph to solve the problem.
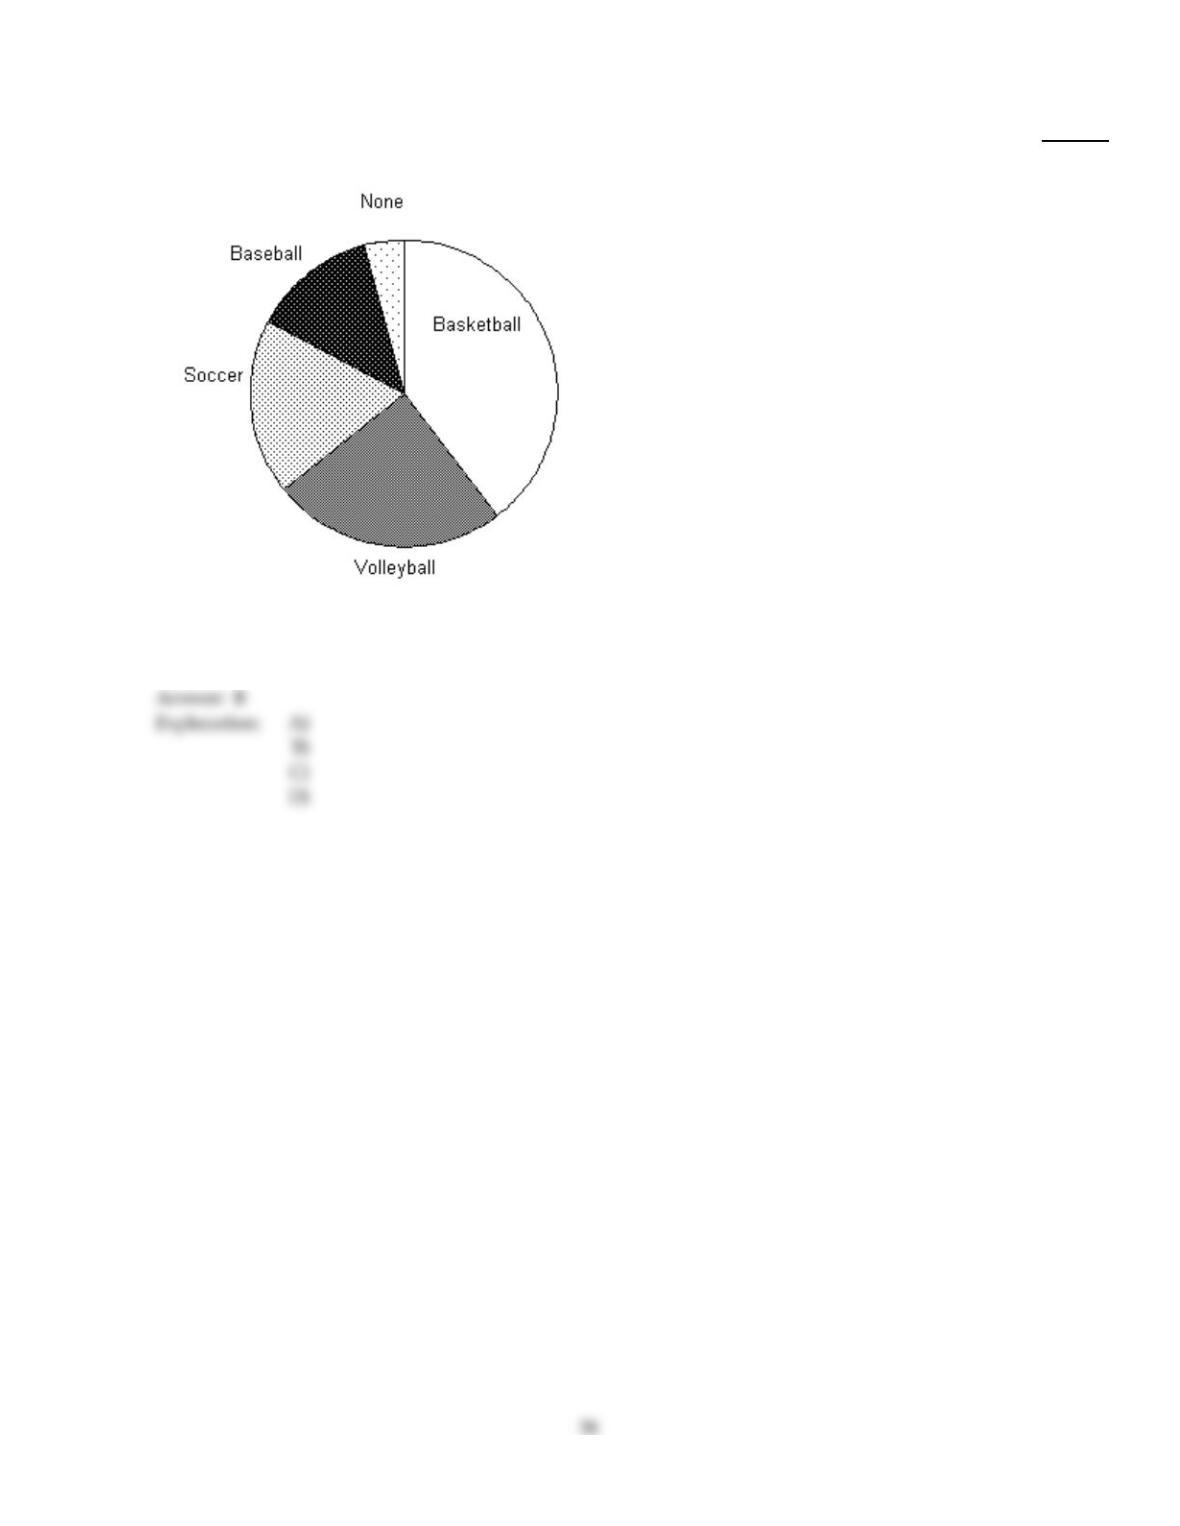
83)
There are 20,000 students attending the local university. The circle graph shows the percentage of
those students who attend different sporting events.
6%
13%
39%
19%
23%
What percentage of students do not attend Soccer or Volleyball matches?
83)
A)
19%
B)
58%
C)
42%
D)
23%
Refer to the double–bar graph below which shows the number of male and female athletes at a university over a
four–year period. Solve the problem.
84)
Which year had the greatest number of male athletes? What was the total number of male athletes
that year?
84)
A)
2005; 325 athletes
B)
2005; 500 athletes
C)
2005; 475 athletes
D)
2004; 375 athletes
The bar graph below shows the number of students by major in the College of Arts and Sciences. Answer the question.
85)
The science department is planning to buy some new equipment. They want to make sure that
there is one of the new machines for every 5 students majoring in science. If each machine costs $
550, how much should they budget for the new equipment?
85)
A)
$22,000
B)
$19,250
C)
$13,750
D)
$16,500
Use the graph to answer the question.
Big “D” Sales (2008–2009)
2009
Sales
(Thousands of $)
2008
Month
86)
What were the total sales for the first 6 months of 2009?
86)
A)
$286,000
B)
$366,000
C)
$302,000
D)
$64,000
Solve the problem.
87)
A local farmer takes soil samples each year in each field he works. The number of soil samples
taken per field in a certain year is: 5, 9, 29, 3, 2, 8, 37, 1, 4, 16. Find the mode of the data if it exists.
87)
A)
no mode
B)
8 samples
C)
9 samples
D)
10.8 samples
88)
To get an A in biology, Fred must average 90 on six quizzes. Scores on the first five quizzes were 94,
85, 87, 95, and 97. What is the lowest score that Fred can get on the last quiz and still receive an A?
88)
A)
96
B)
82
C)
90
D)
92

The bar graph below shows the number of students by major in the College of Arts and Sciences. Answer the question.
89)
About how many students are in the College of Arts and Sciences?
89)
A)
1050
B)
1100
C)
1225
D)
1325
90)
An experiment is done to compare printer cartridge quality. Two kinds of printer cartridges were
tested to see how many pages of text they could produce before needing to be replaced. Which type
of printer cartridge is better?
Cartridge X Cartridge Y
Output, in Pages Output, in Pages
1120 1060 1095 1228 1336 1120 1106 1228
1095 1270 1228 1120 1095 1228 1095 1306
1106 1060 1306 1095 1095 1270 1120 1336
90)
A)
Cartridge X
B)
Cartridge Y
91)
Moon Average Distance
from Geo I (km) Diameter (km) Time of Revolution
(in Earth time, years)
Luna 1 4000 413 1.00
Luna 2 5200 2169 3.08
Luna 3 50,000 310 5.44
Luna 4 72,000 723 24.35
Luna 5 165,000 1136 62.70
What is the time of revolution around Geo 1 of the moon Luna 4?
91)
A)
24.35 years
B)
723 years
C)
62.70 years
D)
3.08 years
Refer to the double–bar graph below which shows the number of male and female athletes at a university over a
four–year period. Solve the problem.
92)
In which year did the greatest difference between the number of male athlete and female athletes
occur? Find the difference.
92)
A)
2005; 200 athletes
B)
2005; 150 athletes
C)
2003; 100 athletes
D)
2005; 100 athletes
Use the graph to answer the question.
Big “D” Sales (2008–2009)
2009
Sales
(Thousands of $)
2008
Month
93)
Which month in 2008 had the lowest sales?
93)
A)
Month 8
B)
Month 6
C)
Month 3
D)
Month 2
94)
57, 67, 43, 63, 40
94)
A)
54
B)
None
C)
45
D)
57
95)
The swim coach keeps a log for the number of miles travelled round trip to swim meets: 24, 25, 36,
59, 64, 70, 88. Find the median number of miles travelled.
95)
A)
36 miles
B)
52 miles
C)
59 miles
D)
64 miles
Use the pictograph to answer the question.
96)
This pictograph shows projected sales of compact disks (CDs) for a popular rock band for seven
consecutive years.
Year Projected CD Sales
2014
2013
2012
2011
2010
2009
2008
=10,000 CDs
Approximately how many CDs will be sold in 2013?
96)
A)
90,000 CDs
B)
6 CDs
C)
6000 CDs
D)
60,000 CDs
97)
Moon Average Distance
from Geo I (km) Diameter (km) Time of Revolution
(in Earth time, years)
Luna 1 4000 419 1.00
Luna 2 5200 2178 3.08
Luna 3 80,000 307 5.44
Luna 4 115,200 726 38.96
Luna 5 264,000 1145 100.32
Find the average distance from Geo I to its moon Luna 1.
97)
A)
80,000.00 km
B)
5200 km
C)
4000 km
D)
419 km
98)
Six students keep track of their weekly gasoline bills. The gas bills from the students during a
certain week are: $80, $48, $32, $48, $29, $80. Find the mode of the data if it exists
98)
A)
$80, $48
B)
no mode
C)
$48
D)
$80
99)
The five sales people at Southwest Appliances earned commissions last year of $16,000, $23,000,
$43,000, $20,000, and $35,000. Find the average commission.
99)
A)
$28,770
B)
$26,030
C)
$27,400
D)
$30,140
Refer to the double–bar graph below which shows the number of male and female athletes at a university over a
four–year period. Solve the problem.
100)
Find the increase in the number of female athletes from 2002 to 2005.
100)
A)
225
B)
150
C)
125
D)
175
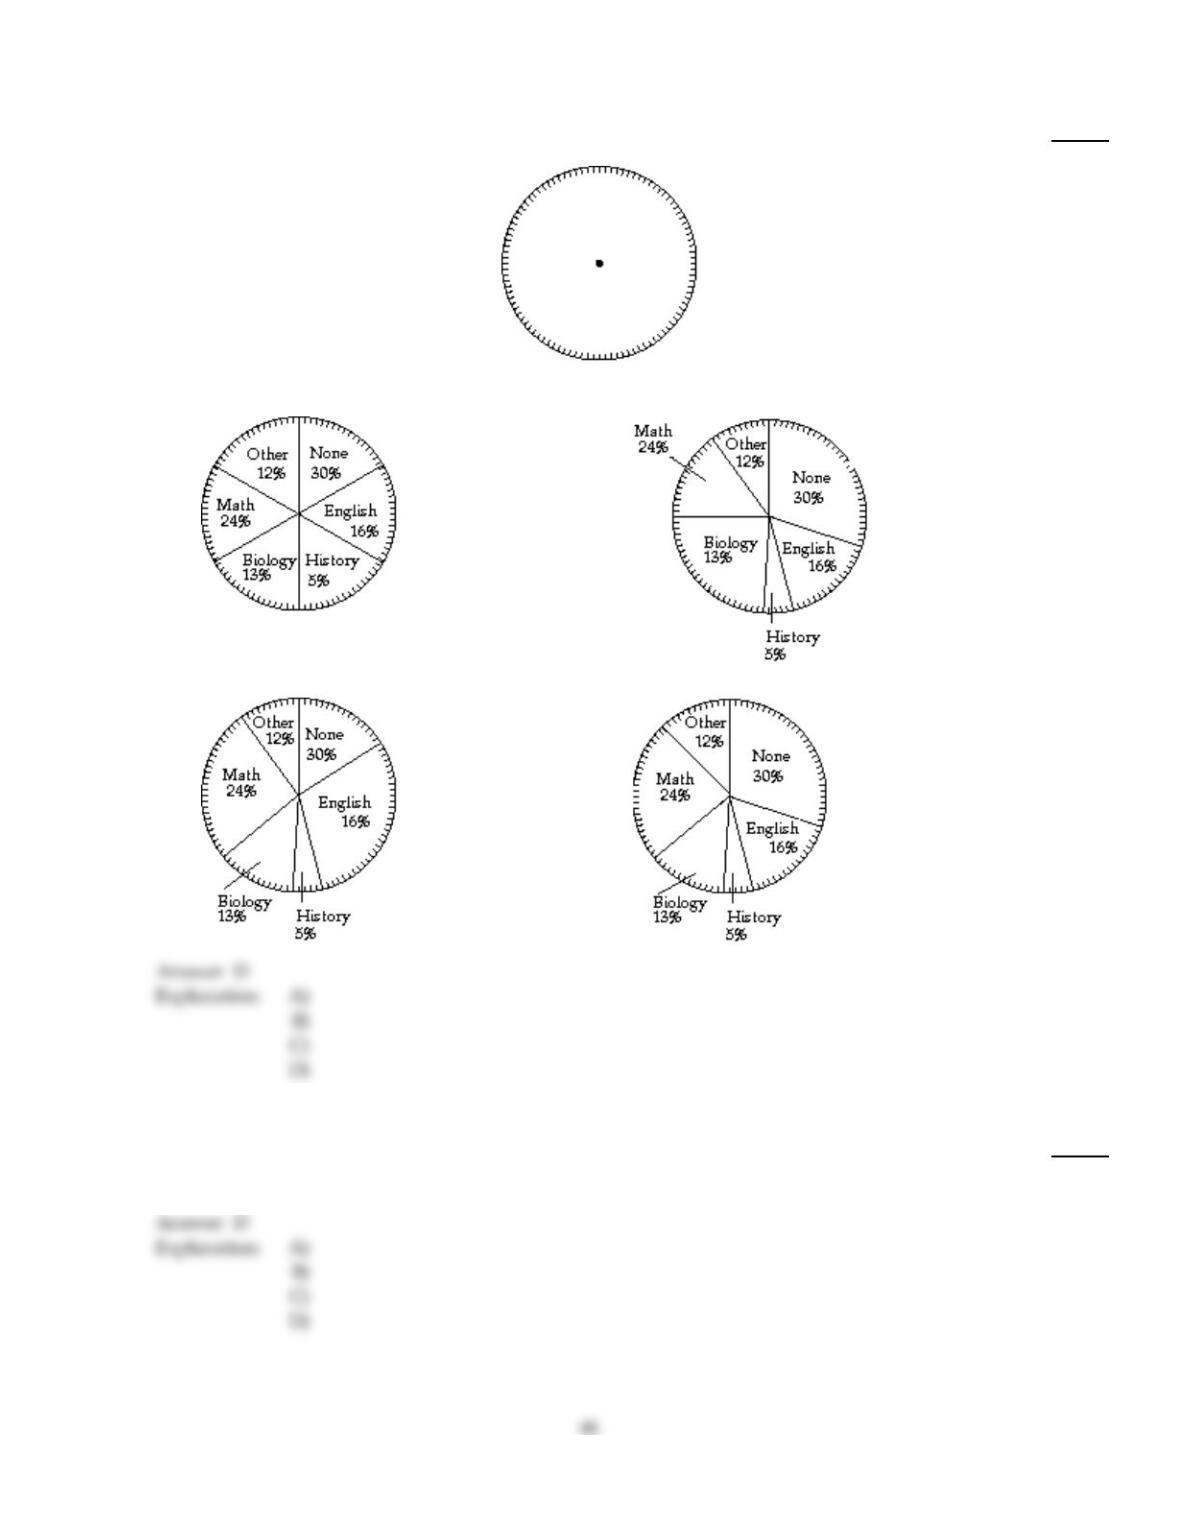
Use the information to complete a circle graph. Note that the circle is divided into 100 equal sections.
101)
Favorite subjects studied by students of one school:
None: 30%
English: 16%
History: 5%
Biology: 13%
Math: 24%
Other: 12%
101)
A)
B)
C)
D)
Solve the problem.
102)
Jackie’s sisters weigh 110 lb, 147 lb, 127 lb, and 120 lb. The average female in her city weighs 130.7
lb. How much does Jackie weigh if she and her sisters have an average weight of 130.7 lb?
102)
A)
126.9 lb
B)
120 lb
C)
126 lb
D)
149.5 lb
103)
An experiment is done to determine which of two cereals tastes better. Shoppers test each kind of
cereal and give it a rating from 1 to 10. The results are in the two tables below. Which type of cereal
is better?
Cereal X Cereal Y
9 2 7 9 7 3
7 9 7 3 2 9
3 9 3 2 7 2
103)
A)
Cereal X
B)
Cereal Y
Find any modes that exist.
104)
20, 33, 46, 33, 49, 33, 49
104)
A)
49
B)
33
C)
37.6
D)
46
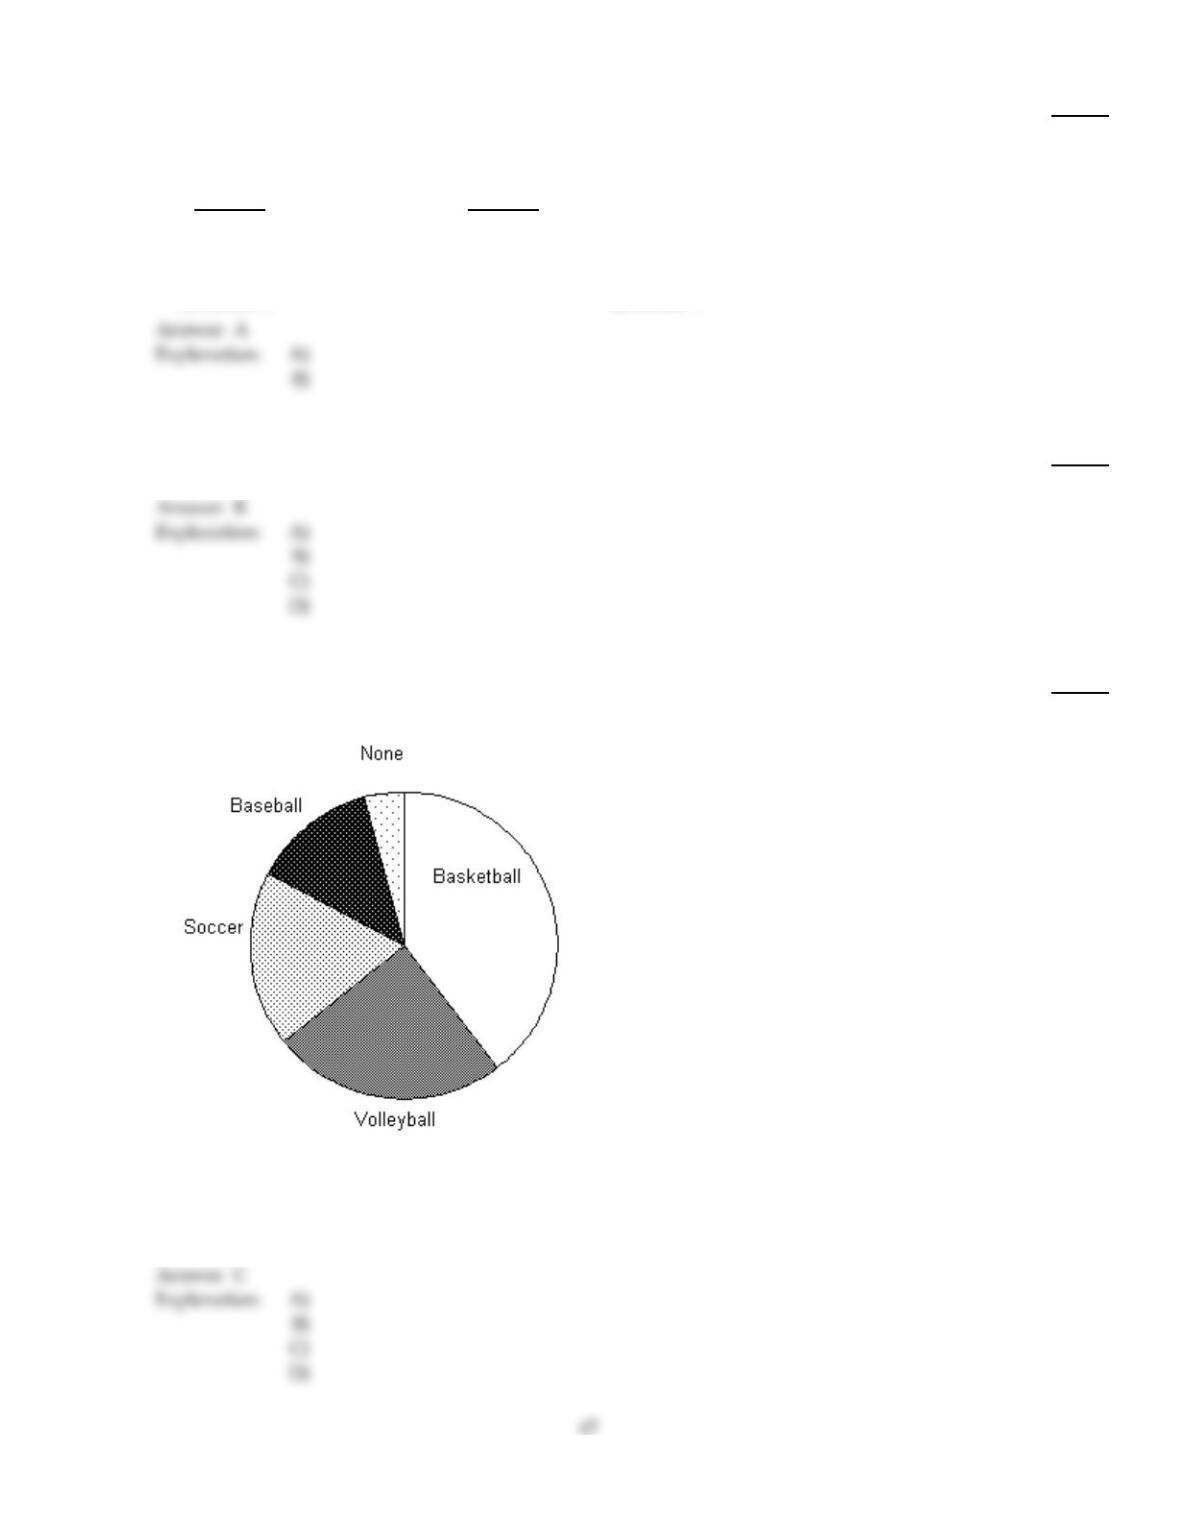
Use the circle graph to solve the problem.
105)
There are 13,000 students attending the local university. The circle graph shows the percentage of
those students who attend different sporting events.
7%
14%
38%
17%
24%
How many students attend Basketball and Baseball games?
105)
A)
4940 students
B)
1820 students
C)
6760 students
D)
676,000 students
Find the average.
106)
7.2, 7.8, 5.2, 7.8, 5
106)
A)
7.8
B)
7.2
C)
6.6
D)
5.5
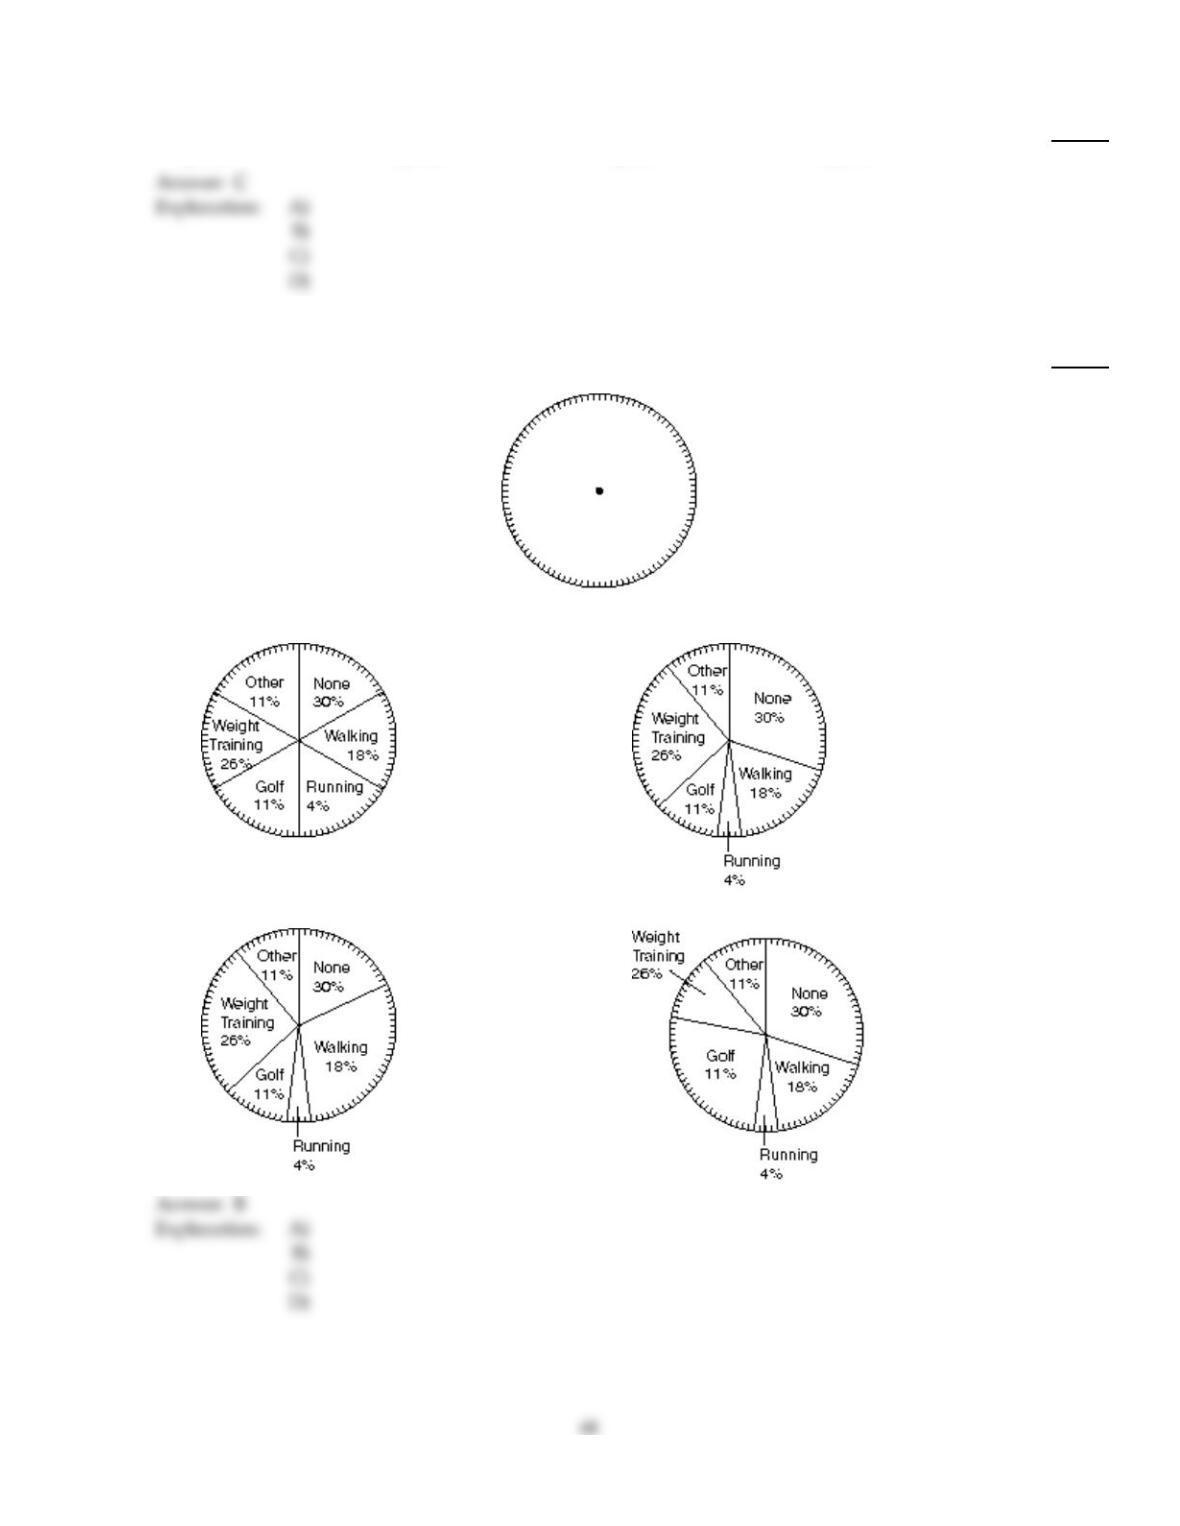
Use the information to complete a circle graph. Note that the circle is divided into 100 equal sections.
107)
Main form of exercise for employees of one company:
None: 30%
Walking: 18%
Running: 4%
Golf: 11%
Weight Training: 26%
Other: 11%
107)
A)
B)
C)
D)
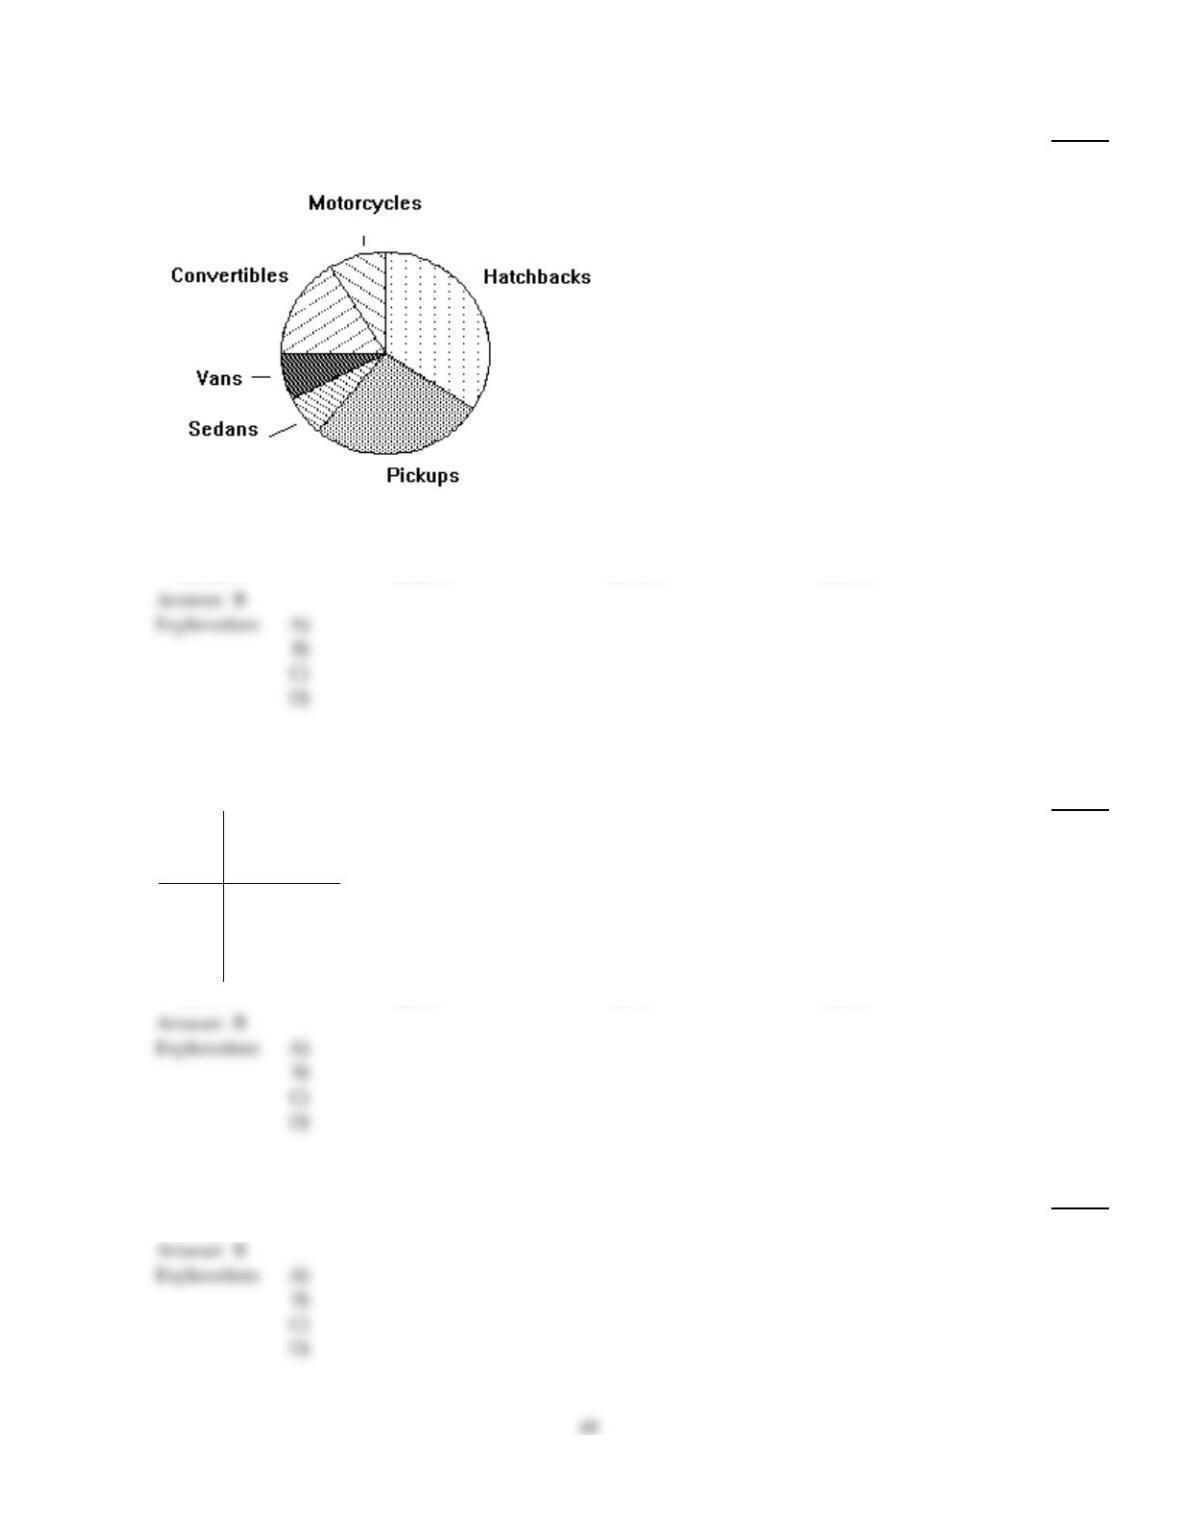
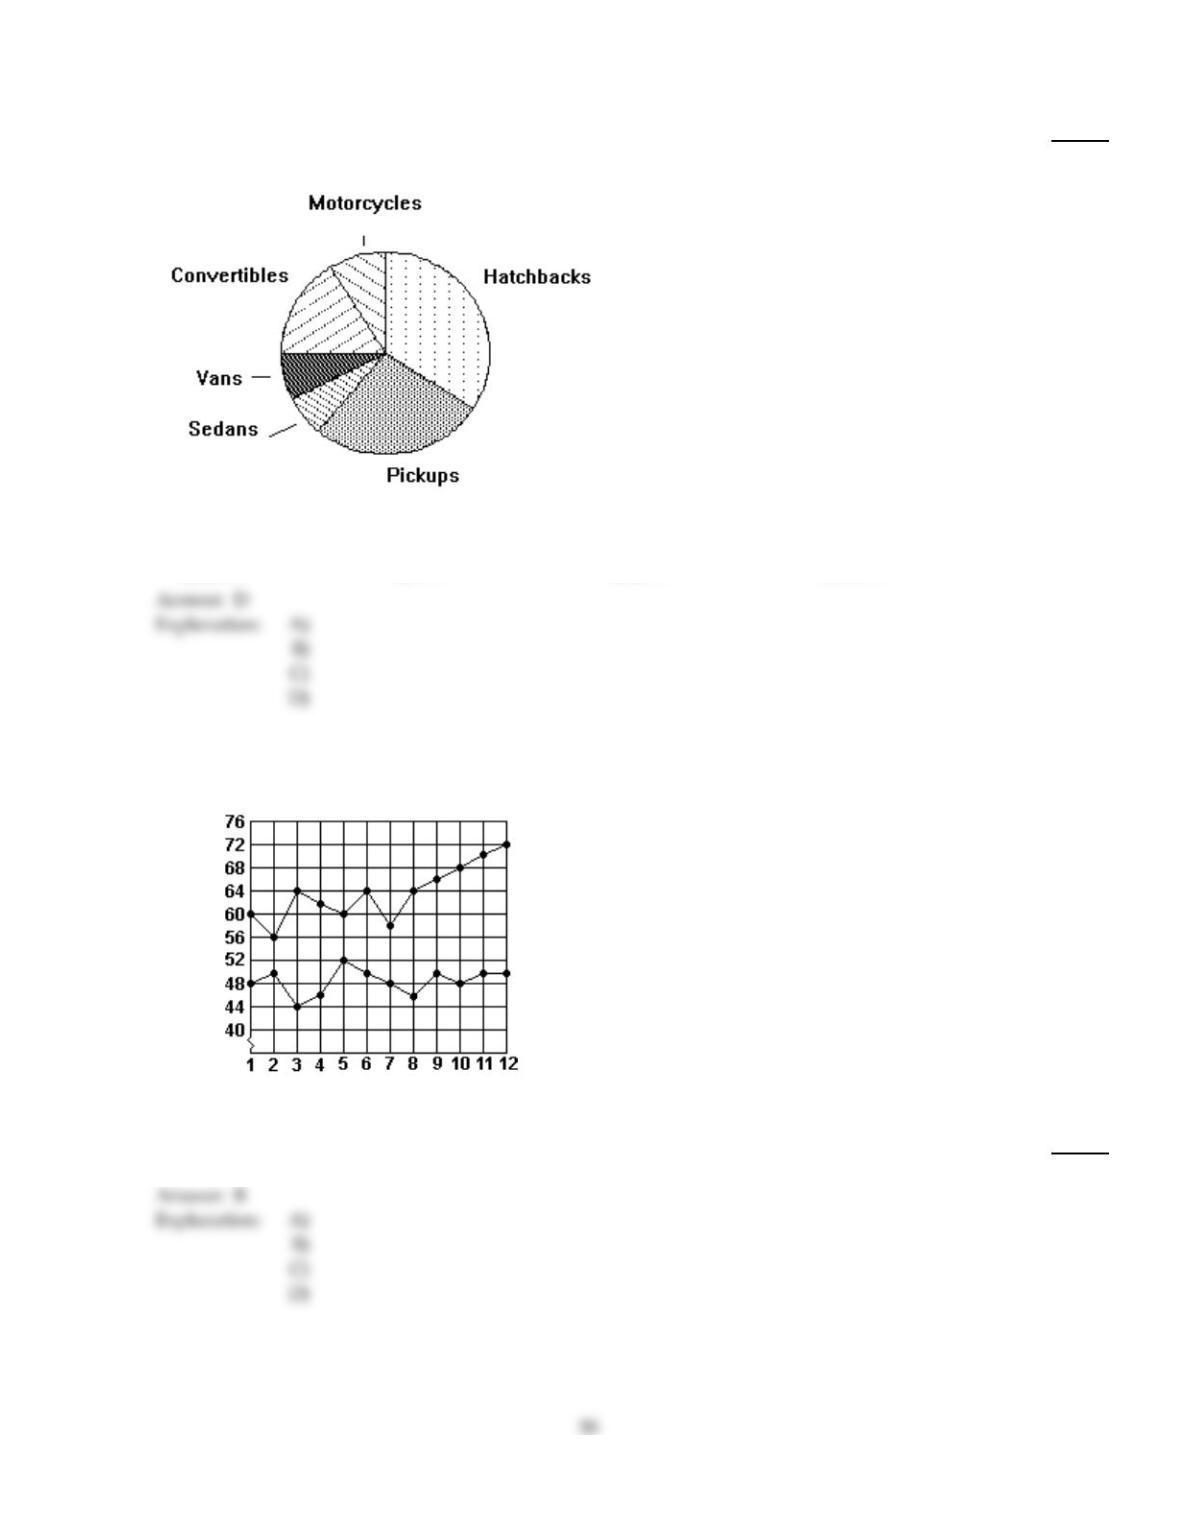
Use the circle graph to solve the problem.
108)
A survey of the 5910 vehicles on the campus of State University yielded the following circle graph.
11%
14%33%
9%
8% 25%
Together, what percent of the vehicles are either vans or convertibles?
108)
A)
126%
B)
23%
C)
14%
D)
5%
Given the grades of a student for one semester, find the grade point average. Assume that the grade point values are 4.0
for an A, 3.0 for a B, and so on. Round to the nearest tenth.
109)
Grades
Number of
Credit Hours
in Course
B 5
B 1
B 5
B 4
109)
A)
11.3
B)
3.0
C)
3.8
D)
3.6
Find the average.
110)
27, 34, 16, 30, 13, 34, 14
110)
A)
34
B)
24
C)
21
D)
27
Use the circle graph to solve the problem.
111)
A survey of the 5584 vehicles on the campus of State University yielded the following circle graph.
10%
15%36%
6%
5%
28%
What percent of the vehicles are hatchbacks?
111)
A)
201%
B)
6%
C)
28%
D)
36%
Use the graph to answer the question.
Big “D” Sales (2008–2009)
2009
Sales
(Thousands of $)
2008
Month
112)
What was the total increase in sales from 2008 to 2009?
112)
A)
$12,000
B)
$182,000
C)
$22,000
D)
$1,342,000
Find any modes that exist.
113)
77, 25, 77, 13, 25, 29, 56, 77
113)
A)
25
B)
42.5
C)
77
D)
47.4
Solve the problem.
114)
Samuel consumed 2168 calories of food on Monday, 2370 calories on Tuesday, and 1874 calories on
Wednesday. In order for Samuel’s average calorie intake to equal a daily average of 2100 calories,
how many calories of food must he consume on Thursday?
114)
A)
2128 calories
B)
1988 calories
C)
2137 calories
D)
2112 calories
Given the grades of a student for one semester, find the grade point average. Assume that the grade point values are 4.0
for an A, 3.0 for a B, and so on. Round to the nearest tenth.
115)
Grades
Number of
Credit Hours
in Course
A 2
C 6
A 3
A 2
B 3
115)
A)
3.1
B)
9.8
C)
4.1
D)
2.1
Find the average.
116)
2.1, 8.1, 6.7, 2.1, 4.2
116)
A)
5.800
B)
23.20
C)
4.2
D)
4.64
Use the graph to answer the question.
Big “D” Sales (2008–2009)
2009
Sales
(Thousands of $)
2008
Month
117)
What were the total sales for 2008?
117)
A)
$764,000
B)
$48,000
C)
$582,000
D)
$50,000
Find the average.
118)
138, 198, 252, 144, 204, 246
118)
A)
173
B)
197
C)
394
D)
312
Find the median for the set of numbers.
119)
6, 10, 16, 24, 36, 43, 50
119)
A)
24
B)
36
C)
16
D)
26
Find any modes that exist.
120)
124, 141, 156, 124, 188, 199, 162
120)
A)
124
B)
90
C)
141
D)
156
Refer to the double–bar graph below which shows the number of male and female athletes at a university over a
four–year period. Solve the problem.
121)
Which year had the same number of male and female athletes?
121)
A)
2005
B)
2004
C)
2002
D)
2003
The bar graph below shows the number of students by major in the College of Arts and Sciences. Answer the question.
122)
The science department spends about $400 on equipment for each student majoring in science.
How much should the science department budget for equipment?
122)
A)
$60,000
B)
$80,000
C)
$6000
D)
$40,000
Provide an appropriate response.
123)
The local high school band wants to sell cookies to raise money. They surveyed 68 area stores to
determine which type of cookie they should sell to make the most money. In 16 stores chocolate
fudge sandwich cookies were the biggest seller. In 8 stores the favorite was sugar wafers. In 7 stores
the most popular was peanut butter cookies. In 22 stores the best seller was chocolate chip, and in
15 stores the favorite was oatmeal raisin. Which measure of central tendency should the
high school band use to make the choice?
123)
A)
Median
B)
Weighted mean
C)
Mean
D)
Mode
Refer to the double–bar graph below which shows the number of male and female athletes at a university over a
four–year period. Solve the problem.
124)
Find the increase in the number of female athletes from 2002 to 2003.
124)
A)
100
B)
75
C)
50
D)
200
Find the median for the set of numbers.
125)
15, 123, 237, 276, 311, 476
125)
A)
256.5
B)
205.5
C)
276
D)
237
Refer to the double–bar graph below which shows the number of male and female athletes at a university over a
four–year period. Solve the problem.
126)
What was the percent of increase in the number of male athletes from 2002 to 2003?
126)
A)
75%
B)
100%
C)
50%
D)
25%
Use the pictograph to answer the question.
127)
For selected countries, this pictograph shows approximately how many kilograms of seafood are
consumed by each person (per capita) annually.
835
Approximately how many more kilograms of seafood is eaten per person in Country A than in
Country B?
127)
A)
2922.5 kilograms
B)
2087.5 kilograms
C)
2505 kilograms
D)
2713.75 kilograms
Use the graph to answer the question.
Big “D” Sales (2008–2009)
2009
Sales
(Thousands of $)
2008
Month
128)
What was the difference between the highest and lowest monthly sales in 2008?
128)
A)
$8000
B)
$6000
C)
$2000
D)
$4000
Use the pictograph to answer the question.
129)
This pictograph shows projected sales of compact disks (CDs) for a popular rock band for seven
consecutive years.
Year Projected CD Sales
2013
2012
2011
2010
2009
2008
2007
=10,000 CDs
Between which two consecutive years is the greatest decline in sales indicated?
129)
A)
Between 2011 and 2012
B)
Between 2008 and 2009
C)
Between 2009 and 2010
D)
Between 2012 and 2013
Solve the problem.
130)
To get a B in biology, Katie must average 83 on five lab reports. Scores on the first four lab reports
were 91, 78, 75, and 81. What is the lowest score that Katie can get on the last lab report and still
receive a B?
130)
A)
90
B)
81
C)
82
D)
85
131)
An experiment is done to compare the germination success rates of two types of seeds. Plots
containing equal numbers of each kind of seed were planted and the number of seeds that
germinated within a set time limit are shown in the tables below. Which type of seed is better?
Seed X Seed Y
8 2 2 2 8 7
2 8 8 7 8 7
2 7 7 7 7 2
131)
A)
Seed X
B)
Seed Y
Refer to the double–bar graph below which shows the number of male and female athletes at a university over a
four–year period. Solve the problem.
132)
Find the increase in the number of male athletes from 2004 to 2005.
132)
A)
100
B)
75
C)
50
D)
475
Answer Key
Testname: C7
58
Answer Key
Testname: C7
Answer Key
Testname: C7
60
Answer Key
Testname: C7
61
Answer Key
Testname: C7

Answer Key
Testname: C7
Answer Key
Testname: C7

Answer Key
Testname: C7