Consumers, Producers, and the Efficiency of Markets 1833
64.
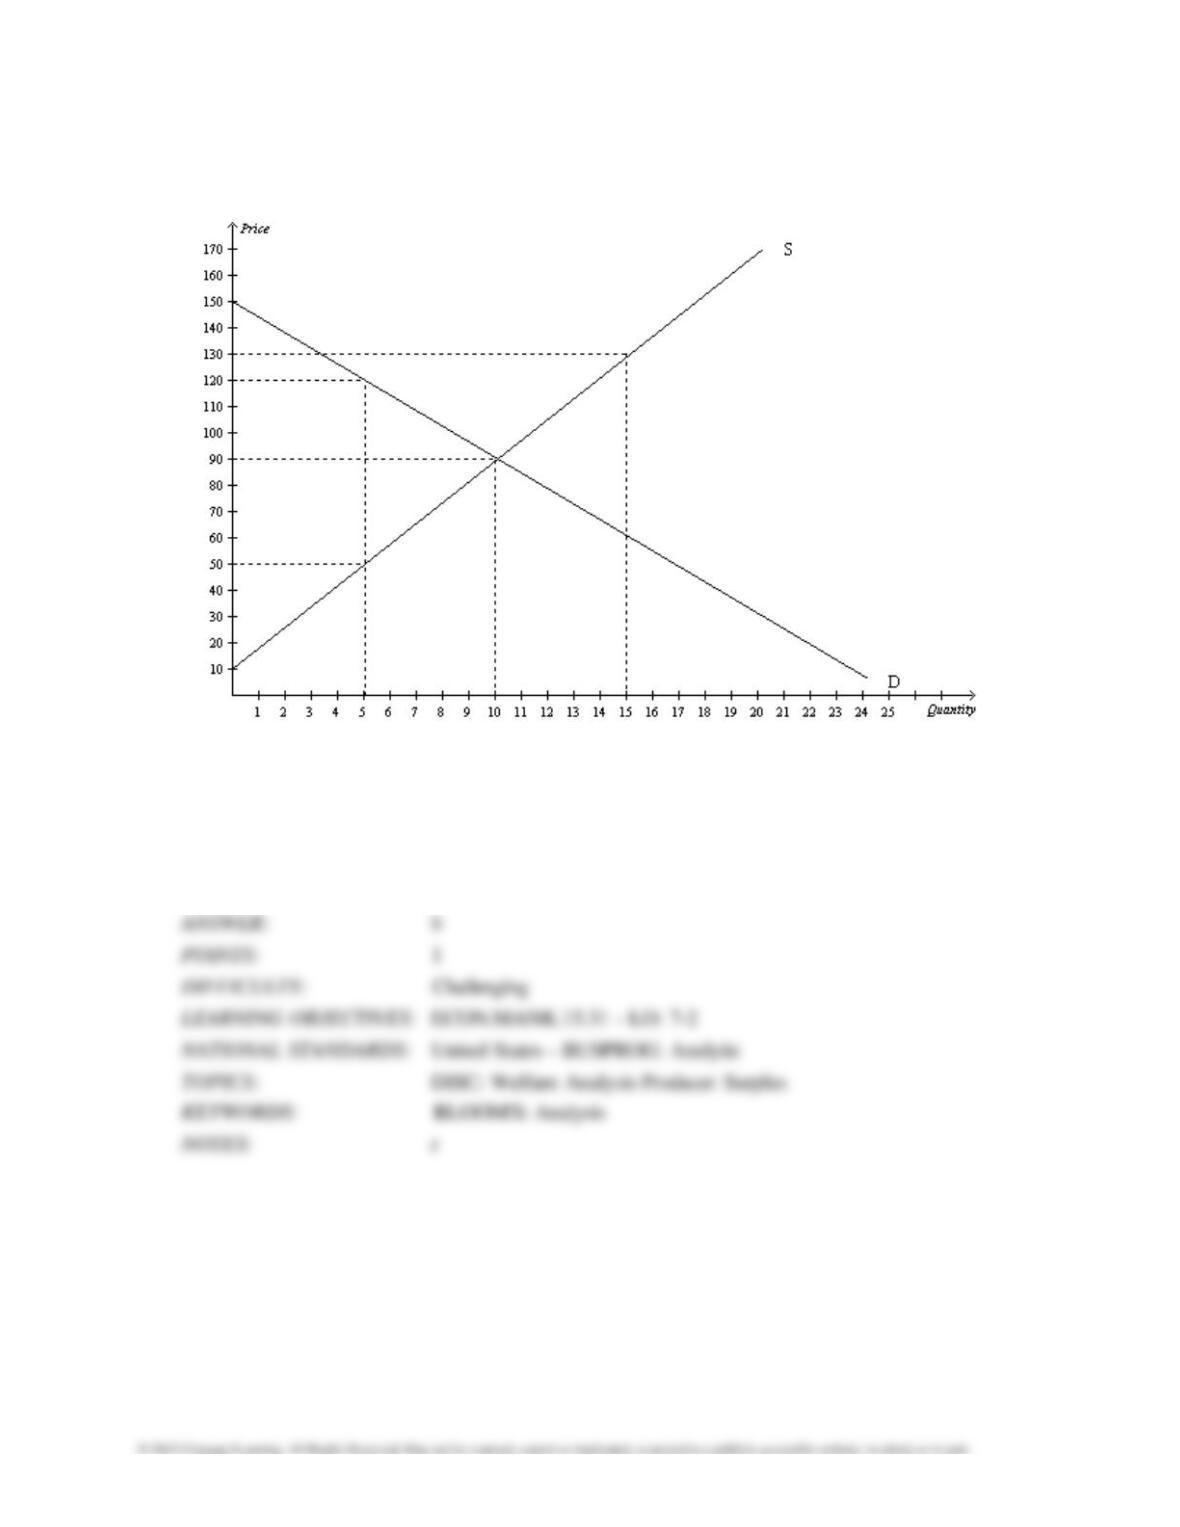
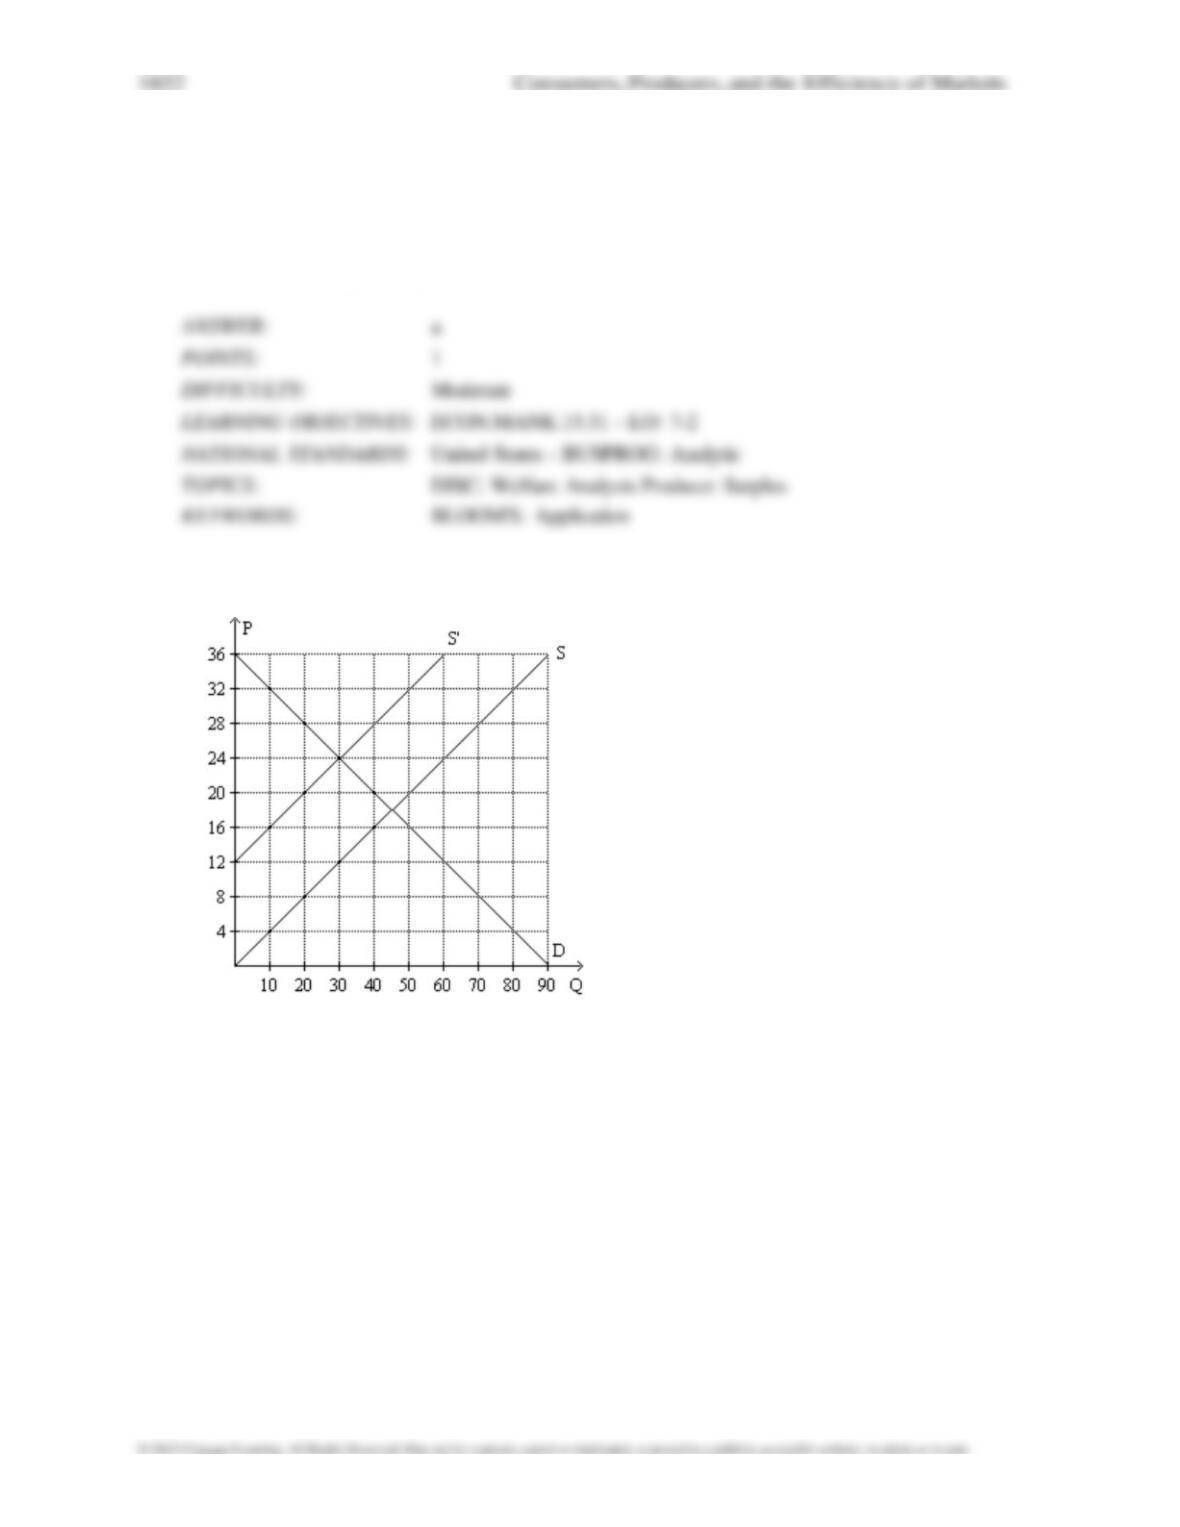
Refer to Figure 7-11. If the supply curve is S and the demand curve shifts from D to D’, what
is the increase in producer surplus due to new producers
a. $625
b. $2,500
c. $3,125
d. $5,625
Table 7-16
The following table represents the costs of five possible sellers.
Seller Cost ($)
Quentin
10
Ruby
30
Sandra
60
Thomas
100
Ursula
150
65.
Refer to Table 7-16. If each producer has one unit available for sale, and if the market
equilibrium price is $80
per unit, how much is the total producer surplus in this market?
a.
$90
b.
$110
c.
$130
d.
$140
66.
Refer to Table 7-16. If each producer has one unit available for sale, and if the market
equilibrium price is $70,
how much is the combined total cost of all participating sellers in the
market?
a.
$100
b.
$150
c.
$250
d.
$350
67.
Refer to Table 7-16. Suppose each of the five sellers can supply at most one unit of the good.
At which of the
following prices would the market quantity supplied be exactly three units?
a.
$20
b.
$50
c.
$90
d.
$120
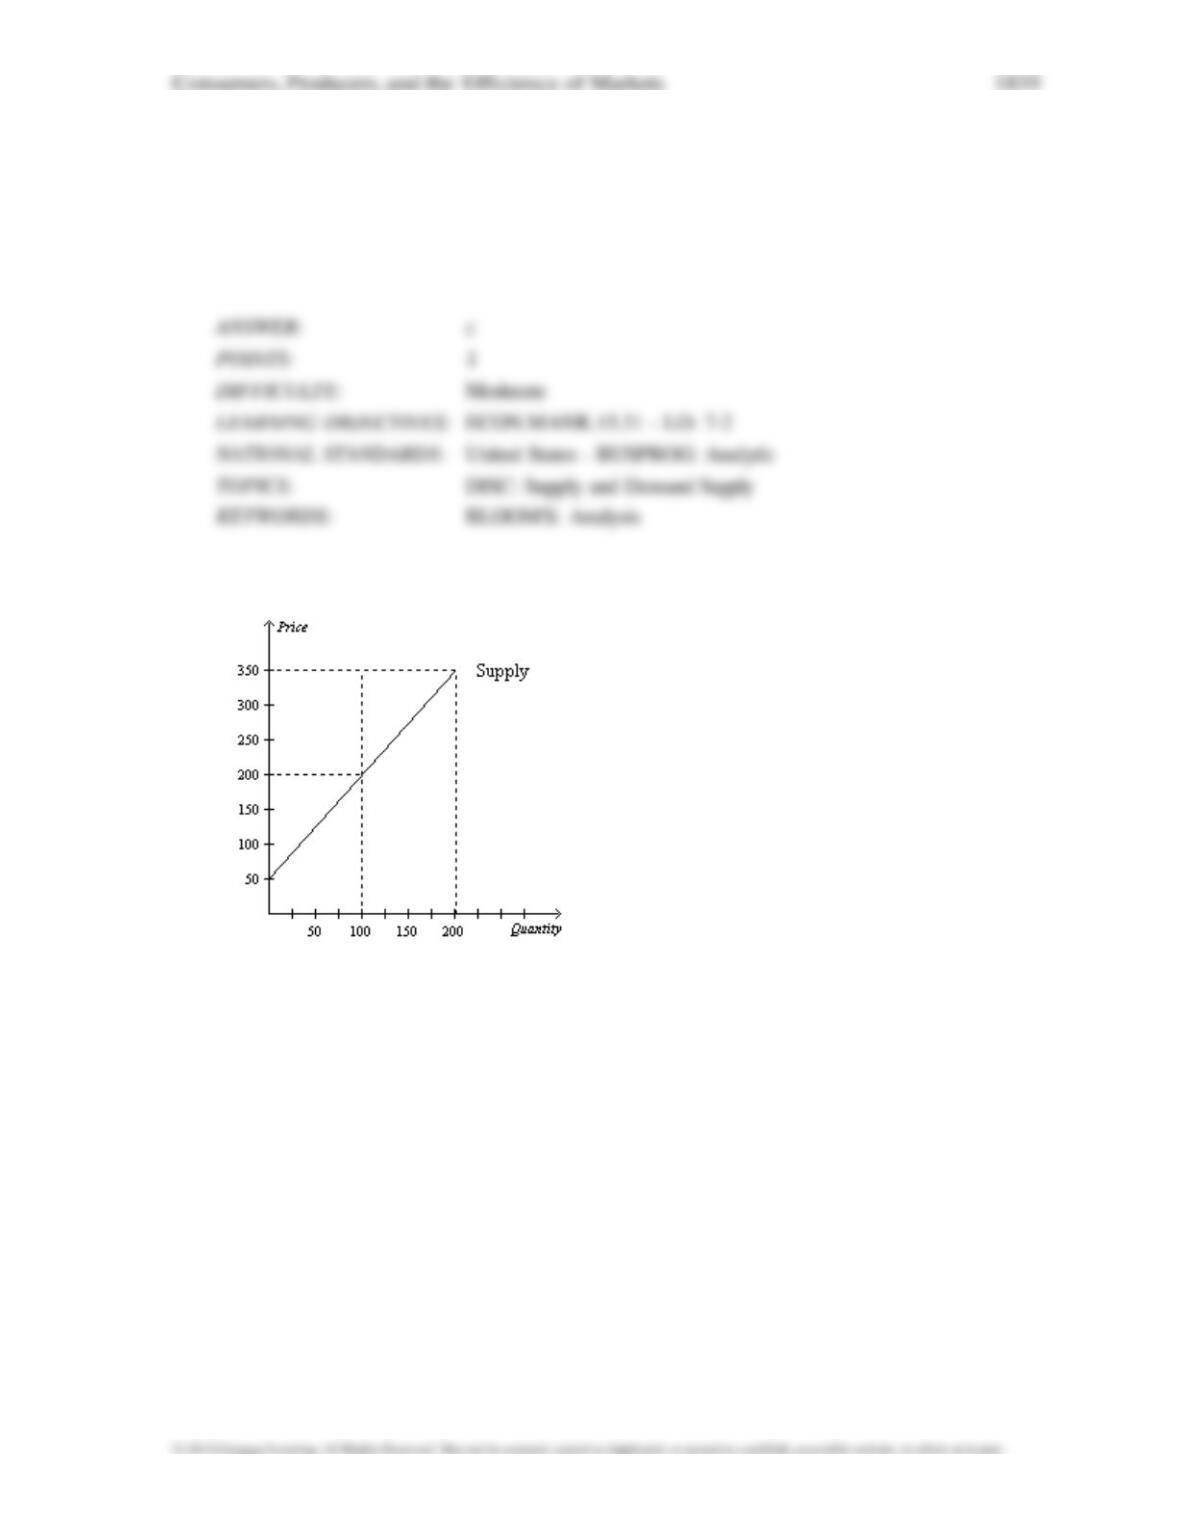
Figure 7-12
68.
Refer to Figure 7-12. If the equilibrium price is $200, what is the producer surplus?
a. $7,500
b. $3,750
c. $10,000
d. $15,000
69.
Refer to Figure 7-12. If the equilibrium price is $350, what is the producer surplus?
a. $60,000
b. $15,000
c. $30,000
d. $70,000
70.
Refer to Figure 7-12. If the equilibrium price rises from $200 to $350, what is the additional
producer surplus to initial producers?
a. $15,000
b. $3,750
c. $7,500
d. $30,000
71.
Refer to Figure 7–12. If the equilibrium price rises from $200 to $350, what is the producer
surplus to new producers
a. $15,000
b. $3,750
c. $7,500
d.$30,000
1838 Consumers, Producers, and the Efficiency of Markets
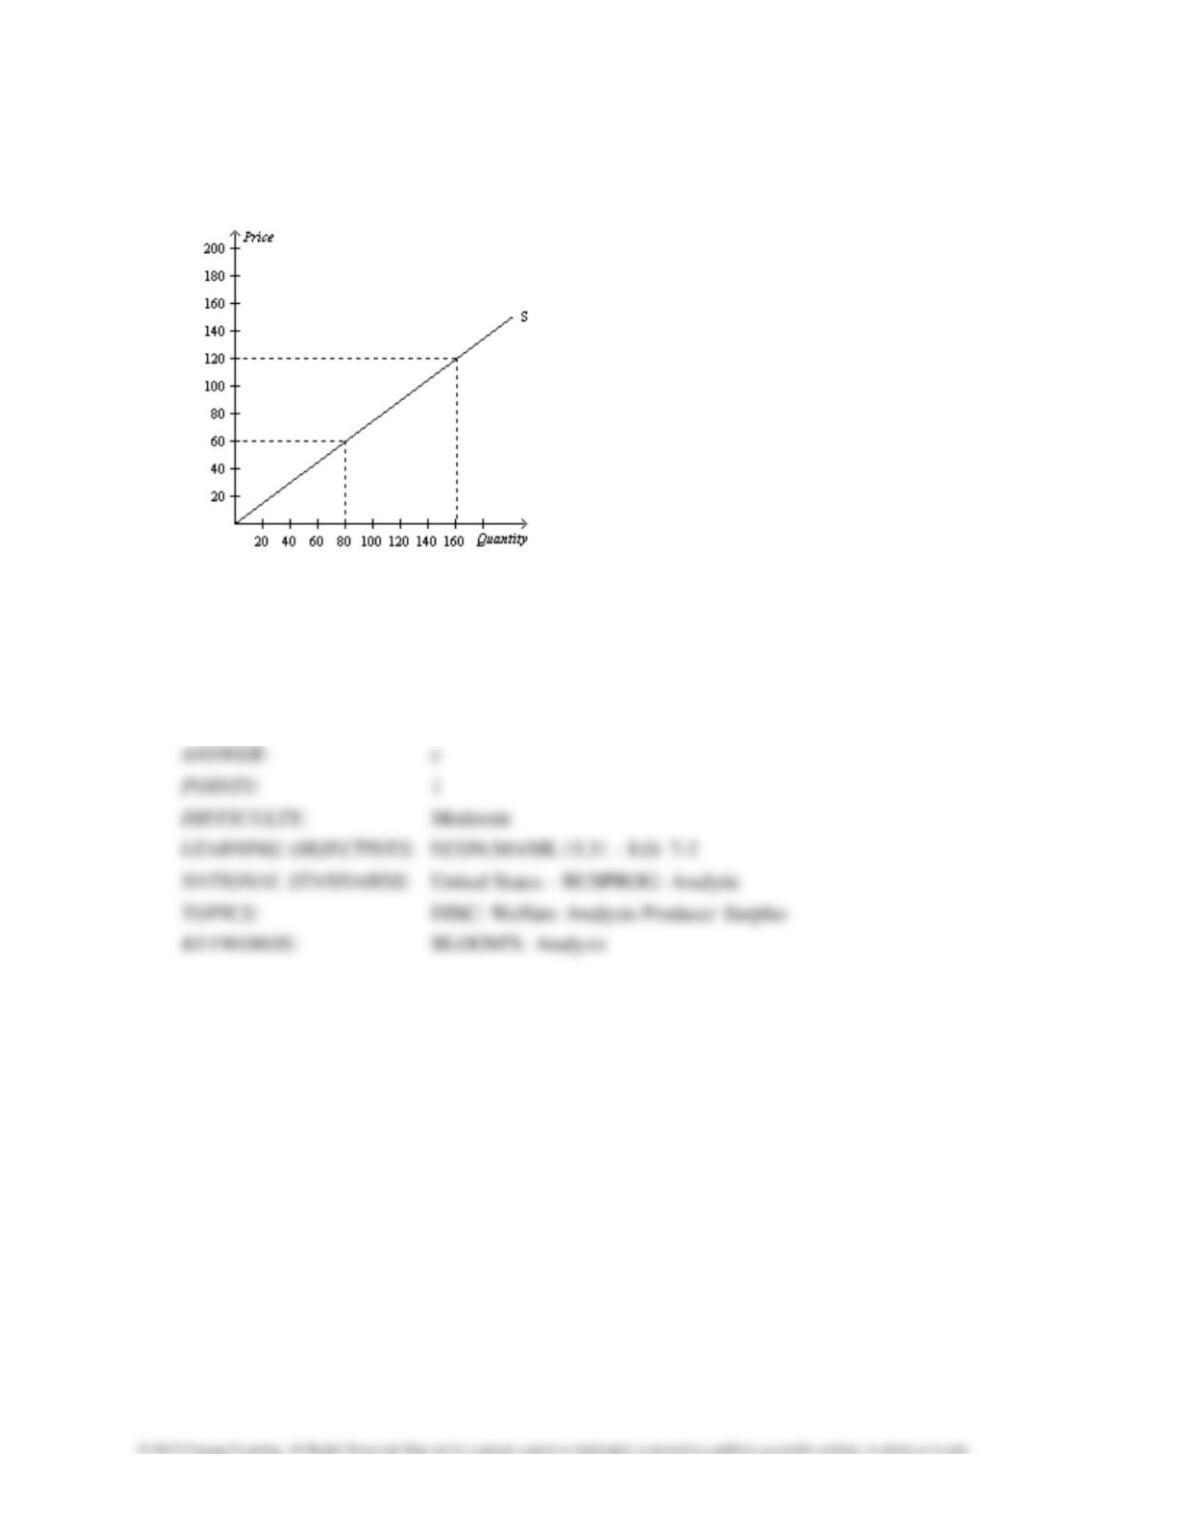
Figure 7-13
72.
Refer to Figure 7-13. If the equilibrium price is $60, what is the producer surplus?
a. $600
b. $1,200
c. $2,400
d. $4,800
73.
Refer to Figure 7-13. If the equilibrium price rises from $60 to $120, what is the additional
producer surplus to initial producers in the market?
a. $1,200
b. $2,400
c. $3,600
d. $4,800
74.
Refer to Figure 7–13. If the equilibrium price rises from $60 to $120, what is the producer
surplus to new producer s in the market?
a. $1,200
b. $2,400
c. $3,600
d. $4,800
1840 Consumers, Producers, and the Efficiency of Markets
Figure 7-14
75.
Refer to Figure 7–14. At the equilibrium price, producer surplus is
a. $800.
b. $400.
c. $450.
d. $900.

76.
Refer to Figure 7–14. If the government imposes a price ceiling of $50 in this market, then the
new producer
surplus will be
a. $200.
b. $100.
c. $125.
d. $250.
77.
Refer to Figure 7-14. If the government imposes a price ceiling of $50 in this market, then
producer surplus will
a. $325.
b. $100.
c. $300.
d. $200.
78.
Refer to Figure 7–14. If the market price increases to $130 due to an increase in demand, then
producer surplus
is
a. $1,800.
b. $900.
c. $975.
d. $1,950.
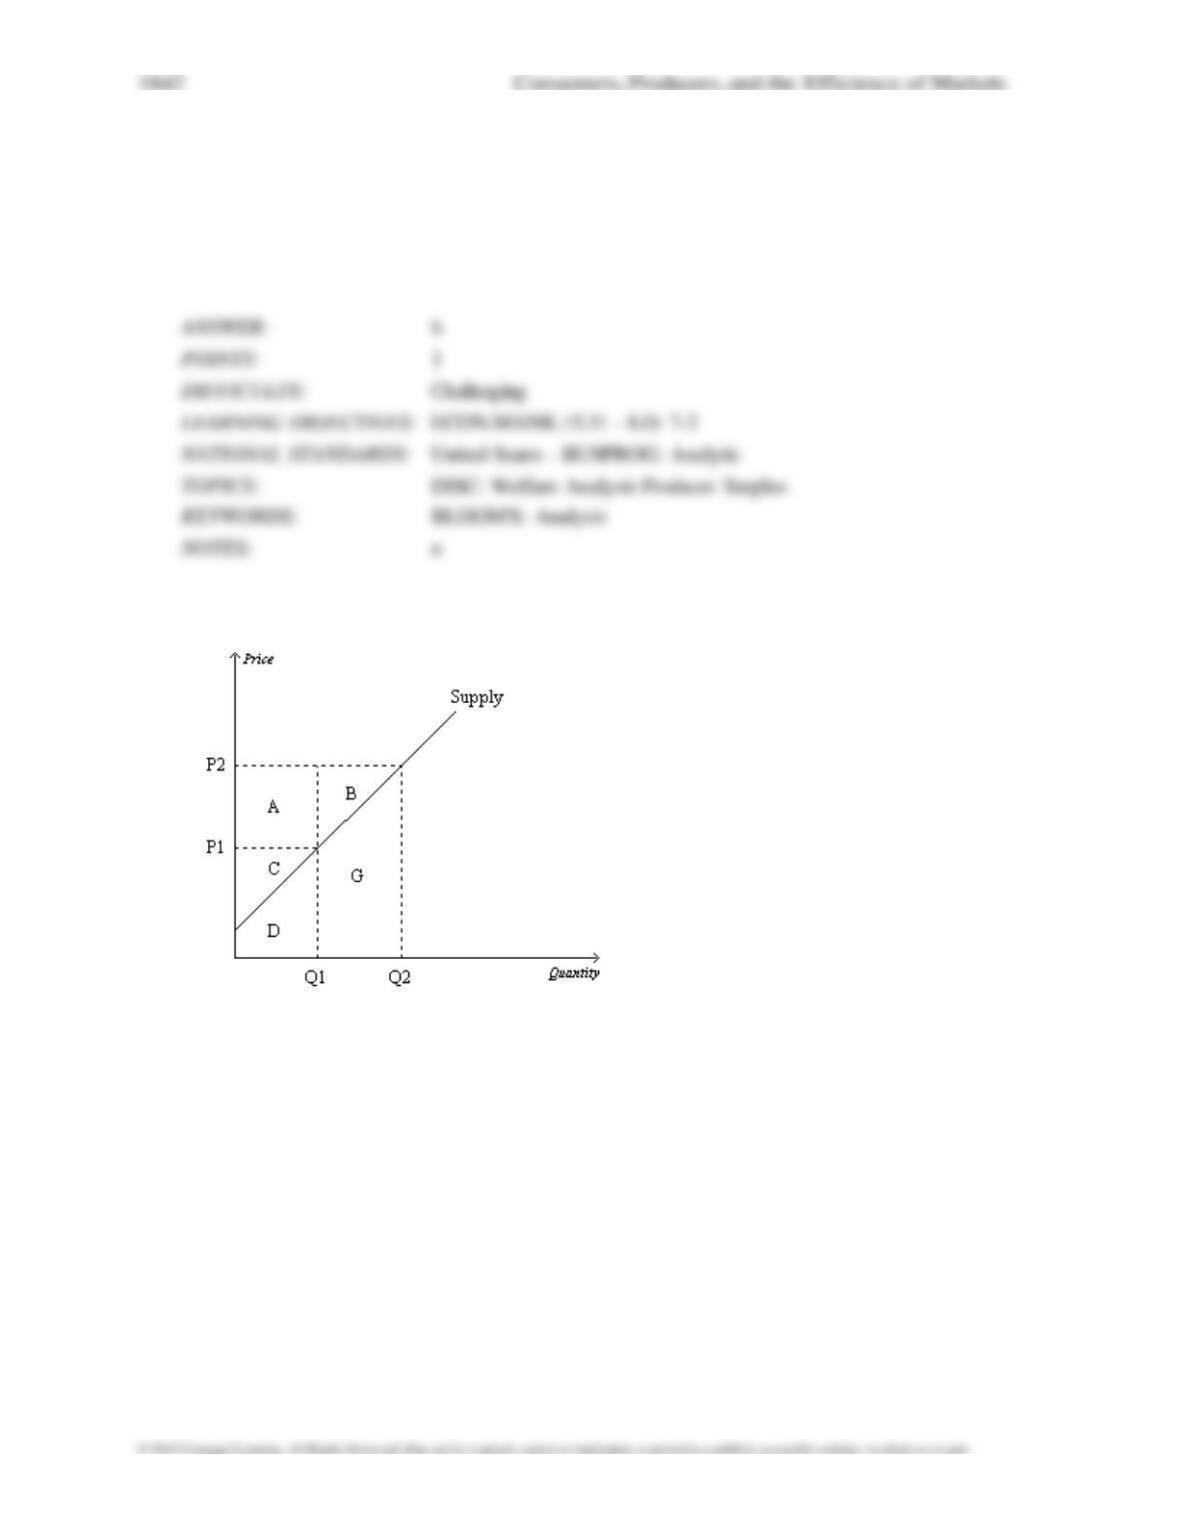
Figure 7-15
79.
Refer to Figure 7-15. When the price is P2, producer surplus is
a.
A.
b.
A+C.
c.
A+B+C.
d.
D+G.
80.
Refer to Figure 7-15. Suppose producer surplus is larger than C but smaller than A+B+C. The
price of the good
must be
a.
lower than P1.
b.
P1.
c.
between P1 and P2.
d.
higher than P2.
81.
Refer to Figure 7-15. When the price is P1, producer surplus is
a.
A.
b.
C.
c.
A+B.
d.
C+D.
82.
Refer to Figure 7-15. When the price falls from P2 to P1, producer surplus
a.
decreases by an amount equal to C.
b.
decreases by an amount equal to A+B.
c.
decreases by an amount equal to A+C.
d.
increases by an amount equal to A+B.
83.
Refer to Figure 7-15. When the price rises from P1 to P2, what area represents the increase in
producer
surplus?
a.
A
b.
A+B
c.
A+B+C
d.
G
84.
Refer to Figure 7-15. When the price rises from P1 to P2, which area represents the increase in
producer surplus
to existing producers?
a.
A
b.
A+B
c.
A+B+C
d.
G
85.
Refer to Figure 7-15. When the price rises from P1 to P2, which area represents the increase in
producer surplus
due to new producers entering the market?
a.
A
b.
B
c.
A+B
d.
G
86.
Refer to Figure 7-15. Area A represents
a.
producer surplus to new producers entering the market as the result of an increase in price
from P1 to P2.
b.
the increase in consumer surplus that results from an upward-sloping supply curve.
c.
the increase in total surplus when sellers are willing and able to increase supply from Q1 to Q2.
d.
the increase in producer surplus to those producers already in the market when the price
increases from P1
to P2.
87.
Refer to Figure 7-15. Area B represents
a.
the combined profits of all producers when the price is P2.
b.
the increase in producer surplus to all producers as the result of an increase in the price from
P1 to P2.
c.
producer surplus to new producers entering the market as the result of an increase in the price
from P1 to
P2.
d.
that portion of the increase in producer surplus that is offset by a loss in consumer surplus when
the price
increases from P1 to P2.
88.
Refer to Figure 7-15. When the price falls from P2 to P1, which of the following would not be
true?
a.
The sellers who still sell the good are worse off because they now receive less.
b.
Some sellers leave the market because they are not willing to sell the good at the lower price.
c.
The total cost of what is now sold by sellers is actually higher than it was before the decrease
in the price.
d.
Producer surplus would fall by area A + B.
1848 Consumers, Producers, and the Efficiency of Markets
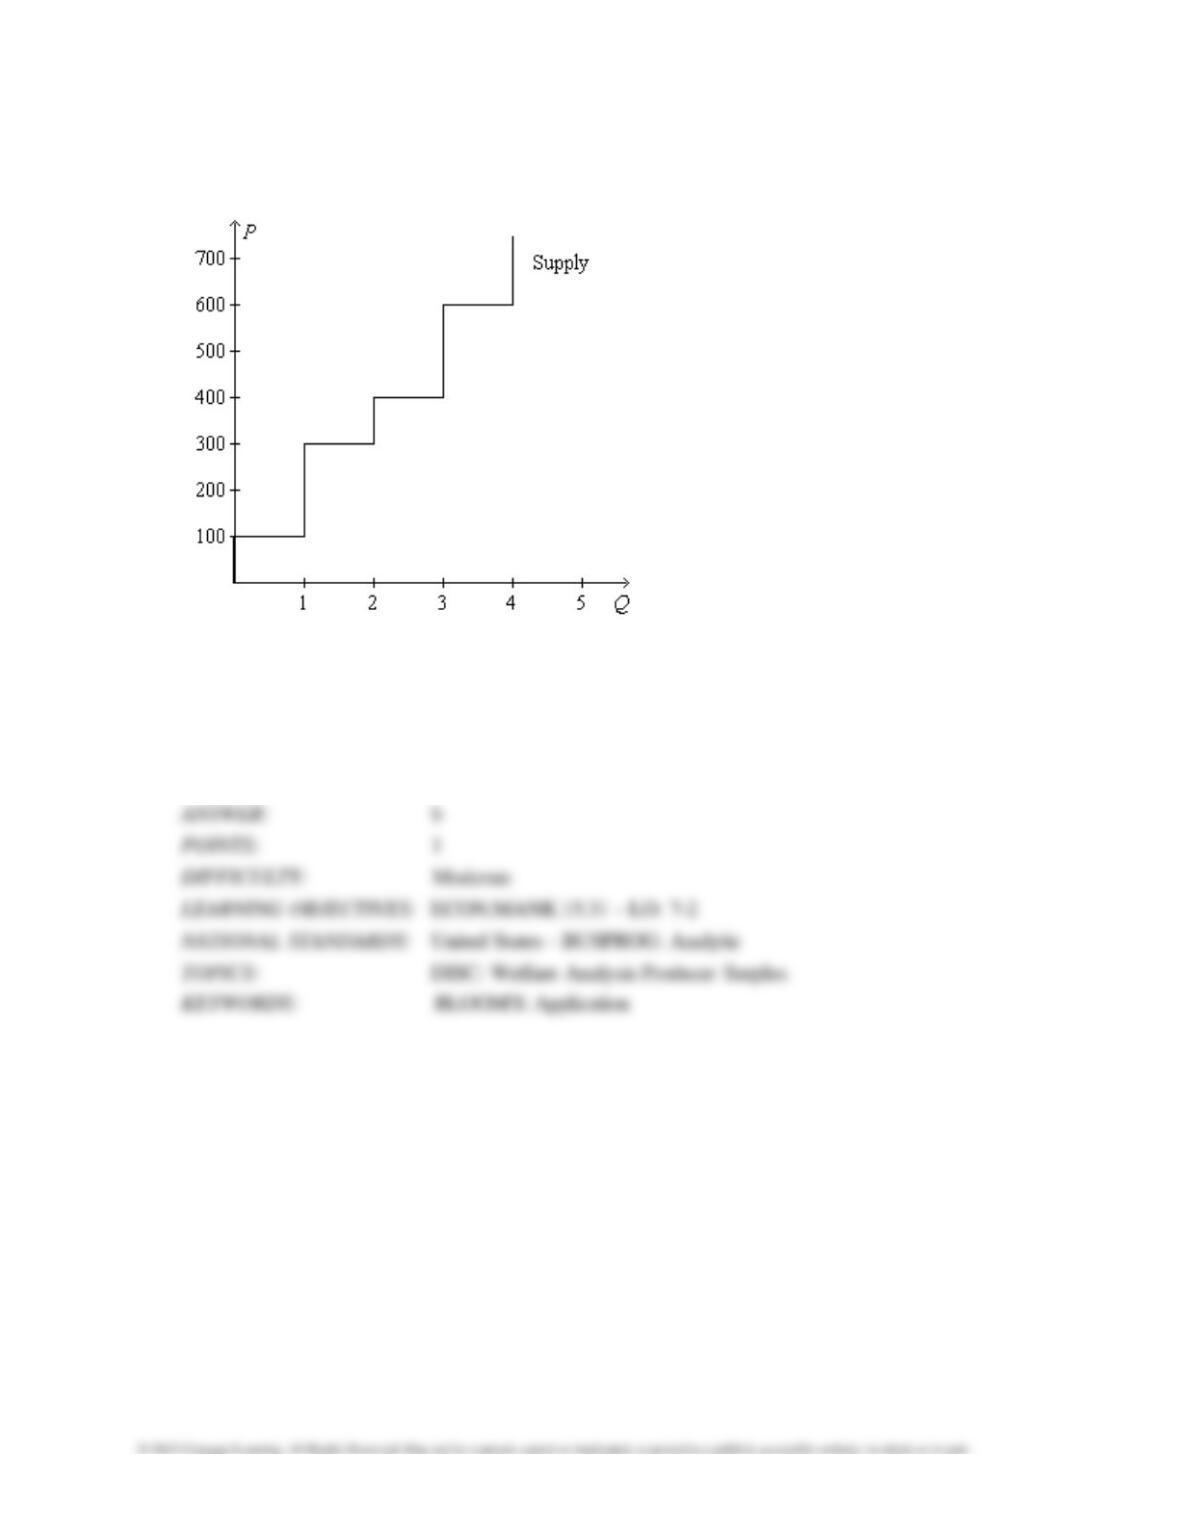
Figure 7-16
89.
Refer to Figure 7-16. If the price of the good is $300, then producer surplus amounts to
a. $100.
b. $200.
c. $300.
d. $400.
90.
Refer to Figure 7-16. If the price of the good is $500, then producer surplus amounts to
a. $450.
b. $575.
c. $700.
d. $800.
91.
Refer to Figure 7-16. If the price of the good is $600, then producer surplus amounts to
a. $650.
b. $800.
c. $900.
d. $1,000.
92.
Refer to Figure 7-16. If the price of the good is $600, then
a.
consumer surplus is $800.
b.
consumer surplus is $900.
c.
producer surplus is $900.
d.
producer surplus is $1,000.
93.
Refer to Figure 7-16. Suppose the price of the good is $400. Then, on the first unit of the good
that is sold,
producer surplus amounts to
a. $200.
b. $300.
c. $400.
d. $450.
94.
Refer to Figure 7-16. Suppose the price of the good is $450. Then, on the first unit of the good
that is sold,
producer surplus is
a.
$250, and on the second unit of the good that is sold, producer surplus is $100.
b.
$250, and on the second unit of the good that is sold, producer surplus is $150.
c.
$350, and on the second unit of the good that is sold, producer surplus is $100.
d.
$350, and on the second unit of the good that is sold, producer surplus is $150.
95.
Refer to Figure 7-16. Producer surplus amounts to $300 if the price of the good is
a. $300.
b. $350.
c. $400.
d. $450.
96.
Refer to Figure 7-16. Sellers will be unwilling to sell more than
a.
1 unit of the good if its price is below $200.
b.
2 units of the good if its price is below $450.
c.
3 units of the good if its price is below $700.
d.
All of the above are correct.
Figure 7-17