Exam
Name___________________________________
MULTIPLE CHOICE. Choose the one alternative that best completes the statement or answers the question.
Provide an appropriate response.
1)
The mean annual income for adult women in one city is $28,520 and the standard deviation of the
incomes is $5,190. The distribution of incomes is skewed to the right. For samples of size 30, which
of the following statements best describes the sampling distribution of the mean?
1)
A)
Nothing can be said about the distribution of x.
B)
x is approximately normally distributed.
C)
x is normally distributed.
D)
The distribution of x is skewed to the right.
2)
Let x represent the number which shows up when a balanced die is rolled. Then x is a random
variable with a uniform distribution. Let x denote the mean of the numbers obtained when the die
is rolled 32 times. For samples of size 32, which of the following statements concerning the
sampling distribution of the mean is true?
2)
A)
The distribution of x is uniform.
B)
x is approximately normally distributed.
C)
x is normally distributed.
D)
None of the above statements is true.
3)
For the population of one town, the number of siblings is a random variable whose relative
frequency histogram has a reverse J–shape. Let x denote the mean number of siblings for a random
sample of size 30. For samples of size 30, which of the following statements concerning the
sampling distribution of the mean is true?
3)
A)
x is normally distributed.
B)
The distribution of x has a reverse J–shape.
C)
x is approximately normally distributed.
D)
None of the above statements is true.
4)
For the population of one town, the number of siblings is a random variable whose relative
frequency histogram has a reverse J–shape. Let x denote the mean number of siblings for a random
sample of size 3. For samples of size 3, which of the following statements concerning the sampling
distribution of the mean is true?
4)
A)
x is normally distributed.
B)
The distribution of x has a reverse J–shape.
C)
x is approximately normally distributed.
D)
None of the above statements is true.
5)
Let x represent the number which shows up when a balanced die is rolled. Then x is a random
variable with a uniform distribution. Let x denote the mean of the numbers obtained when the die
is rolled 3 times. Which of the following statements concerning the sampling distribution of the
mean, x , is true?
5)
A)
x is normally distributed.
B)
x has a uniform distribution.
C)
x is approximately normally distributed.
D)
None of the above statements is true.
6)
Which of the following is not synonymous with the sampling distribution of the sample mean?
6)
A)
Distribution of a variable in a sample of a given size for a given x
B)
Distribution of the variable x
C)
Distribution of x
D)
Distribution of all possible sample means from samples of a given size
7)
The heights of adult women in the U.S are normally distributed. Let x denote the mean height for a
random sample of 4 women. For samples of size 4, which of the following statements concerning
the sampling distribution of the mean is true?
7)
A)
x has a uniform distribution.
B)
x is normally distributed.
C)
x is approximately normally distributed.
D)
None of the above statements is true.
SHORT ANSWER. Write the word or phrase that best completes each statement or answers the question.
8)
Do you agree with Tony‘s reasoning below? Explain why you do or do not agree. Refer to
the Central Limit Theorem in your explanation.
Tony: “When a balanced die is rolled, each of the numbers 1, 2, 3, 4, 5, and 6 has an equal
chance of showing up. So, if I roll the die 50 times and find the mean of the 50 numbers,
the mean has the same chance of falling between 1 and 2 as it has of falling between 3 and
4.”
8)
Solve the problem.
9)
The ages of six members of a board of directors of a nonprofit organization are shown
below.Member A B C D E F
Age 32 52 43 64 41 50
Consider these board members to be a population of interest. The mean age, µ, for the
population is 47. Construct a table that shows all of the possible samples of size five. For
each of the possible samples, list the people in the sample, their ages, and the sample mean.
The first line of the table is shown below.
Sample Ages x
A, B, C, D, E 32, 52, 43, 64, 41 46.4
Use your table to find the probability that, for a random sample of size five, the sample
mean will be within 2 years of the population mean.
9)
10)
The weights of five players on a football team are shown below.
Player A B C D E
Weight (lb) 290 310 250 255 220
Consider these players to be a population of interest. The mean weight, µ, for the
population is 265 pounds. Construct a table that shows all of the possible samples of size
three. For each of the possible samples, list the players in the sample, their weights, and the
sample mean. The first line of the table is shown below.
Sample Weights x
A, B, C 290, 310, 250 283.3
Use your table to find the probability that, for a random sample of size three, the sample
mean will be within 15 lb of the population mean.
10)
Provide an appropriate response.
11)
A population of people has a mean height of 65 inches. Andrew picks a person at random
from the population and records his or her height. He repeats this procedure 49 times
more. Bob picks a sample of 30 people at random from the population and records the
mean height of the sample. He repeats this procedure 49 times more. Which set of numbers
(those recorded by Andrew or those recorded by Bob) do you think will have more
variability? Explain your reasoning.
11)
Solve the problem.
12)
The ages of six members on a board of directors of a nonprofit organization are shown
below.Member A B C D E F
Age 32 52 43 64 41 50
Consider these board members to be a population of interest. The table below shows all of
the possible samples of size four. For each sample, the people in the sample, their ages, and
the sample mean are listed. Use the table to find the mean of the variable x.
Sample Ages x
A, B, C, D
A, B, C, E
A, B, C, F
A, B, D, E
A, B, D, F
A, B, E, F
A, C, D, E
A, C, D, F
A, C, E, F
A, D, E, F
B, C, D, E
B, C, D, F
B, C, E, F
B, D, E, F
C, D, E, F
32, 52, 43, 64
32, 52, 43, 41
32, 52, 43, 50
32, 52, 64, 41
32, 52, 64, 50
32, 52, 41, 50
32, 43, 64, 41
32, 43, 64, 50
32, 43, 41, 50
32, 64, 41, 50
52, 43, 64, 41
52, 43, 64, 50
52, 43, 41, 50
52, 64, 41, 50
43, 64, 41, 50
47.75
42
44.25
47.25
49.5
43.75
45
47.25
41.5
46.75
50
52.25
46.5
51.75
49.5
12)
Draw the specified dotplot.
13)
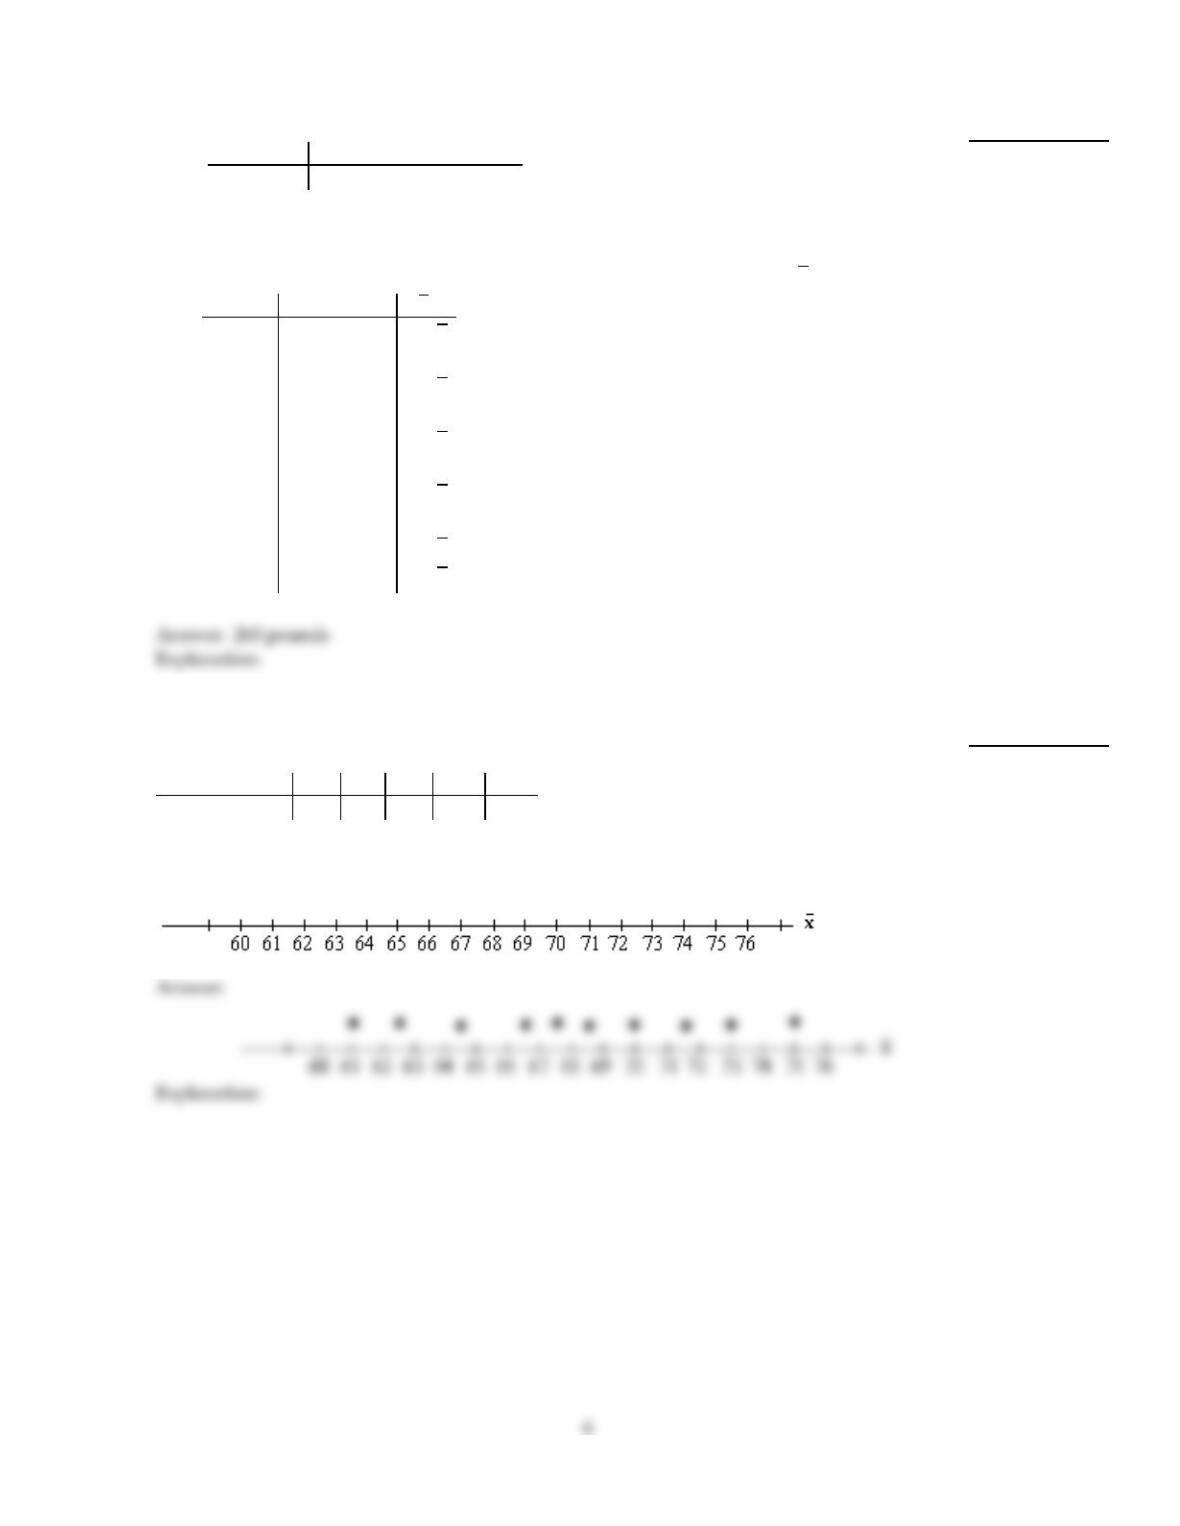
The heights (in inches) of 5 players on a basketball team are given in the table.
Player A B C D E
Height (inches) 66 69 72 69 72
Draw a dotplot for the sampling distribution of the sample mean for samples of size 4.
13)
Solve the problem.
14)
The weights of five players on a football team are shown below.
Player A B C D E
Weight (lb) 290 310 250 255 220
Consider these players to be a population of interest. The table below shows all of the
possible samples of size three. For each sample, the players in the sample, their weights,
and the sample mean are listed. Use the table to find the mean of the variable x.
Sample Weights x
A, B, C 290, 310,250 283.3
A, B, D 290, 310, 255 285
A, B, E 290, 310 220 273.3
A, C, D 290, 250, 255 265
A, C, E 290, 250, 220 253.3
A, D, E 290, 255, 220 255
B, C, D 310, 250, 255 271.6
B, C, E 310, 250, 220 260
B, D, E 310, 255, 220 261.6
C, D, E 250, 255, 220 241.6
14)
Draw the specified dotplot.
15)
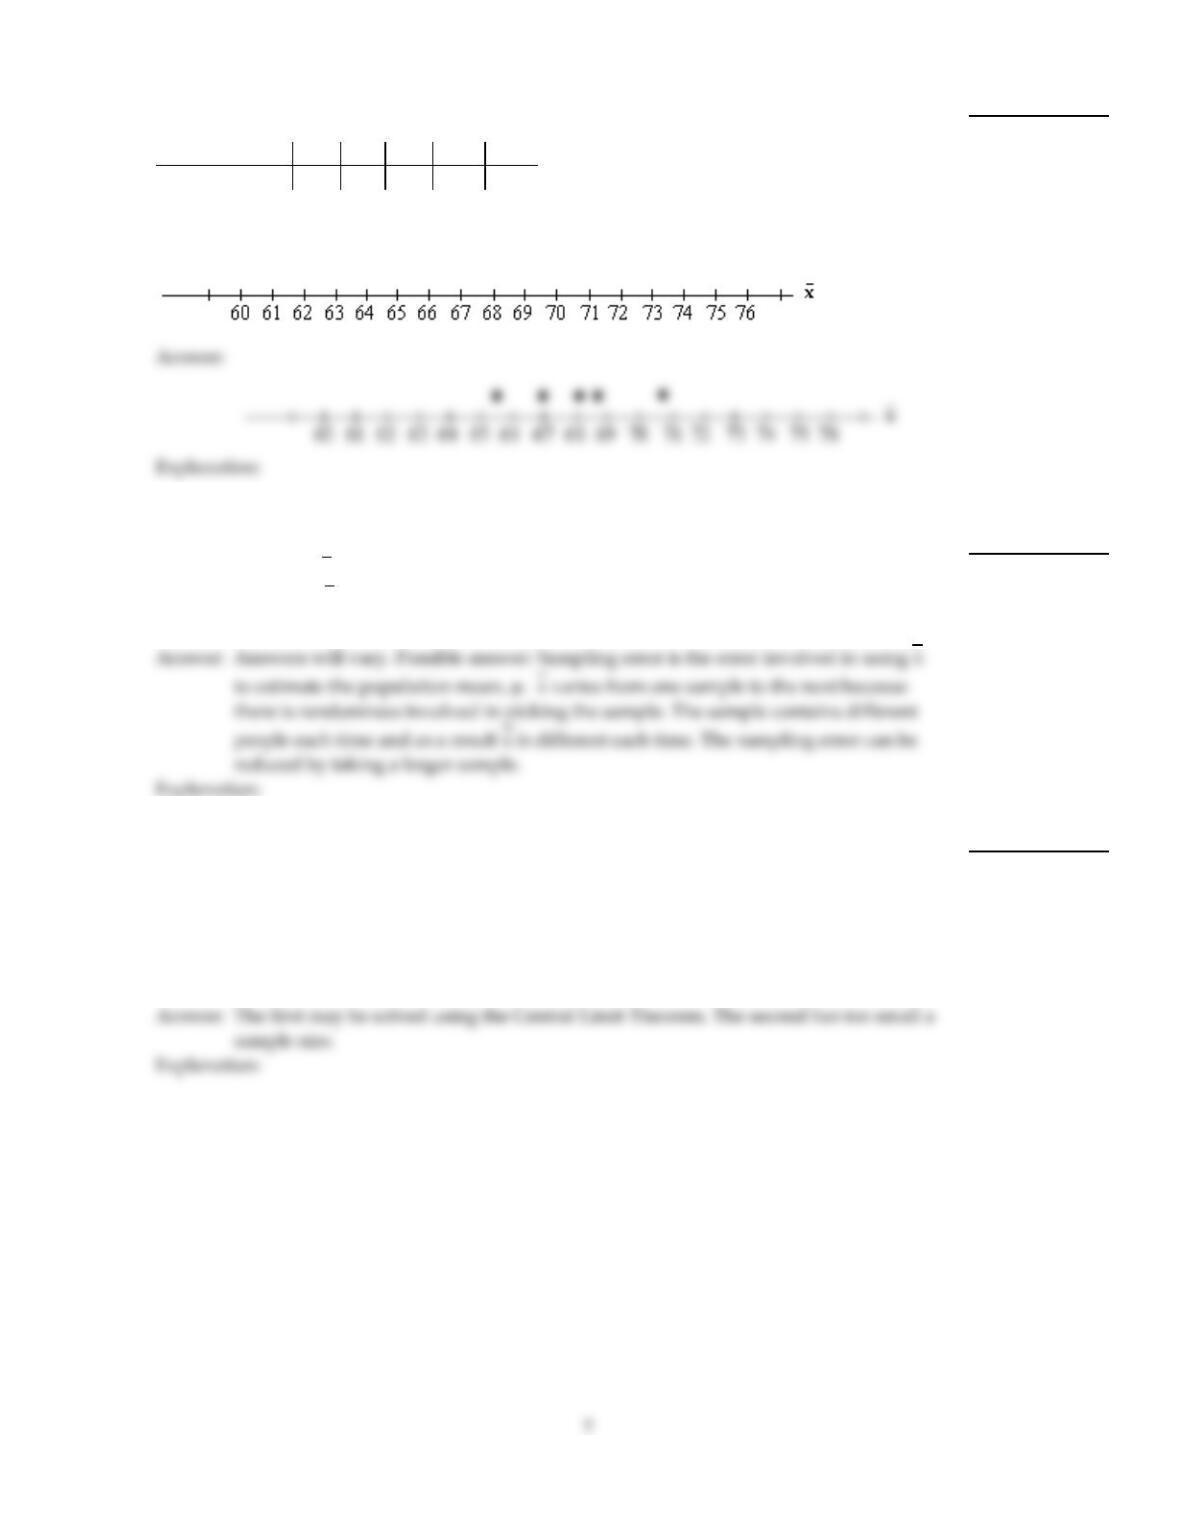
The heights (in inches) of 5 players on a basketball team are given in the table.
Player A B C D E
Height (inches) 65 78 72 68 57
Draw a dotplot for the sampling distribution of the sample mean for samples of size 2.
15)
16)
The heights (in inches) of 5 players on a basketball team are given in the table.
Player A B C D E
Height (inches) 65 78 72 68 57
Draw a dotplot for the sampling distribution of the sample mean for samples of size 4.
16)
Provide an appropriate response.
17)
Suppose that µ represents the mean height for a population of people. Suppose that you
use a sample mean, x, to estimate µ. Explain what is meant by sampling error in this
situation. Why does x vary from one sample to the next? How can you reduce the likely
sampling error?
17)
18)
The typical computer random–number generator yields numbers in a uniform distribution
between 0 and 1, with a mean of 0.500 and a standard deviation of 0.289. Consider the
following two problems, which appear at a glance to be very similar. One can be solved
using the Central Limit Theorem. Which one and why?
(a) Suppose a sample of size 50 is randomly generated. Find the probability that the mean
is below 0.300. (b) Suppose a sample of size 15 is randomly generated. Find the probability
that the mean is below 0.300.
18)
Solve the problem.
19)
The ages of six members of a board of directors of a nonprofit organization are shown
below.Member A B C D E F
Age 32 52 43 64 41 50
Consider these board members to be a population of interest. The mean age, µ, for the
population is 47. Construct a table that shows all of the possible samples of size two. For
each of the possible samples, list the people in the sample, their ages, and the sample mean.
The first line of the table is shown below.
Sample Ages x
A, B 32, 52 42
Use your table to find the probability that, for a random sample of size two, the sample
mean will equal the population mean.
19)
Provide an appropriate response.
20)
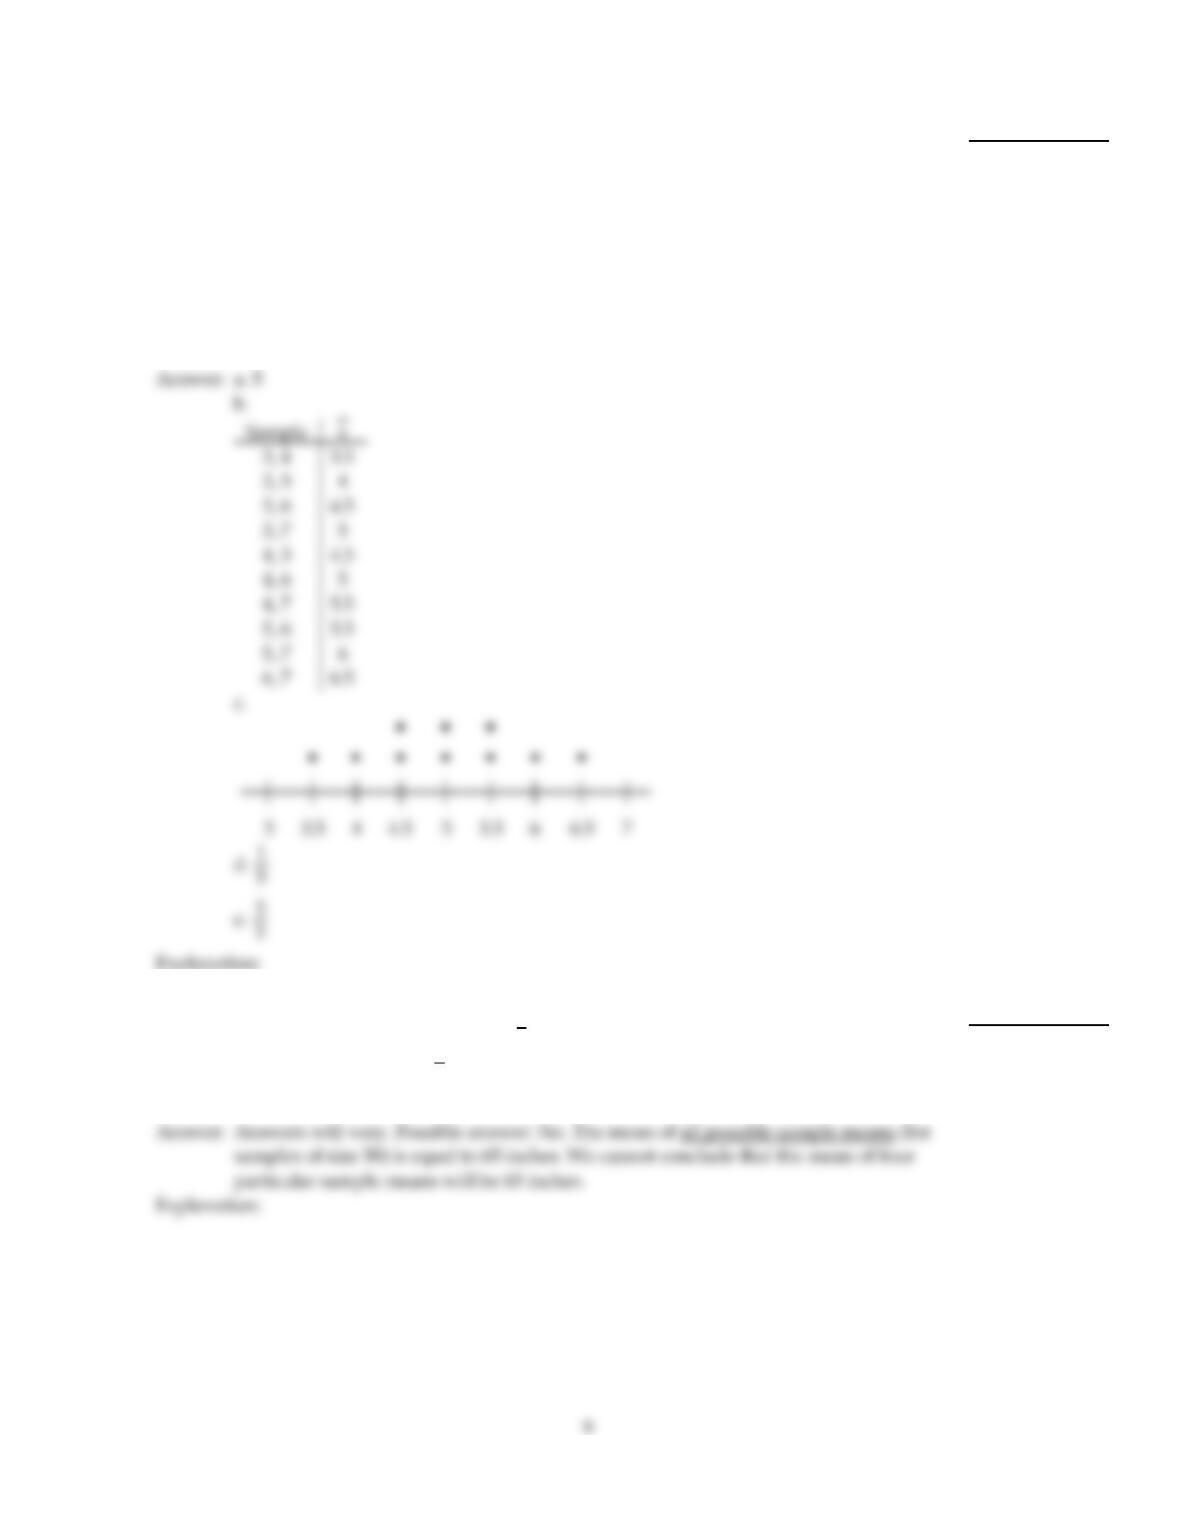
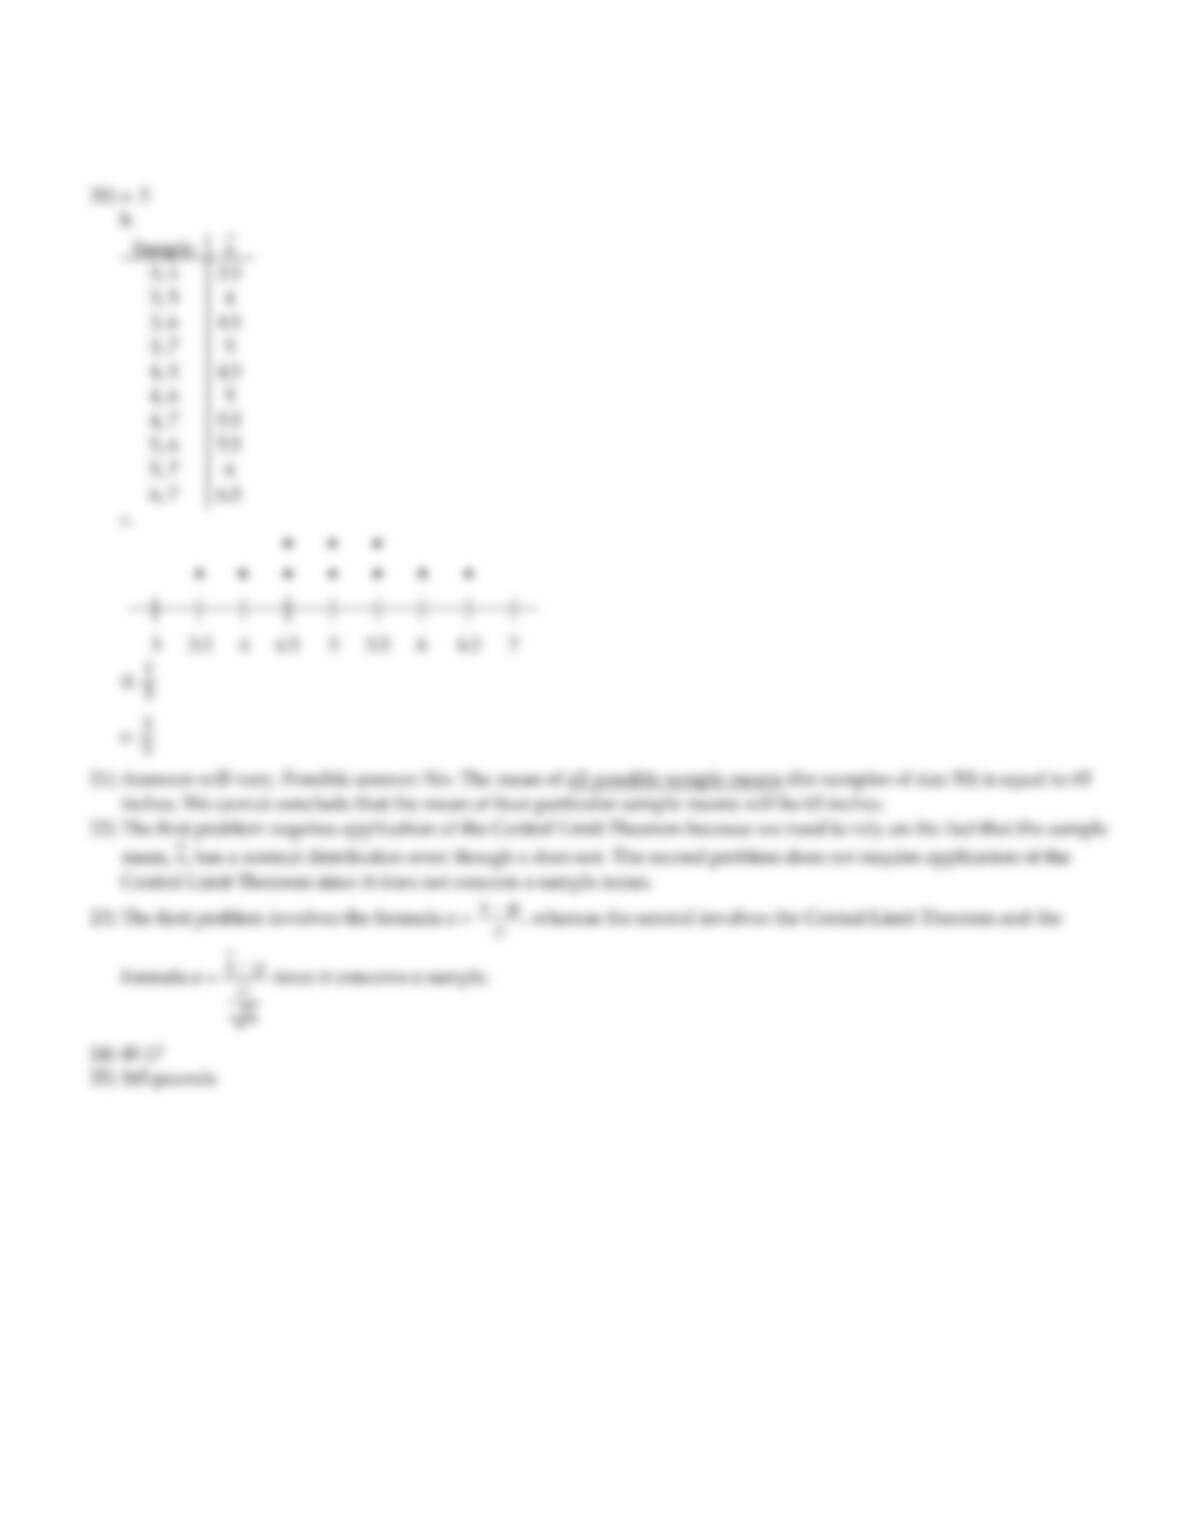
Population data: 3, 4, 5, 6, 7.
a. Find the mean, µ, of the variable.
b. Use the population data below to construct a table giving the sample means of sample
size n = 2.
c. Draw a dotplot for the sampling distribution of the sample mean.
d. Find the probability that the sample mean will equal the population mean.
e. Find the probability that the sampling error made in estimating the population mean by
the sampling mean will be 0.5 or less (in magnitude), that is, that the absolute value of the
difference between the sample mean and the population mean is at most 0.5.
20)
21)
The mean height for a population of people is 65 inches. Suppose that you pick a sample of
50 people and determine the sample mean, x. You then repeat this procedure three more
times. You learned in class that µx=µ. Can you conclude that the mean of the four
sample means will be equal to the population mean of 65 inches? Why or why not?
21)
22)
Consider the following two problems.
(a) A random–number generator yields numbers in a uniform distribution between 0 and
1 with a mean of 0.5 and a standard deviation of 0.289. You wish to find the probability
that the mean of a sample of 50 random numbers is greater than 0.6.
(b) Scores on an aptitude test are normally distributed with a mean of 82 and a standard
deviation of 11. You wish to find the probability that the score for a randomly selected
person is greater than 90.
Which of these two problems requires application of the Central Limit Theorem? Explain
your reasoning.
22)
23)
SAT verbal scores are normally distributed with a mean of 430 and a standard deviation of
120 (based on data from the College Board ATP). Consider the following two problems,
which appear at a glance to be very similar. Which one requires the application of the
Central Limit Theorem, and in what way does the solution process differ between the two
problems?
(a) If a student is randomly selected, what is the probability that his or her score is above
500?
(b) If a sample of 35 students is selected randomly, what is the probability that the sample
mean will be above 500?
23)
10
Solve the problem.
24)
The ages of six members on a board of directors of a nonprofit organization are shown
below.Member A B C D E F
Age 67 54 47 40 35 52
Consider these board members to be a population of interest. The table below shows all of
the possible samples of size five. For each sample, the people in the sample, their ages, and
the sample mean are listed. Use the table to find the mean of the variable x.
Sample Ages x
A, B, C, D, E
A, B, C, D, F
A, B, C, E, F
A, B, D, E, F
A, C, D, E, F
B, C, D, E, F
67, 54, 47, 40, 35
67, 54, 47, 40, 52
67, 54, 47, 35, 52
67, 54, 40, 35, 52
67, 47, 40, 35, 52
54, 47, 40, 35, 52
48.6
52
51
49.6
48.2
45.6
24)
25)
The weights of five players on a football team are shown below.
Player A B C D E
Weight (lb) 290 310 250 255 220
Consider these players to be a population of interest. The table below shows all of the
possible samples of size four. For each sample, the players in the sample, their weights, and
the sample mean are listed. Use the table to find the mean of the variable x.
Sample Weights x
A, B, C, D
A, B, C, E
A, B, D, E
A, C, D, E
B, C, D, E
290, 310, 250, 255
290, 310, 250, 220
290, 310, 255, 220
290, 250, 255, 220
310, 250, 255, 220
276.25
267.5
268.75
253.75
258.75
25)
26)
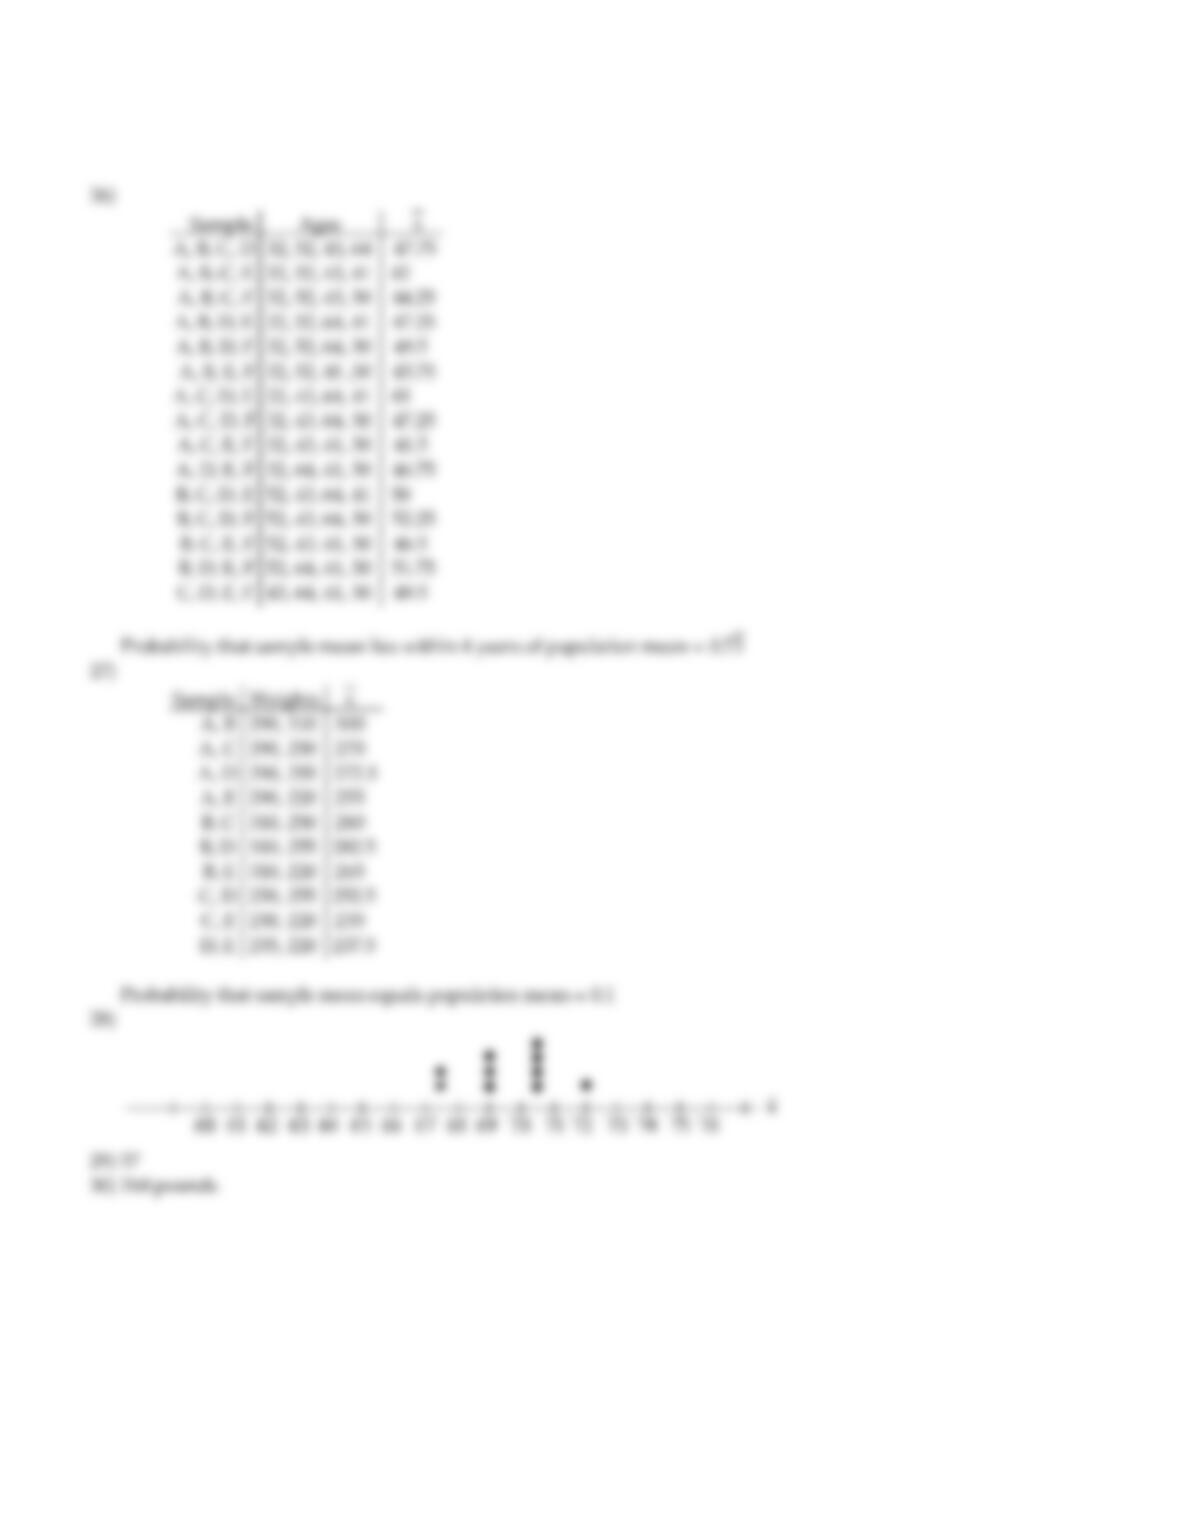
The ages of six members of a board of directors of a nonprofit organization are shown
below.Member A B C D E F
Age 32 52 43 64 41 50
Consider these board members to be a population of interest. The mean age, µ, for the
population is 47. Construct a table that shows all of the possible samples of size four. For
each of the possible samples, list the people in the sample, their ages, and the sample mean.
The first line of the table is shown below.
Sample Ages x
A, B, C, D 32, 52, 43, 64 47.75
Use your table to find the probability that, for a random sample of size four, the sample
mean will be within 4 years of the population mean.
26)
27)
The weights of five players on a football team are shown below.
Player A B C D E
Weight (lb) 290 310 250 255 220
Consider these players to be a population of interest. The mean weight, µ, for the
population is 265 pounds. Construct a table that shows all of the possible samples of size
two. For each of the possible samples, list the players in the sample, their weights, and the
sample mean. The first line of the table is shown below.
Sample Weights x
A, B 290, 310 300
Use your table to find the probability that, for a random sample of size two, the sample
mean will equal the population mean.
27)
Draw the specified dotplot.
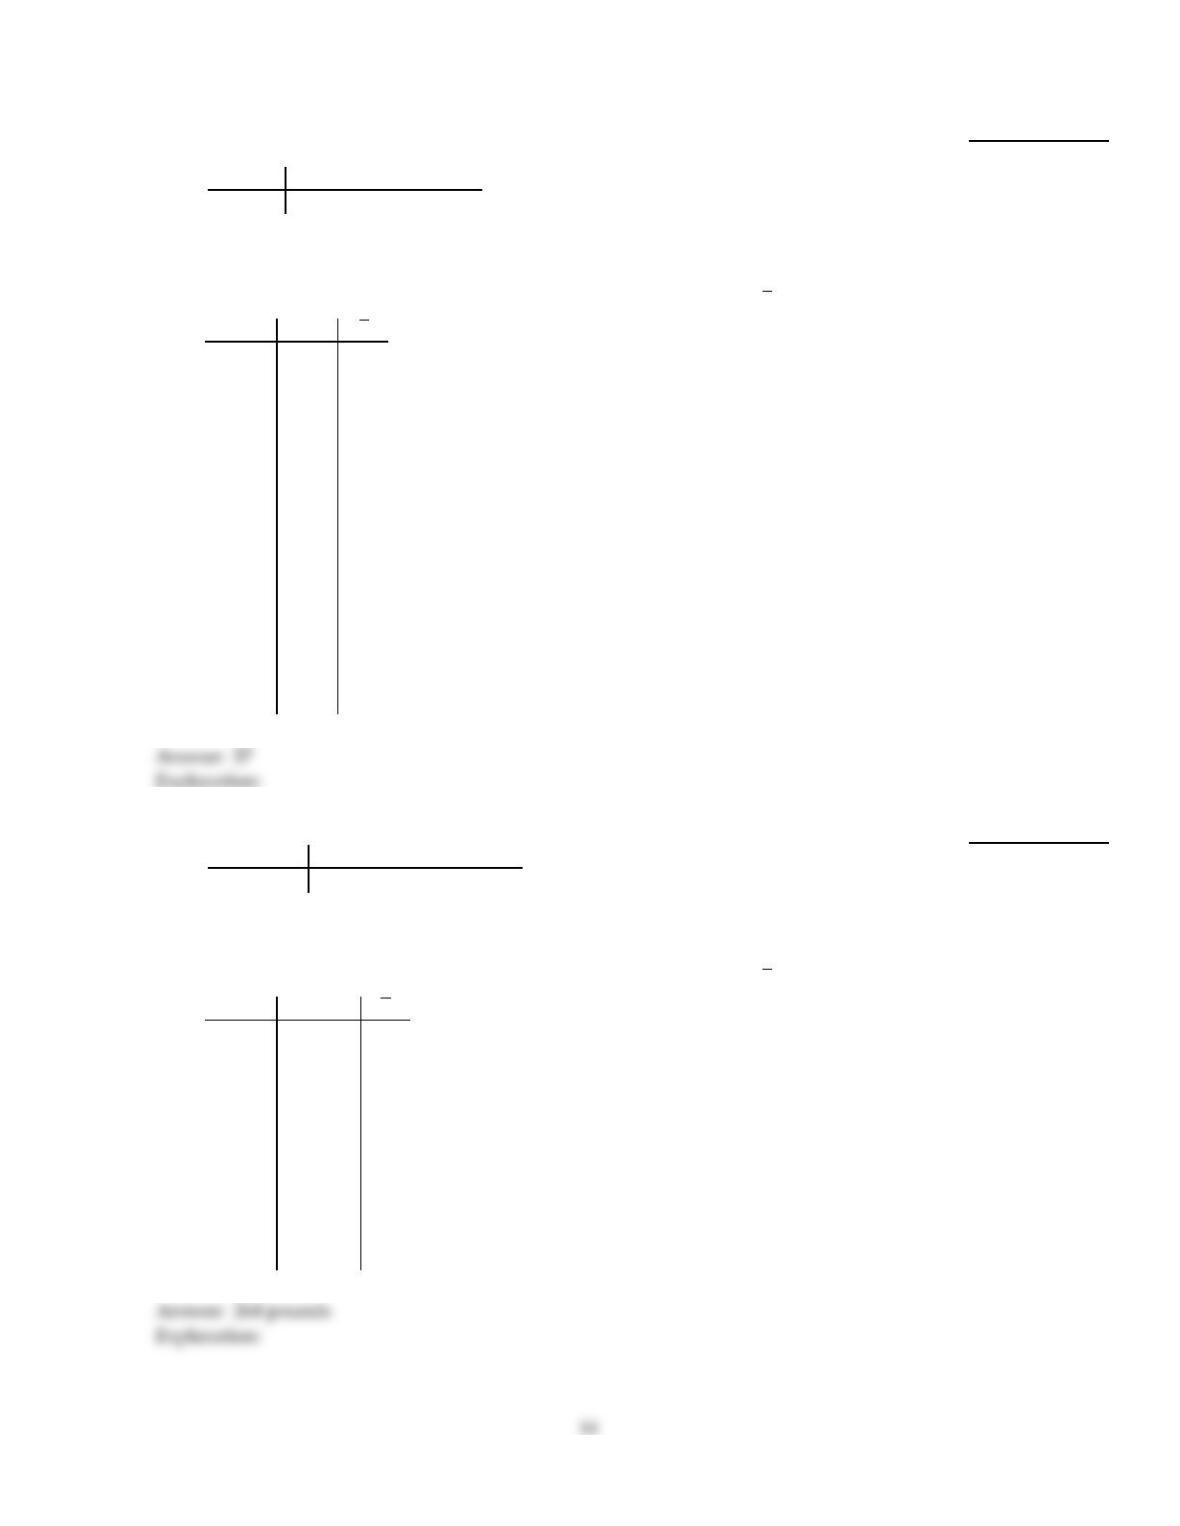
28)
The heights (in inches) of 5 players on a basketball team are given in the table.
Player A B C D E
Height (inches) 66 69 72 69 72
Draw a dotplot for the sampling distribution of the sample mean for samples of size 2.
28)
Solve the problem.
29)
The ages of six members on a board of directors of a nonprofit organization are shown
below.Member A B C D E F
Age 64 41 63 53 68 53
Consider these board members to be a population of interest. The table below shows all of
the possible samples of size two. For each sample, the people in the sample, their ages, and
the sample mean are listed. Use the table to find the mean of the variable x.
Sample Ages x
A, B
A, C
A, D
A, E
A, F
B, C
B, D
B, E
B, F
C, D
C, E
C, F
D, E
D, F
E, F
64, 41
64, 63
64, 53
64, 68
64, 53
41, 63
41, 53
41, 68
41, 53
63, 53
63, 68
63, 53
53, 68
53, 53
68, 53
52.5
63.5
58.5
66
58.5
52
47
54.5
47
58
65.5
58
60.5
53
60.5
29)
30)
The weights of five players on a football team are shown below.
Player A B C D E
Weight (lb) 275 310 290 250 215
Consider these players to be a population of interest. The table below shows all of the
possible samples of size two. For each sample, the players in the sample, their weights, and
the sample mean are listed. Use the table to find the mean of the variable x.
Sample Weights x
A, B
A, C
A, D
A, E
B, C
B, D
B, E
C, D
C, E
D, E
275, 310
275, 290
275, 250
275, 215
310, 290
310, 250
310, 215
290, 250
290, 215
250, 215
292.5
282.5
262.5
245
300
280
262.5
270
252.5
232.5
30)
31)
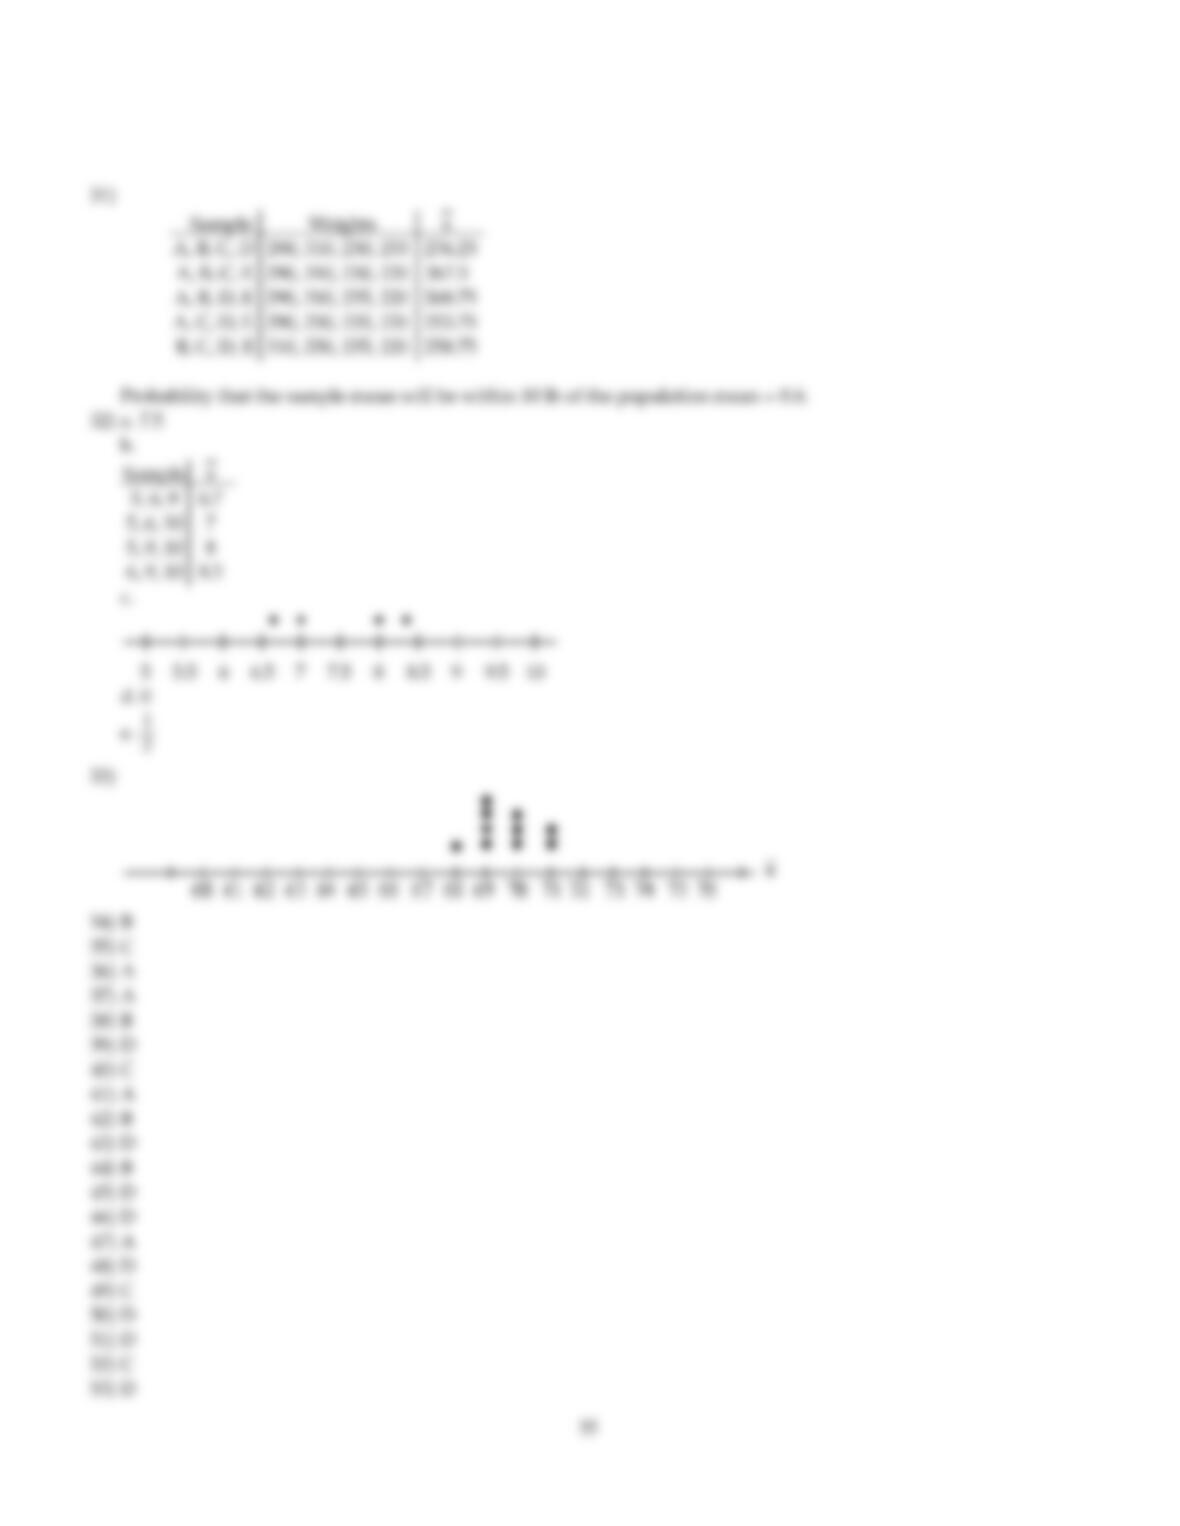
The weights of five players on a football team are shown below.
Player A B C D E
Weight (lb) 290 310 250 255 220
Consider these players to be a population of interest. The mean weight, µ, for the
population is 265 pounds. Construct a table that shows all of the possible samples of size
four. For each of the possible samples, list the players in the sample, their weights, and the
sample mean. The first line of the table is shown below.
Sample Weights x
A, B, C, D 290, 310, 250, 255 276.25
Use your table to find the probability that, for a random sample of size four, the sample
mean will be within 10 lb of the population mean.
31)
Provide an appropriate response.
32)
Population data: 5, 6, 9, 10.
a. Find the mean, µ, of the variable.
b. Use the population data below to construct a table giving the sample means of sample
size n = 3.
c. Draw a dotplot for the sampling distribution of the sample mean.
d. Find the probability that the sample mean will equal the population mean.
e. Find the probability that the sampling error made in estimating the population mean by
the sampling mean will be 0.5 or less (in magnitude), that is, that the absolute value of the
difference between the sample mean and the population mean is at most 0.5.
32)
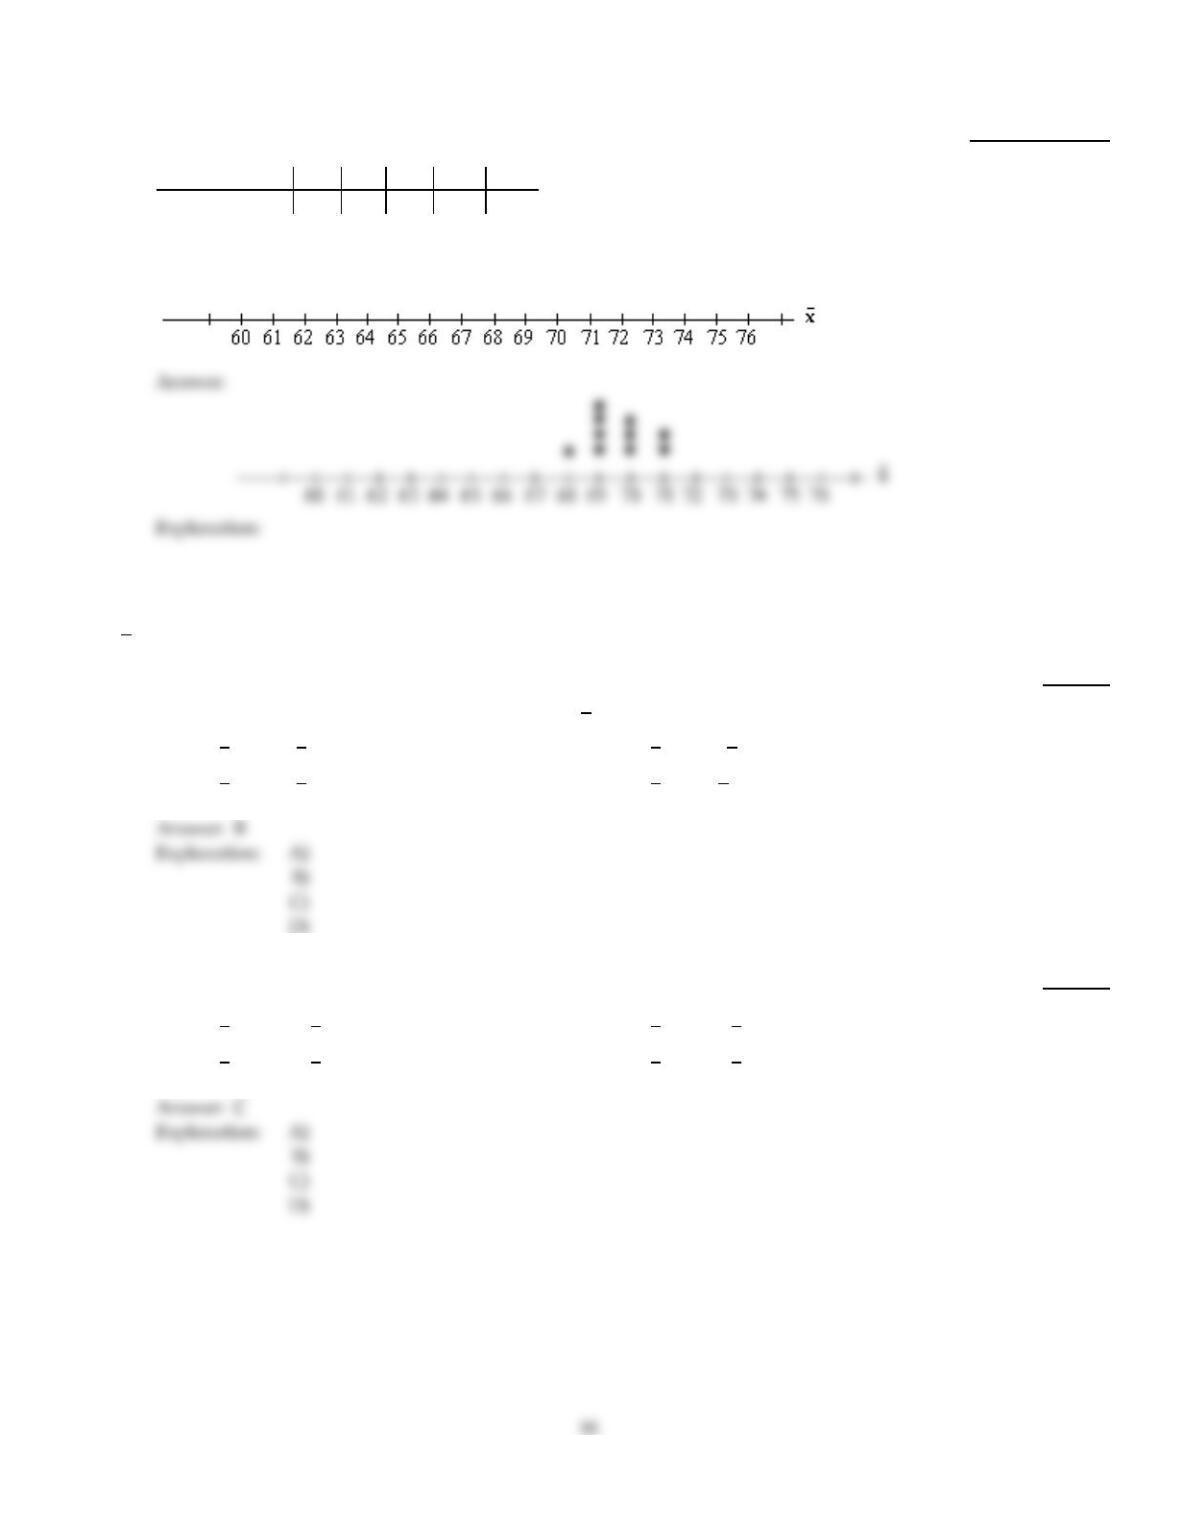
Draw the specified dotplot.
33)
The heights (in inches) of 5 players on a basketball team are given in the table.
Player A B C D E
Height (inches) 66 69 72 69 72
Draw a dotplot for the sampling distribution of the sample mean for samples of size 3.
33)
MULTIPLE CHOICE. Choose the one alternative that best completes the statement or answers the question.
For samples of the specified size from the population described, find the mean and standard deviation of the sample
mean x.
34)
One truck from Lakeland Trucking, Inc. can carry a load of 3880.8 lb. Records show that the
weights of boxes that it carries have a mean of 75 lb and a standard deviation of 14 lb. For samples
of size 49, find the mean and standard deviation of x.
34)
A)
µx=75; x=14
B)
µx=75; x=2
C)
µx=14; x=75
D)
µx=2; x=75
35)
The mean and the standard deviation of the sampled population are, respectively, 43.5 and 5.2.
n =289
35)
A)
µx=15.1; x=2.0
B)
µx=5.2; x=0.3
C)
µx=43.5; x=0.3
D)
µx=0.3; x=43.5
Provide an appropriate response.
36)
How many different samples of size 4 can be obtained from a population of size 5?
36)
A)
5
B)
4
C)
1
D)
10
For samples of the specified size from the population described, find the mean and standard deviation of the sample
mean x.
37)
The mean and the standard deviation of the sampled population are, respectively, 158.3 and 33.0.
n =81
37)
A)
µx=158.3; x=3.7
B)
µx=33.0; x=3.7
C)
µx=348.3; x=1.9
D)
µx=3.7; x=158.3
Identify the distribution of the sample mean. In particular, state whether the distribution of x is normal or approximately
normal and give its mean and standard deviation.
38)
Let x represent the number that shows up when a balanced die is rolled. Then x is a random
variable with a mean of 3.5 and a standard deviation of 1.71. Let x denote the mean of the numbers
obtained when the die is rolled 32 times. Determine the sampling distribution of x.
38)
A)
Normal, mean = 3.5, standard deviation =0.3
B)
Approximately normal, mean = 3.5, standard deviation =0.3
C)
Approximately normal, mean = 3.5, standard deviation = 1.71
D)
Normal, mean = 3.5, standard deviation =0.05
Find the requested probability.
39)
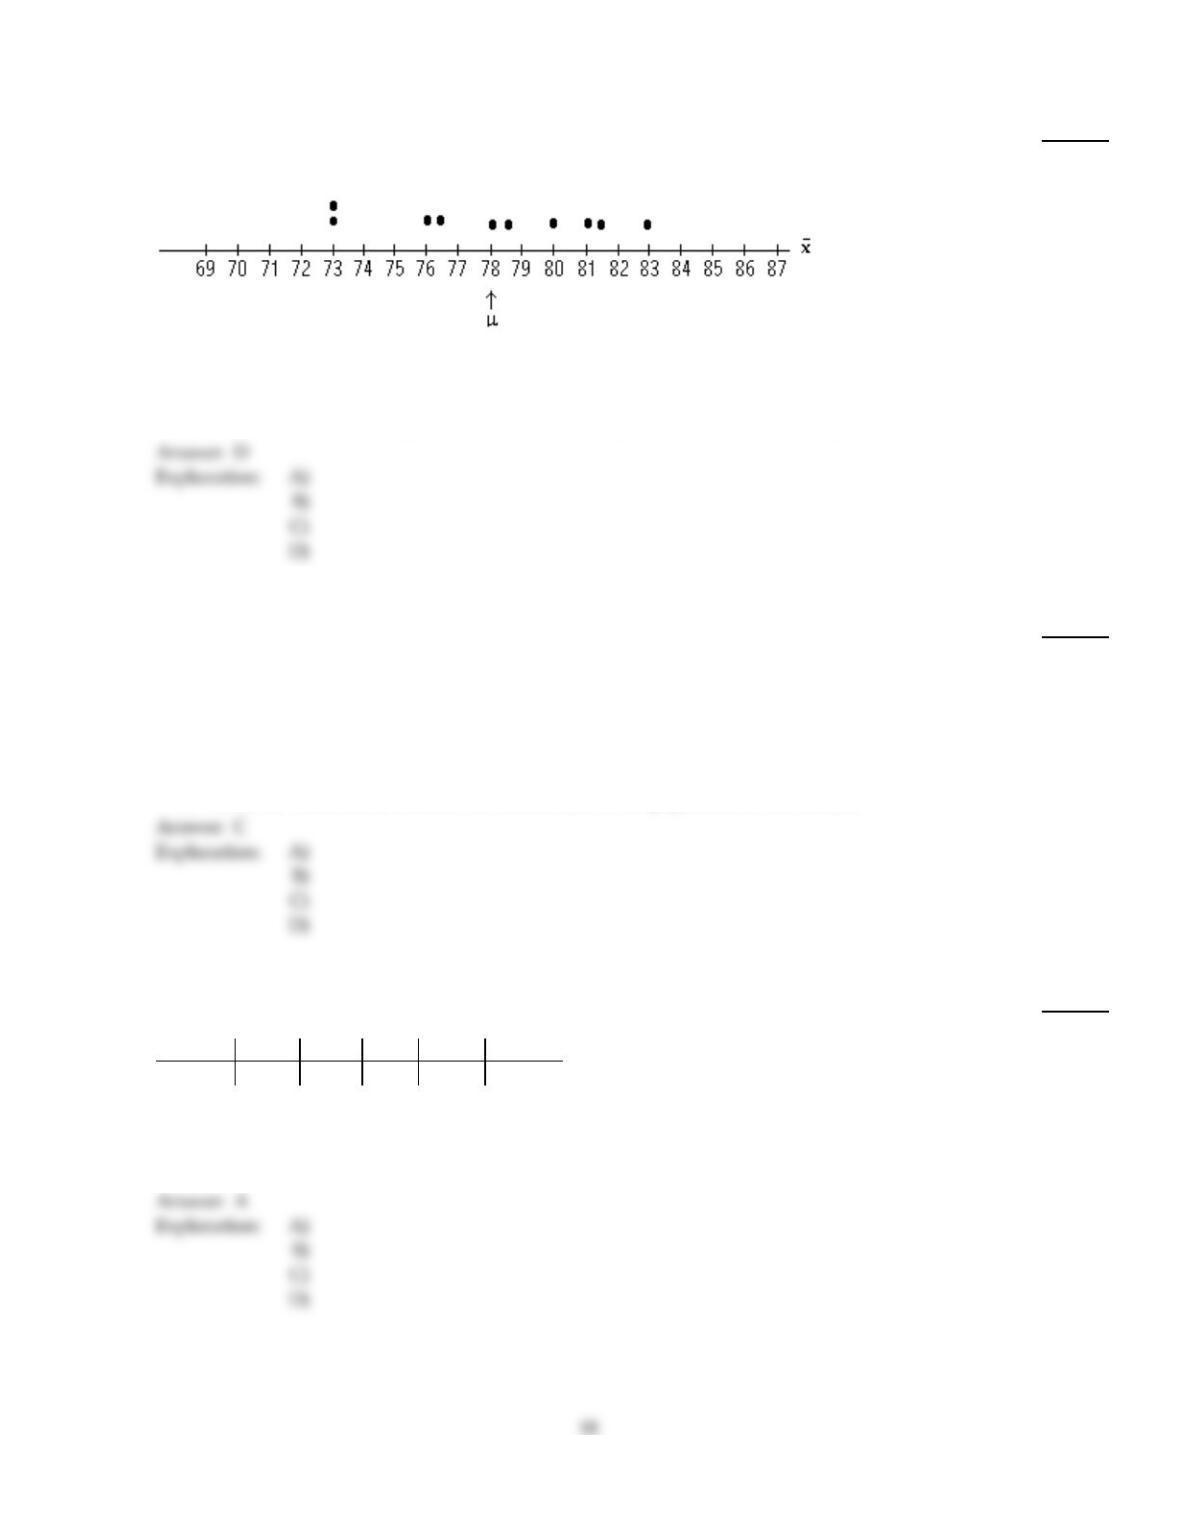
The test scores of 5 students are under consideration. The following is the dotplot for the sampling
distribution of the sample mean for samples of size 2.
Find the probability, expressed as a percent, that the sample mean will be within 1 point of the
population mean.
39)
A)
10%
B)
30%
C)
25%
D)
20%
Find the indicated probability or percentage for the sampling error.
40)
The distribution of weekly salaries at a large company is right skewed with a mean of $1000 and a
standard deviation of $350. What is the probability that the sampling error made in estimating the
mean weekly salary for all employees of the company by the mean of a random sample of weekly
salaries of 50 employees will be at most $50?
40)
A)
0.3438
B)
0.3124
C)
0.6876
D)
Cannot be determined, because the distribution of the population is not normal.
Find the requested probability.
41)
The table reports the GPA for each of five students in a statistics class.
Student Maria Alvin Elvis Ingrid Rashad
GPA 3.52 3.65 3.66 3.92 3.95
For a random sample of size two, find the probability, expressed as a percent, that the sample mean
will be within 0.1 of the population mean.
41)
A)
70%
B)
80%
C)
20%
D)
30%
For samples of the specified size from the population described, find the mean and standard deviation of the sample
mean x.
42)
The National Weather Service keeps records of snowfall in mountain ranges. Records indicate that
in a certain range, the annual snowfall has a mean of 83 inches and a standard deviation of 14
inches. Suppose the snowfalls are sampled during randomly picked years. For samples of size 49,
determine the mean and standard deviation of x.
42)
A)
µx=14; x=83
B)
µx=83; x=2
C)
µx=83; x=14
D)
µx=2; x=83
Identify the distribution of the sample mean. In particular, state whether the distribution of x is normal or approximately
normal and give its mean and standard deviation.
43)
The mean annual income for adult women in one city is $28,520 and the standard deviation of the
incomes is $5100. The distribution of incomes is skewed to the right. Determine the sampling
distribution of the mean for samples of size 74.
43)
A)
Approximately normal, mean = $28,520, standard deviation = $5100
B)
Normal, mean = $28,520, standard deviation = $69
C)
Normal, mean = $28,520, standard deviation = $593
D)
Approximately normal, mean = $28,520, standard deviation = $593
Use the given table to determine the mean, µx, of the variable x for the given sample size.
44)
Sample x
5, 6, 96.7
5, 6, 10 7
5, 9, 10 8
6, 9, 10 8.3
44)
A)
7
B)
7.5
C)
8
D)
10
Find the requested probability.
45)
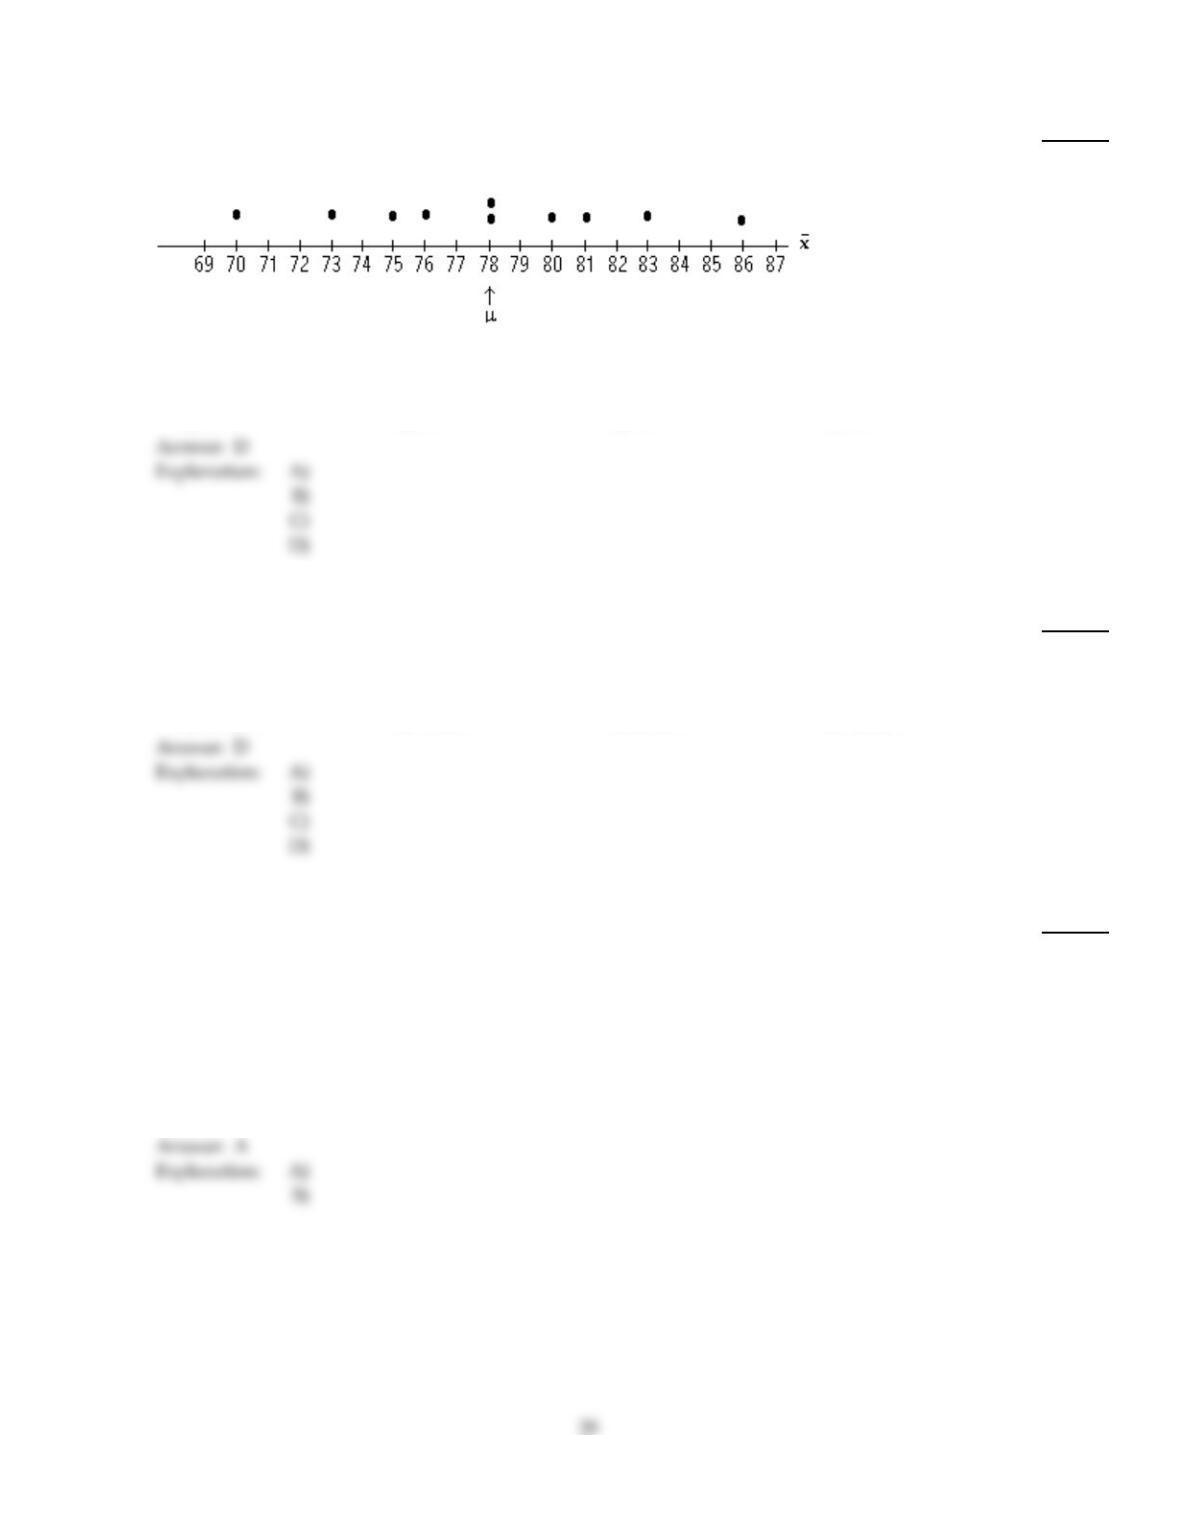
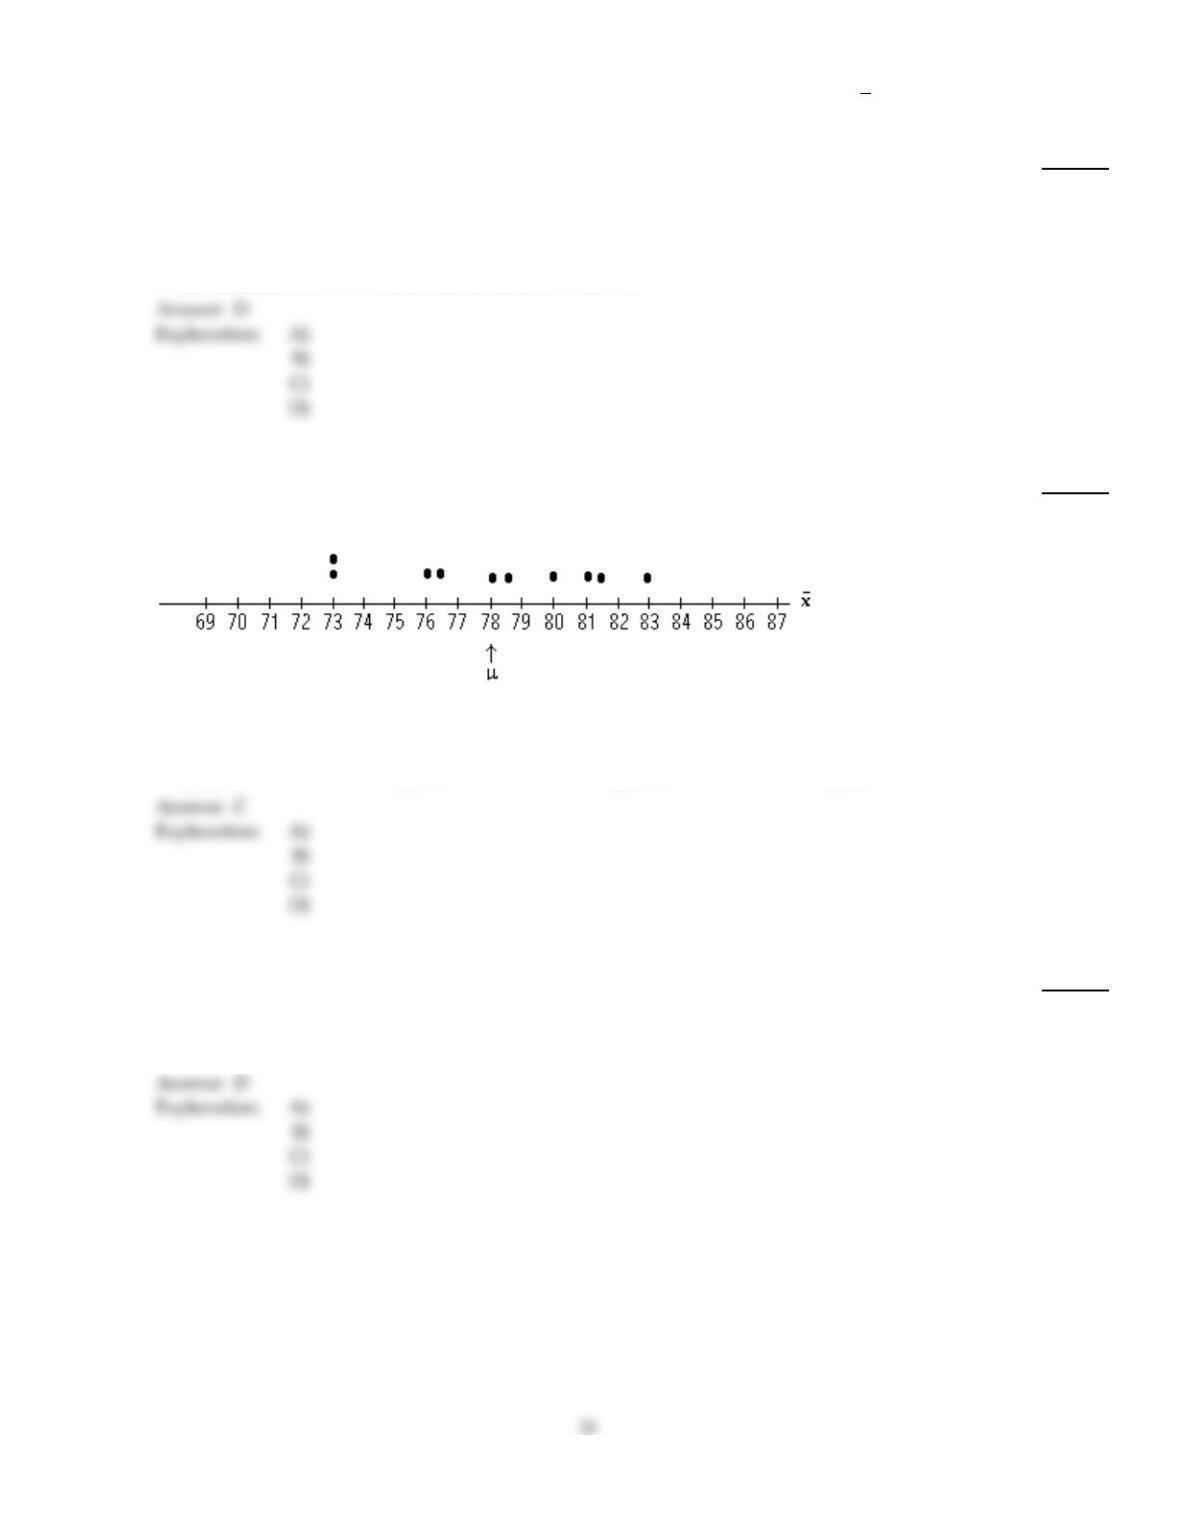
The test scores of 5 students are under consideration. The following is the dotplot for the sampling
distribution of the sample mean for samples of size 2.
Find the probability, expressed as a percent, that the sample mean will be within 2 points of the
population mean.
45)
A)
30%
B)
20%
C)
50%
D)
40%
Find the indicated probability or percentage for the sampling error.
46)
The monthly expenditures on food by single adults living in one neighborhood of Los Angeles are
normally distributed with a mean of $370 and a standard deviation of $45. Determine the
percentage of samples of size 9 that will have mean monthly expenditures on food within $27 of
the population mean expenditure of $370.
46)
A)
46.41%
B)
96.41%
C)
63.18%
D)
92.82%
Provide an appropriate response.
47)
The mean height for a population is 65 inches and the standard deviation is 3 inches. Let A and B
denote the events described below.
Event A: The height of a randomly selected person is 5 inches or more from the population mean.
Event B: The mean height in a random sample of 16 people is 5 inches or more from the population
mean.
True or false, the probability of event A is greater than the probability of event B?
47)
A)
True
B)
False
Identify the distribution of the sample mean. In particular, state whether the distribution of x is normal or approximately
normal and give its mean and standard deviation.
48)
The weights of people in a certain population are normally distributed with a mean of 159 lb and a
standard deviation of 24 lb. Determine the sampling distribution of the mean for samples of size 5.
48)
A)
Approximately normal, mean =159 lb, standard deviation =4.8 lb
B)
Approximately normal, mean =159 lb, standard deviation =10.73 lb
C)
Normal, mean =159 lb, standard deviation =24 lb
D)
Normal, mean =159 lb, standard deviation =10.73 lb
Find the requested probability.
49)
The test scores of 5 students are under consideration. The following is the dotplot for the sampling
distribution of the sample mean for samples of size 2.
Find the probability, expressed as a percent, that the sample mean will be within 2 points of the
population mean.
49)
A)
60%
B)
30%
C)
50%
D)
40%
Provide an appropriate response.
50)
As a general rule, you cannot expect to exactly determine the sampling distribution of a statistic.
Why?
50)
A)
Many populations are not uniform.
B)
Many populations are too small.
C)
Many populations are not normal.
D)
Many populations are too large.
51)
What generally happens to the sampling error as the sample size is increased?
51)
A)
It gets less predictable.
B)
It gets more predictable.
C)
It gets larger.
D)
It gets smaller.
For samples of the specified size from the population described, find the mean and standard deviation of the sample
mean x.
52)
The National Weather Service keeps records of rainfall in valleys. Records indicate that in a certain
valley, the annual rainfall has a mean of 97 inches and a standard deviation of 12 inches. Suppose
the rainfalls are sampled during randomly picked years and x is the mean amount of rain in these
years. For samples of size 36, determine the mean and standard deviation of x.
52)
A)
µx=2; x=97
B)
µx=97; x=12
C)
µx=97; x=2
D)
µx=12; x=97
Find the indicated probability or percentage for the sampling error.
53)
The amount of coffee that a filling machine puts into an 8–ounce jar is normally distributed with a
mean of 8.2 ounces and a standard deviation of 0.18 ounce. Determine the percentage of samples of
size 16 that will have mean amounts of coffee within 0.1 ounce of the population mean of 8.2
ounces.
53)
A)
71.23%
B)
98.68%
C)
42.46%
D)
97.36%
22
Find the requested probability.
54)
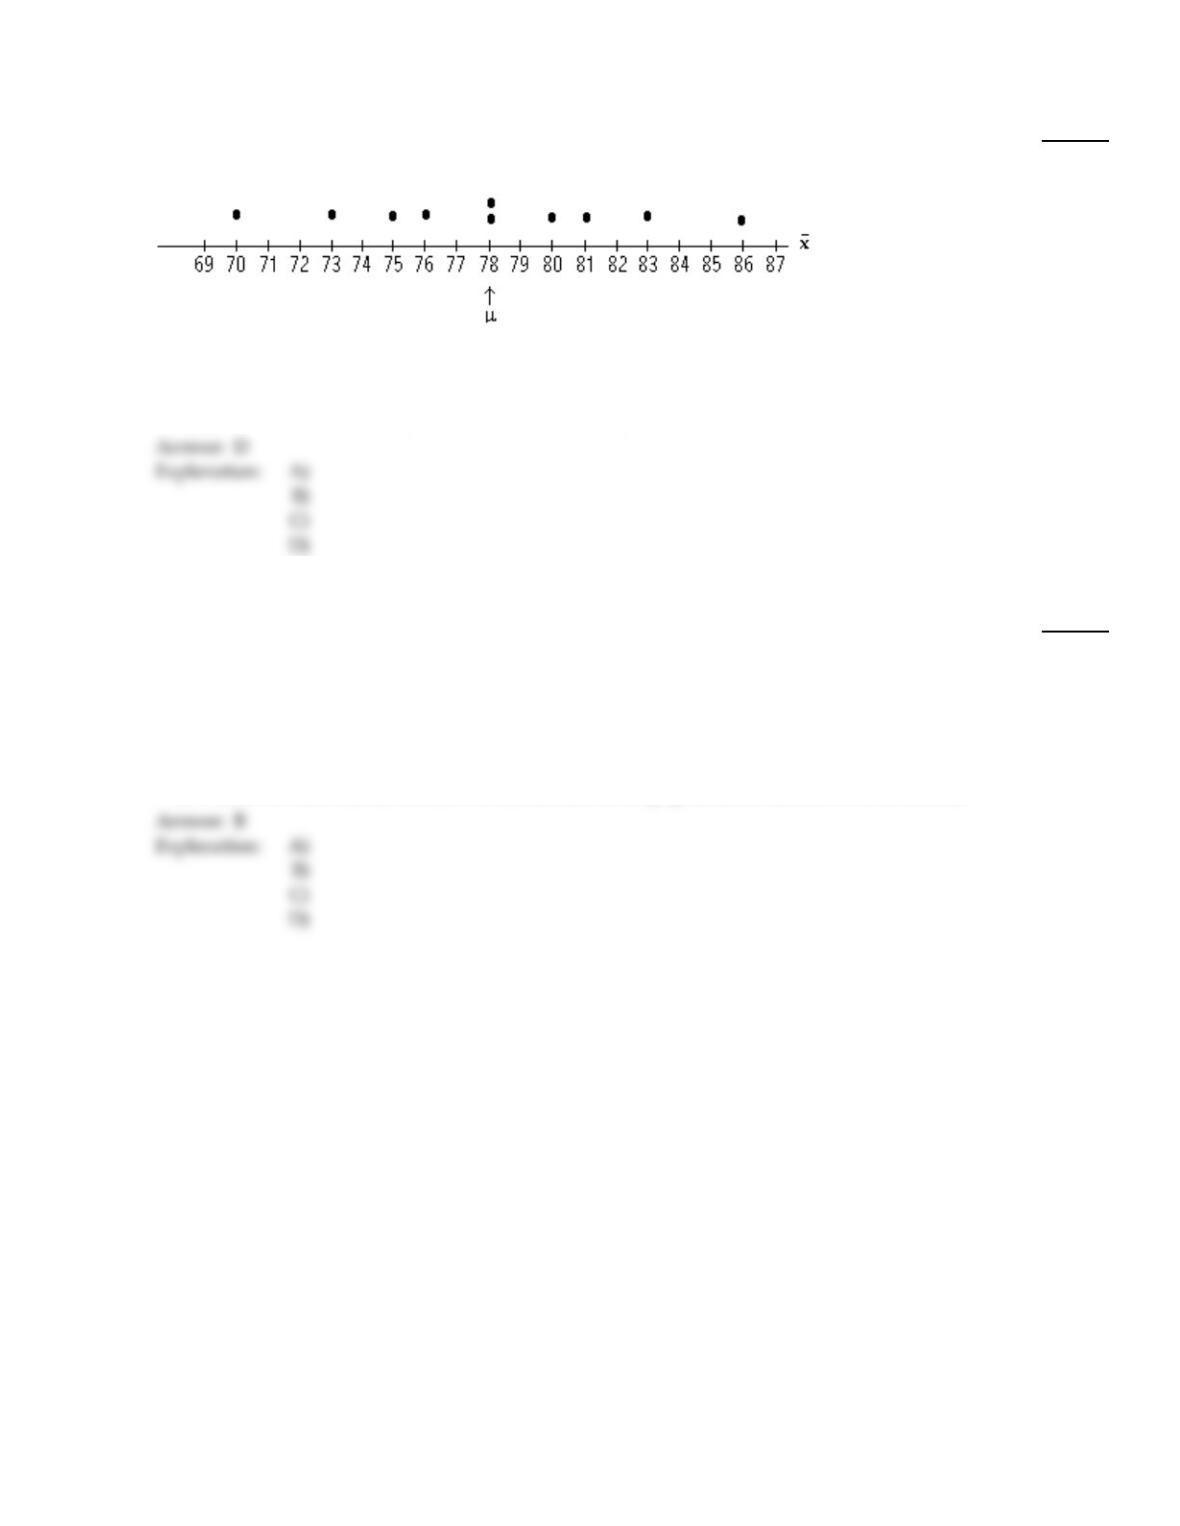
The test scores of 5 students are under consideration. The following is the dotplot for the sampling
distribution of the sample mean for samples of size 2.
Find the probability, expressed as a percent, that the sample mean will be equal to the population
mean.
54)
A)
30%
B)
10%
C)
5%
D)
20%
Find the indicated probability or percentage for the sampling error.
55)
Scores on an aptitude test are distributed with a mean of 220 and a standard deviation of 30. The
shape of the distribution is unspecified. What is the probability that the sampling error made in
estimating the population mean by the mean of a random sample of 50 test scores will be at most
5 points?
55)
A)
0.881
B)
0.762
C)
0.135
D)
Cannot be determined, because the distribution of the population is not known to be normal.
23
Use the given table to determine the mean, µx, of the variable x for the given sample size.
56)
Sample x
2, 32.5
2, 4 3
2, 53.5
2, 6 4
3, 43.5
3, 5 4
3, 64.5
4, 54.5
4, 6 5
5, 65.5
56)
A)
4
B)
5
C)
4.5
D)
3.5
Provide an appropriate response.
57)
The mean height for a population is 65 inches and the standard deviation is 3 inches. Let A and B
denote the events described below.
Event A: The height of a randomly selected person is within 3 inches of the population mean.
Event B: The mean height in a random sample of 16 people is within 3 inches of the population
mean.
True or false, the probability of event A is greater than the probability of event B?
57)
A)
True
B)
False
For samples of the specified size from the population described, find the mean and standard deviation of the sample
mean x.
58)
One barge from Inland Waterways, Inc. can carry a load of 6284.8 lb. Records of past trips show
that the weights of the cans that it carries have a mean of 94 lb and a standard deviation of 16 lb.
For samples of size 64, find the mean and standard deviation of x.
58)
A)
µx=94; x=2
B)
µx=2; x=94
C)
µx=16; x=94
D)
µx=94; x=16
Find the requested probability.
59)
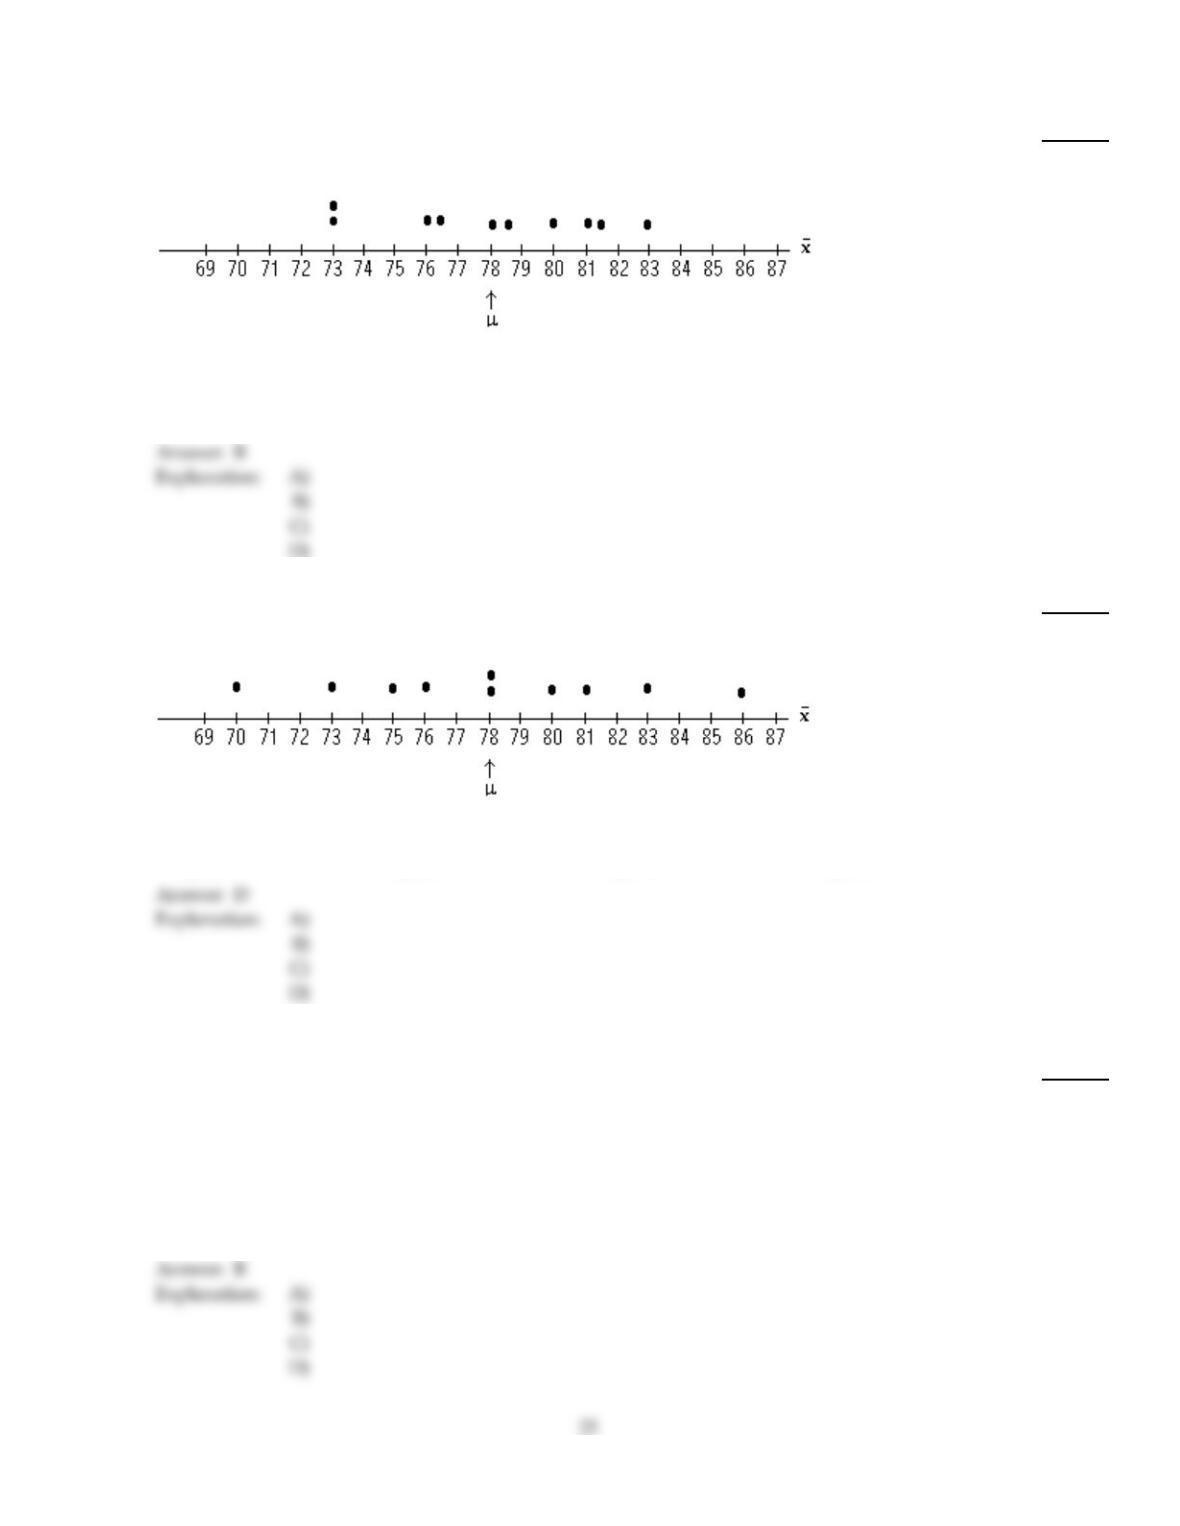
The test scores of 5 students are under consideration. The following is the dotplot for the sampling
distribution of the sample mean for samples of size 2.
Find the probability, expressed as a percent, that the sample mean will be within 3 points of the
population mean.
59)
A)
40%
B)
60%
C)
72%
D)
50%
60)
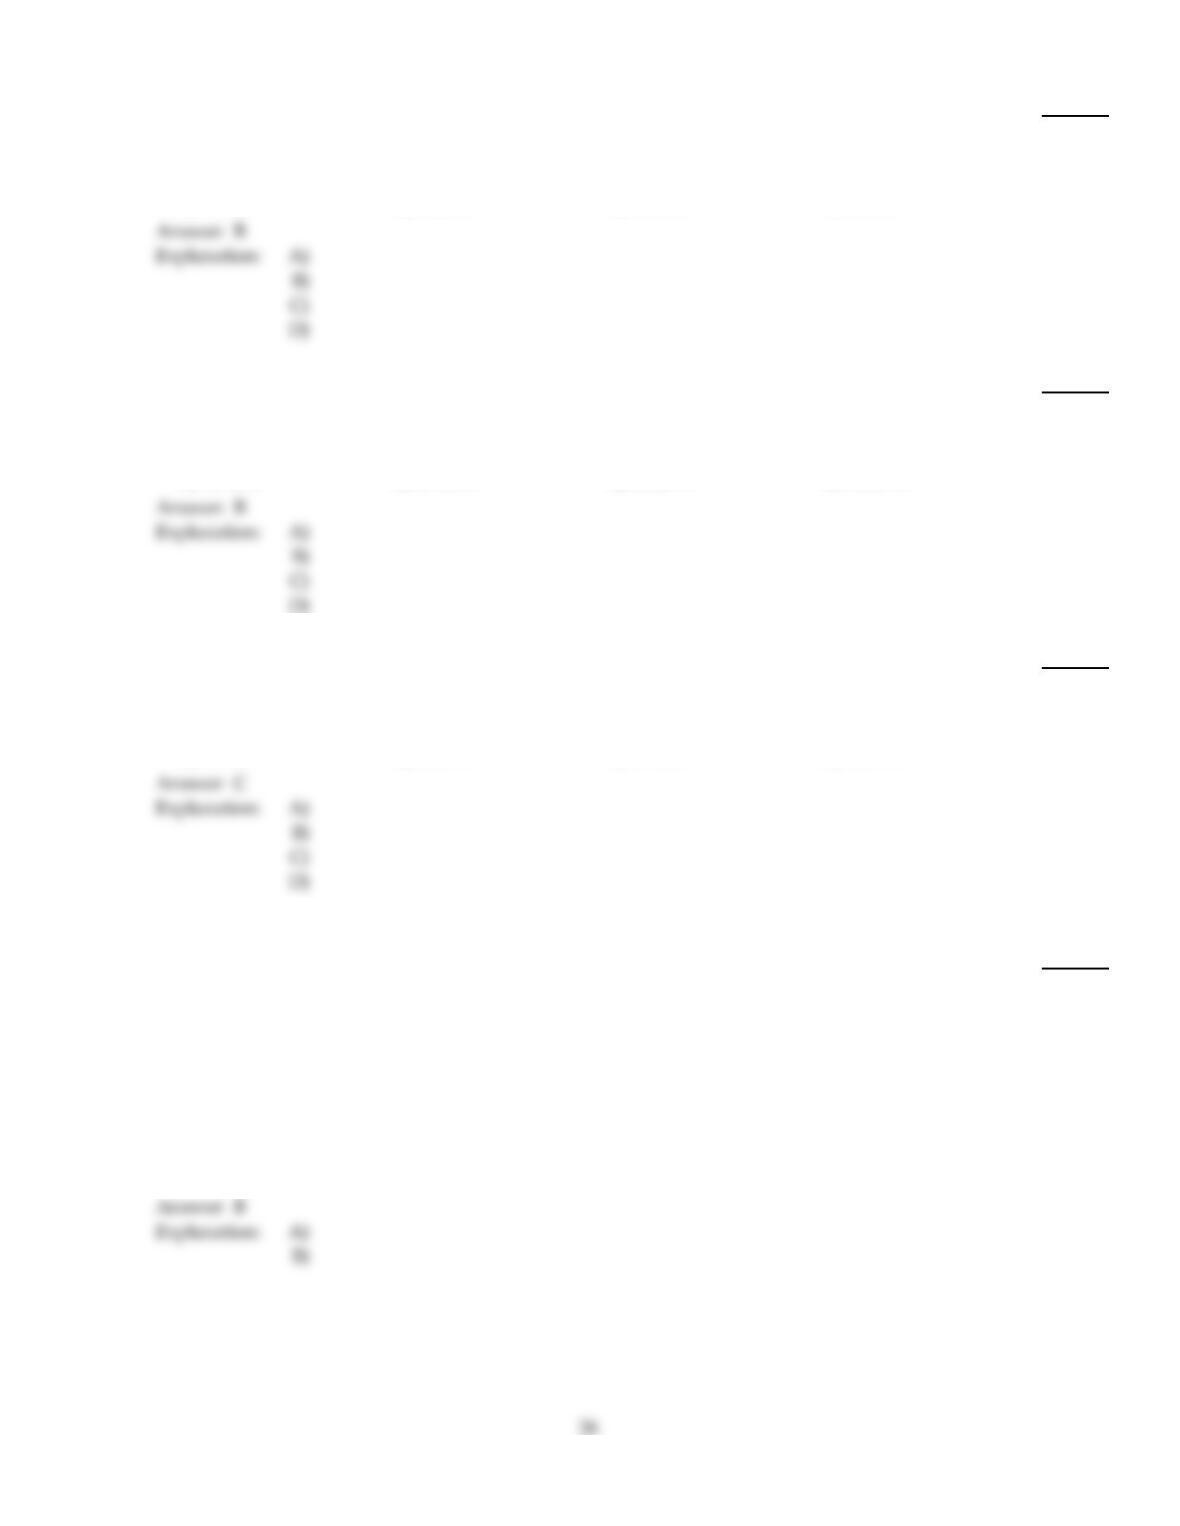
The test scores of 5 students are under consideration. The following is the dotplot for the sampling
distribution of the sample mean for samples of size 2.
Find the probability, expressed as a percent, that the sample mean will be within 1 point of the
population mean.
60)
A)
10%
B)
22%
C)
5%
D)
20%
Find the indicated probability or percentage for the sampling error.
61)
The distribution of weekly salaries at a large company is reverse J–shaped with a mean of $1000
and a standard deviation of $370. What is the probability that the sampling error made in
estimating the mean weekly salary for all employees of the company by the mean of a random
sample of weekly salaries of 80 employees will be at most $75?
61)
A)
0.4649
B)
0.9298
C)
0.0702
D)
Cannot be determined, because the distribution of the population is not normal.
62)
The monthly expenditures on food by single adults in one city are normally distributed with a
mean of $410 and a standard deviation of $70. What is the probability that the sampling error made
in estimating the mean monthly expenditure of all single adults in that city by the mean of a
random sample of 90 such adults will be at most $10?
62)
A)
0.9131
B)
0.8262
C)
0.9990
D)
0.1114
63)
The monthly expenditures on food by single adults living in one neighborhood of Los Angeles are
normally distributed with a mean of $410 and a standard deviation of $105. Determine the
percentage of samples of size 9 that will have mean monthly expenditures on food within $28 of
the population mean expenditure of $410.
63)
A)
91.92%
B)
57.62%
C)
21.28%
D)
98.36%
B
64)
The amount of coffee that a filling machine puts into an 8–ounce jar is normally distributed with a
mean of 8.2 ounces and a standard deviation of 0.18 ounce. What is the probability that the
sampling error made in estimating the mean amount of coffee for all 8–ounce jars by the mean of a
random sample of 100 jars will be at most 0.02 ounce?
64)
A)
0.0938
B)
0.8665
C)
0.7330
D)
0.0876
C
Provide an appropriate response.
65)
The mean height for a population is 65 inches and the standard deviation is 3 inches. Let A and B
denote the events described below.
Event A: The mean height in a random sample of 16 people is within 1 inch of the population
mean.
Event B: The mean height in a random sample of 50 people is within 1 inch of the population
mean.
True or false, the probability of event A is greater than the probability of event B?
65)
A)
True
B)
False
B
B
Identify the distribution of the sample mean. In particular, state whether the distribution of x is normal or approximately
normal and give its mean and standard deviation.
66)
The heights of people in a certain population are normally distributed with a mean of 67 inches and
a standard deviation of 3.1 inches. Determine the sampling distribution of the mean for samples of
size 35.
66)
A)
Approximately normal, mean =67 inches, standard deviation =0.09 inches
B)
Normal, mean =67 inches, standard deviation =0.52 inches
C)
Normal, mean =67 inches, standard deviation =0.09 inches
D)
Normal, mean =67 inches, standard deviation =3.1 inches
Find the requested probability.
67)
The table reports the distribution of pocket money, in bills, of the 6 students in a statistics seminar.
Student Hannah Ming Keshaun Tameeka Jose Vaishali
Amount, in dollars 2 4 4 5 5 7
For a random sample of size two, find the probability, expressed as a percent rounded to the
nearest tenth, that the sample mean will be within $1 of the population mean.
67)
A)
78.6%
B)
66.7%
C)
73.3%
D)
80.0%
Identify the distribution of the sample mean. In particular, state whether the distribution of x is normal or approximately
normal and give its mean and standard deviation.
68)
For the population of one town, the number of siblings, x, is a random variable whose relative
frequency histogram has a reverse J–shape. The mean number of siblings is 1.3 and the standard
deviation is 1.5. Let x denote the mean number of siblings for a random sample of size 31.
Determine the sampling distribution of the mean for samples of size 31.
68)
A)
Approximately normal, mean =1.3, standard deviation =0.27
B)
Approximately normal, mean =1.3, standard deviation =1.5
C)
Normal, mean =1.3, standard deviation =0.27
D)
Normal, mean =1.3, standard deviation =1.5
Provide an appropriate response.
69)
What generally happens to the sampling distribution of the sample mean as the sample size is
increased?
69)
A)
It is unaffected.
B)
It becomes more tightly concentrated around the population mean.
C)
It becomes less tightly concentrated around the population mean.
D)
None of the above
70)
The mean height for a population is 65 inches. Let x denote the mean height for a sample of people
picked randomly from the population. True or false, the standard deviation of x for samples of size
30 is smaller than the standard deviation, , of the population?
70)
A)
True
B)
False
71)
The mean height for a population is 65 inches and the standard deviation is 3 inches. Let x denote
the mean height for a sample of people picked randomly from the population. True or false, the
standard deviation of x for samples of size 30 is greater than the standard deviation of x for
samples of size 20?
71)
A)
True
B)
False
Find the indicated probability or percentage for the sampling error.
72)
Scores on a biology final exam are normally distributed with a mean of 220 and a standard
deviation of 24. Determine the percentage of samples of size 9 that will have mean scores within 12
points of the population mean score of 220.
72)
A)
38.30%
B)
86.64%
C)
93.32%
D)
13.36%
28
Provide an appropriate response.
73)
What is the sampling distribution of a statistic?
73)
A)
The distribution of observations of a variable in a sample for a given value of the statistic
B)
The distribution of all possible sizes of samples from a population that can be used to make
observations of the statistic
C)
The distribution of observations of the statistic for all possible sizes of samples from a
population
D)
The distribution of all possible observations of the statistic for samples of a given size from a
population
Find the requested probability.
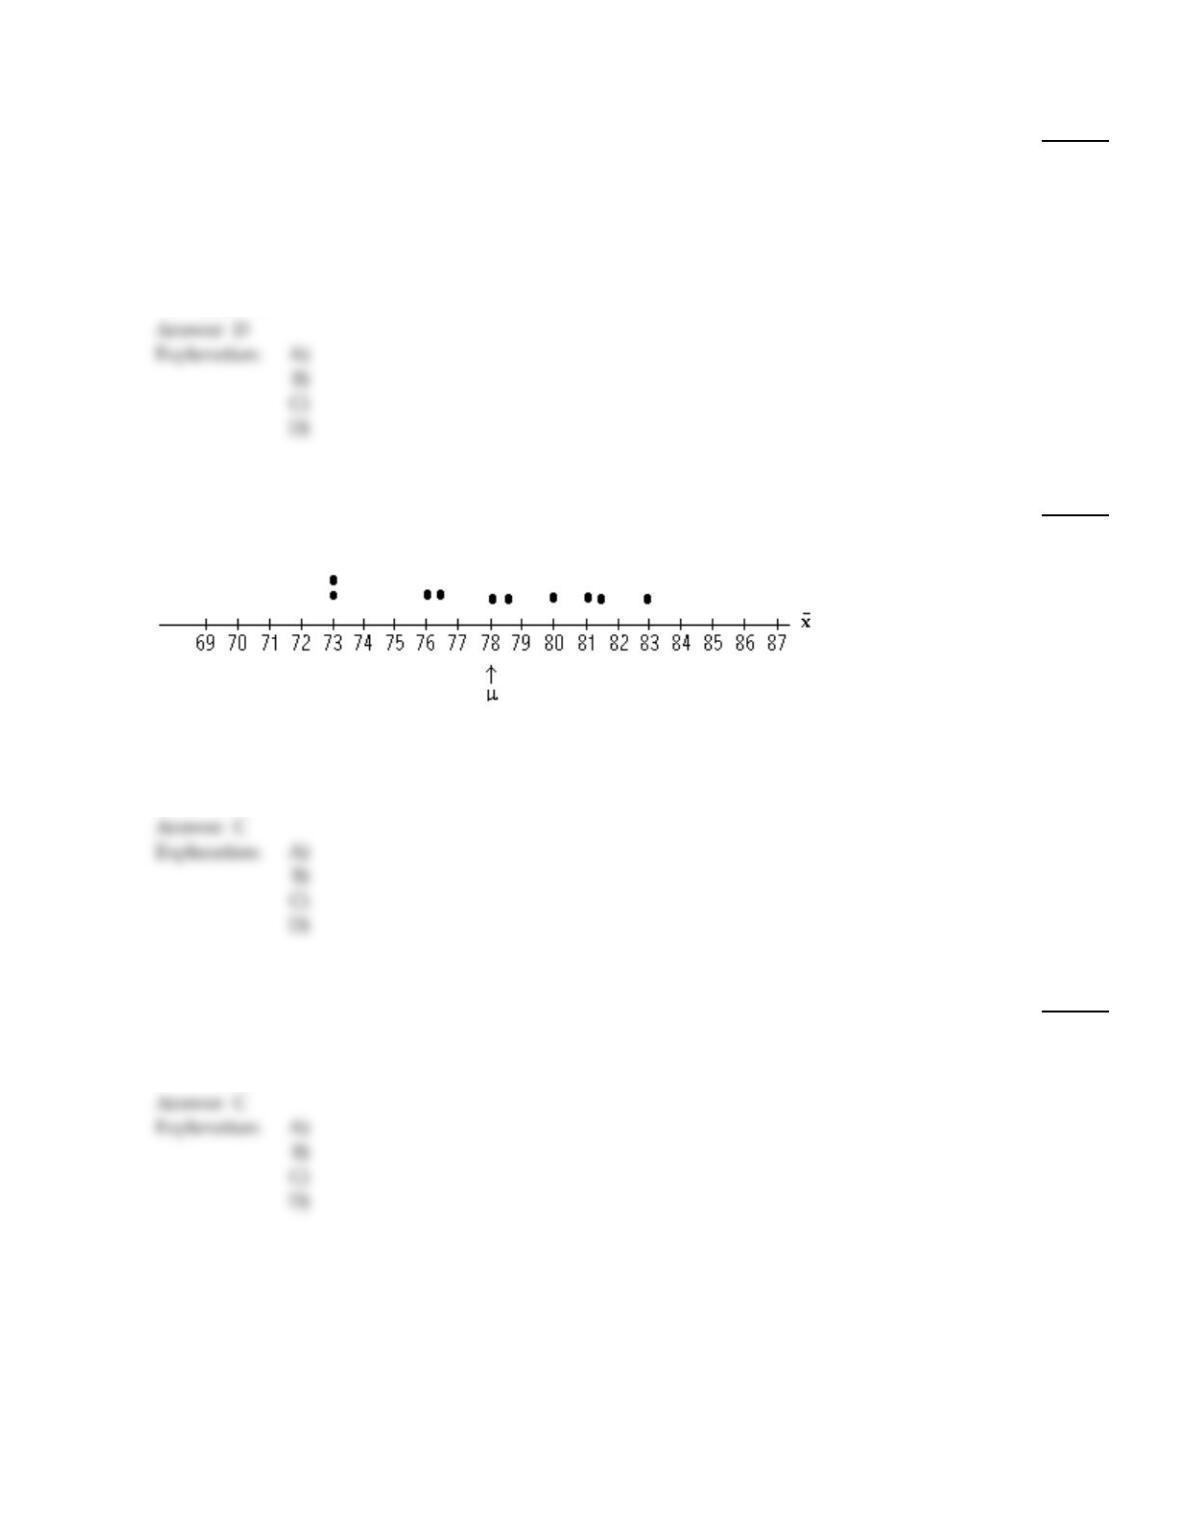
74)
The test scores of 5 students are under consideration. The following is the dotplot for the sampling
distribution of the sample mean for samples of size 2.
Find the probability, expressed as a percent, that the sample mean will be within 5 points of the
population mean.
74)
A)
95%
B)
90%
C)
100%
D)
80%
Find the indicated probability or percentage for the sampling error.
75)
Scores on a chemistry final exam are normally distributed with a mean of 280 and a standard
deviation of 50. Determine the percentage of samples of size 4 that will have mean scores within 35
points of the population mean score of 280.
75)
A)
51.60%
B)
91.92%
C)
83.84%
D)
99.48%
29
Find the requested probability.
76)
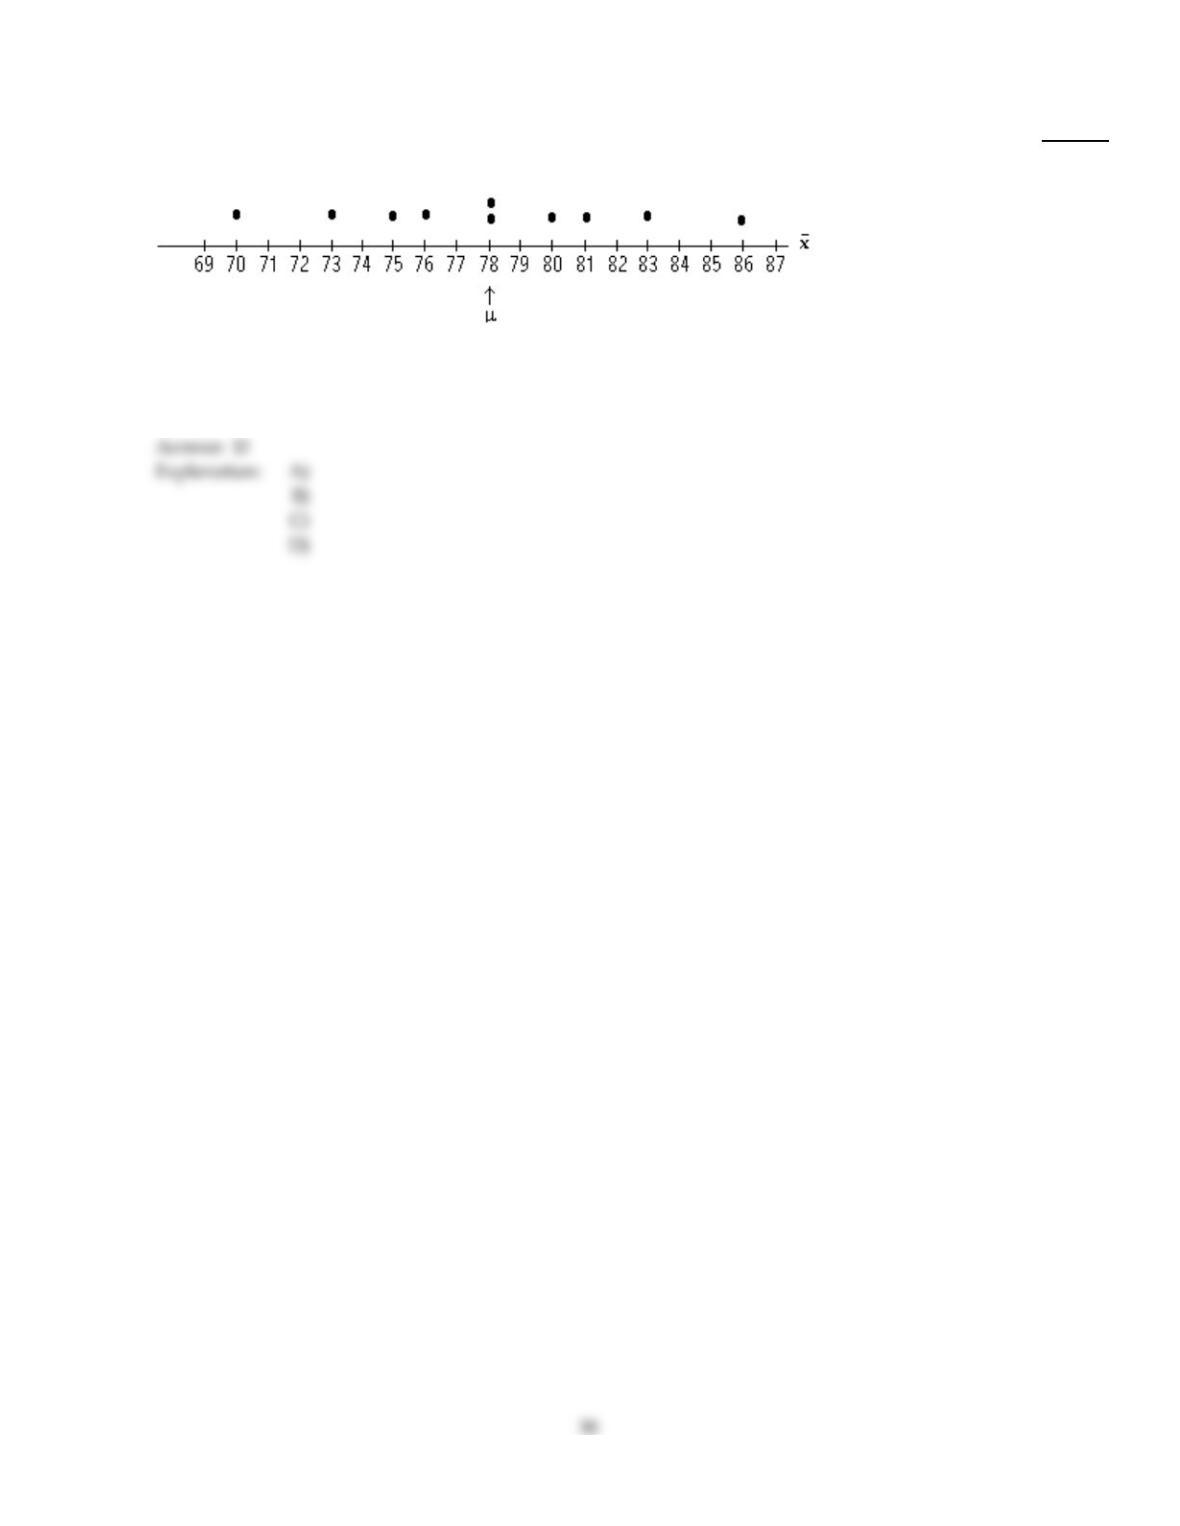
The test scores of 5 students are under consideration. The following is the dotplot for the sampling
distribution of the sample mean for samples of size 2.
Find the probability, expressed as a percent, that the sample mean will be within 3 points of the
population mean.
76)
A)
50%
B)
40%
C)
70%
D)
60%
Answer Key
Testname: C7
Answer Key
Testname: C7
32
Answer Key
Testname: C7
33
Answer Key
Testname: C7
34
Answer Key
Testname: C7
Answer Key
Testname: C7