Larson_Calculus_10e ch07sec01
MULTIPLE CHOICE
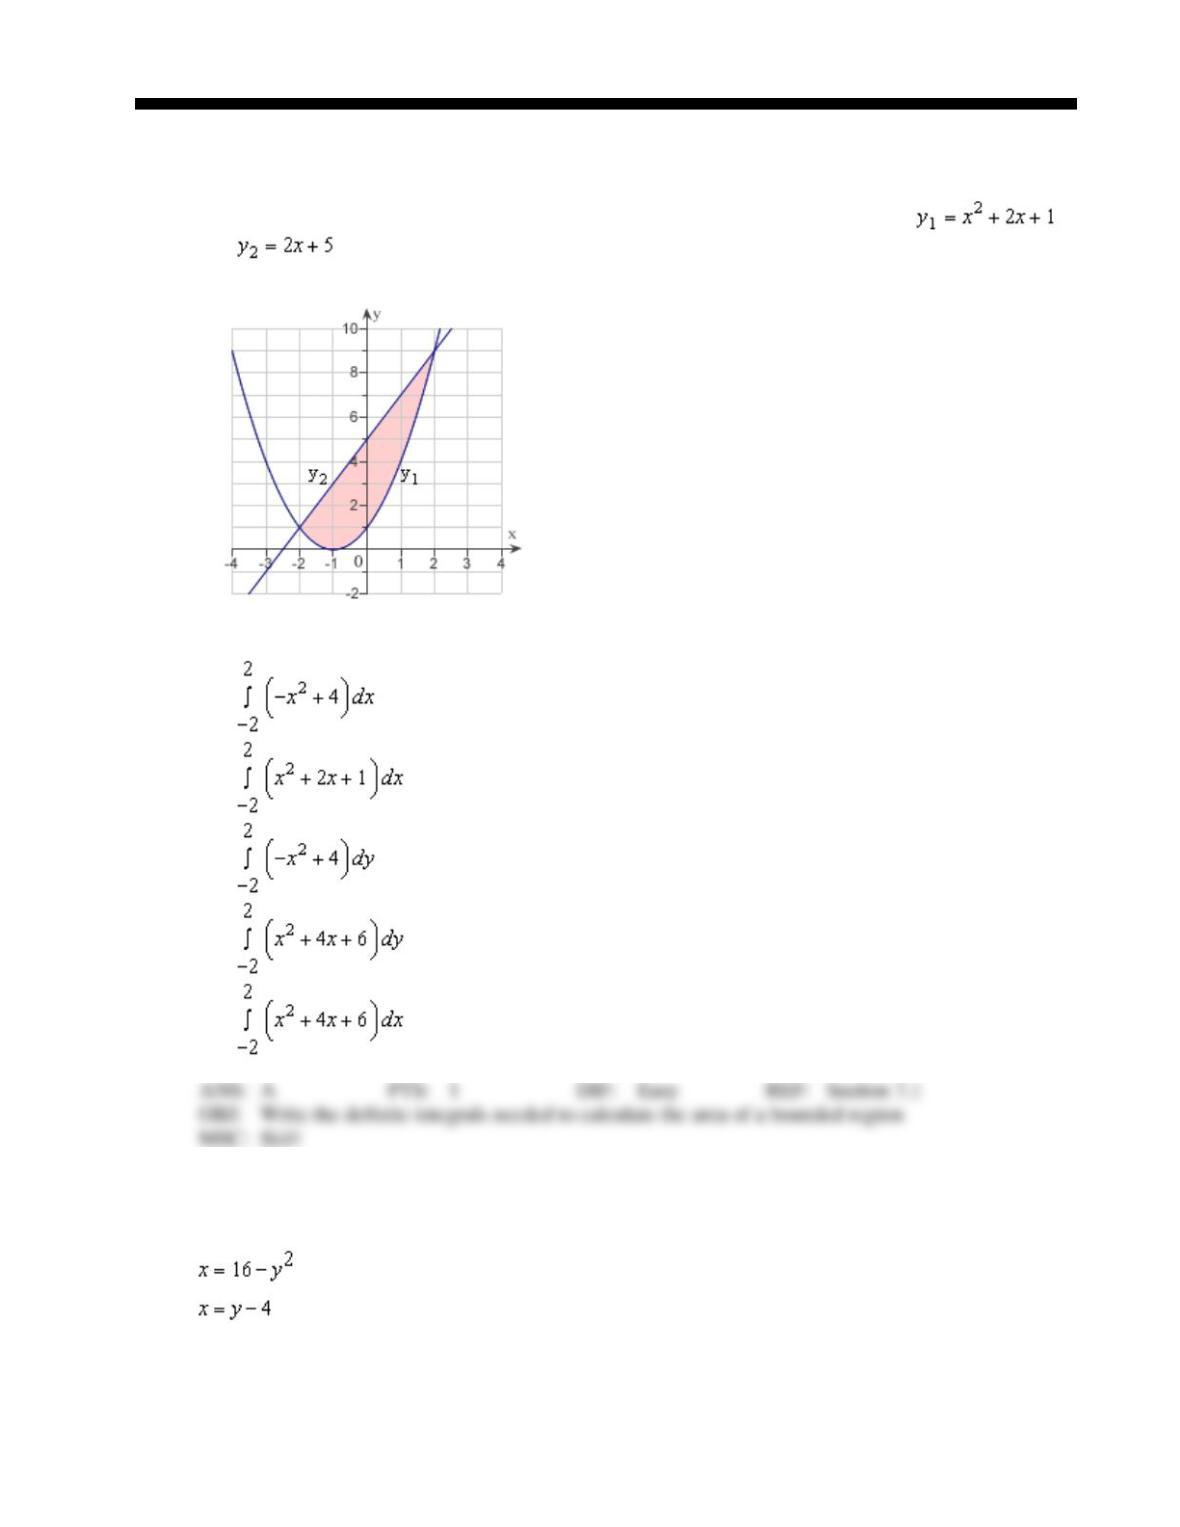
1. Set up the definite integral that gives the area of the region bounded by the graph of
and .
a.
b.
c.
d.
e.
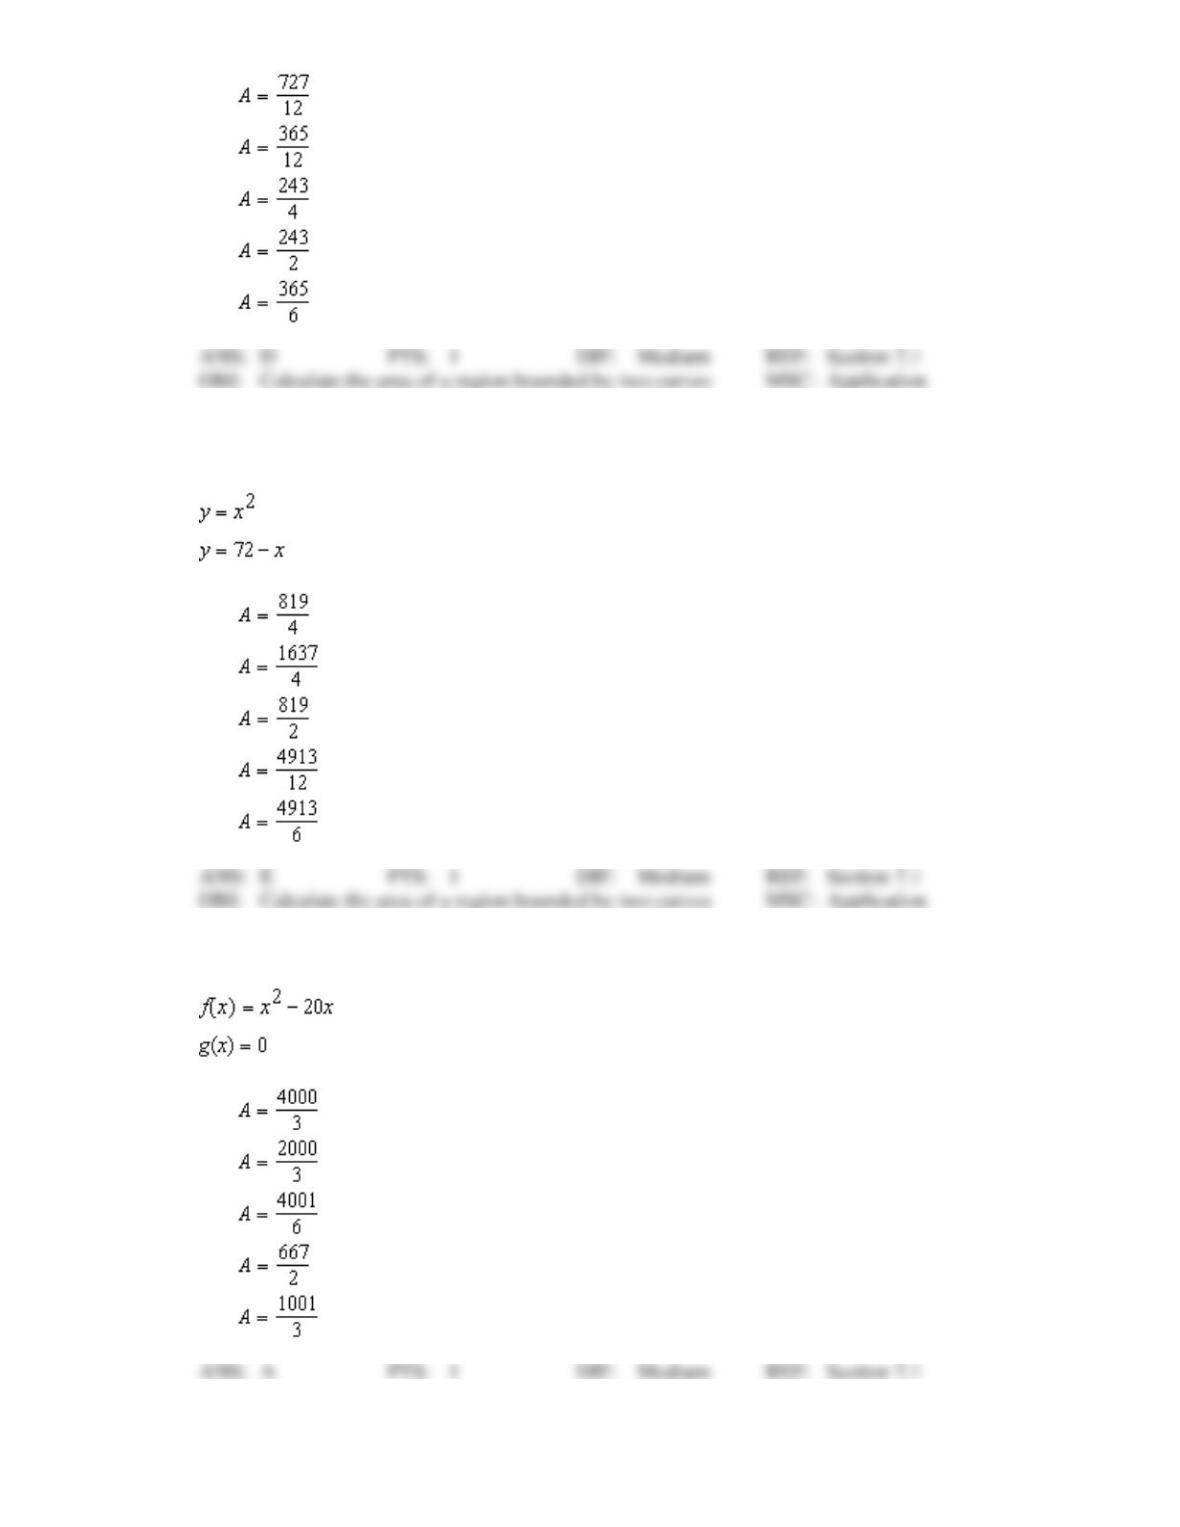
2. Find the area of the region bounded by the equations by integrating (i) with respect to x and
(ii) with respect to y.
a.
b.
c.
d.
e.
3. Find the area of the region bounded by equations by integrating (i) with respect to x and
(ii) with respect to y.
a.
b.
c.
d.
e.
4. Find the area of the region bounded by the graphs of the algebraic functions.
a.
b.
c.
d.
e.
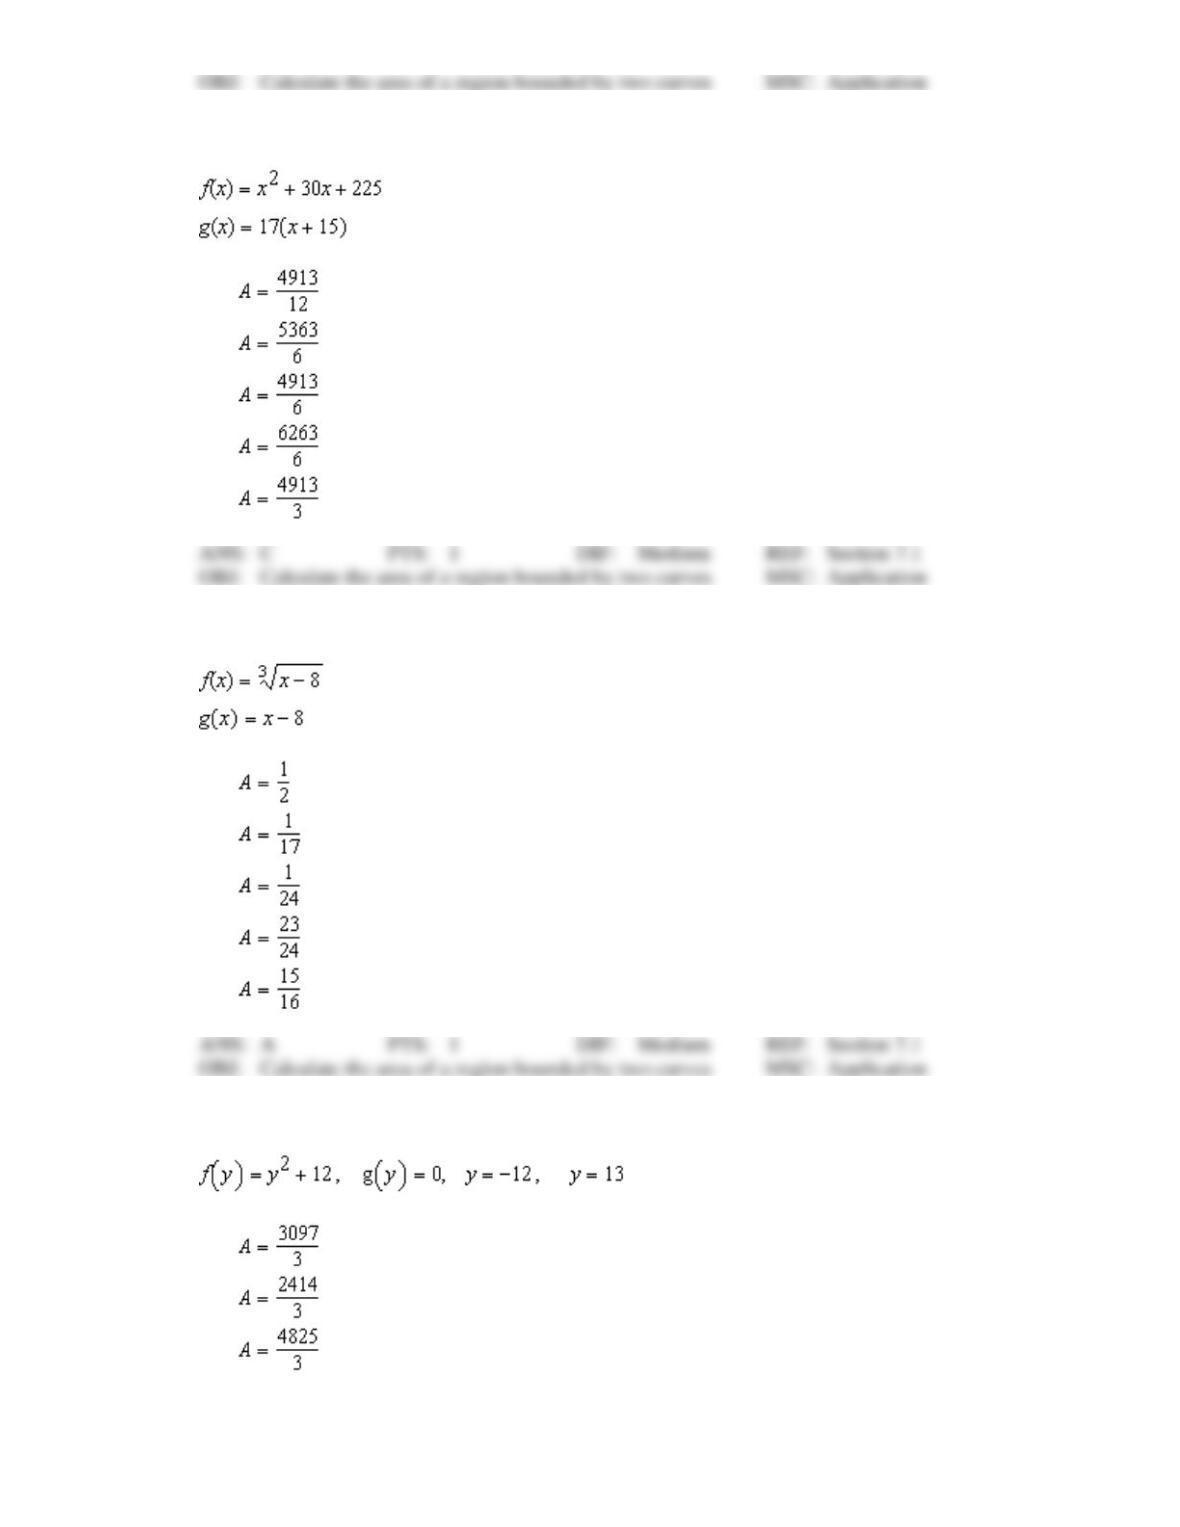
5. Find the area of the region bounded by the graphs of the algebraic functions.
a.
b.
c.
d.
e.
6. Find the area of the region bounded by the graphs of the algebraic functions.
a.
b.
c.
d.
e.
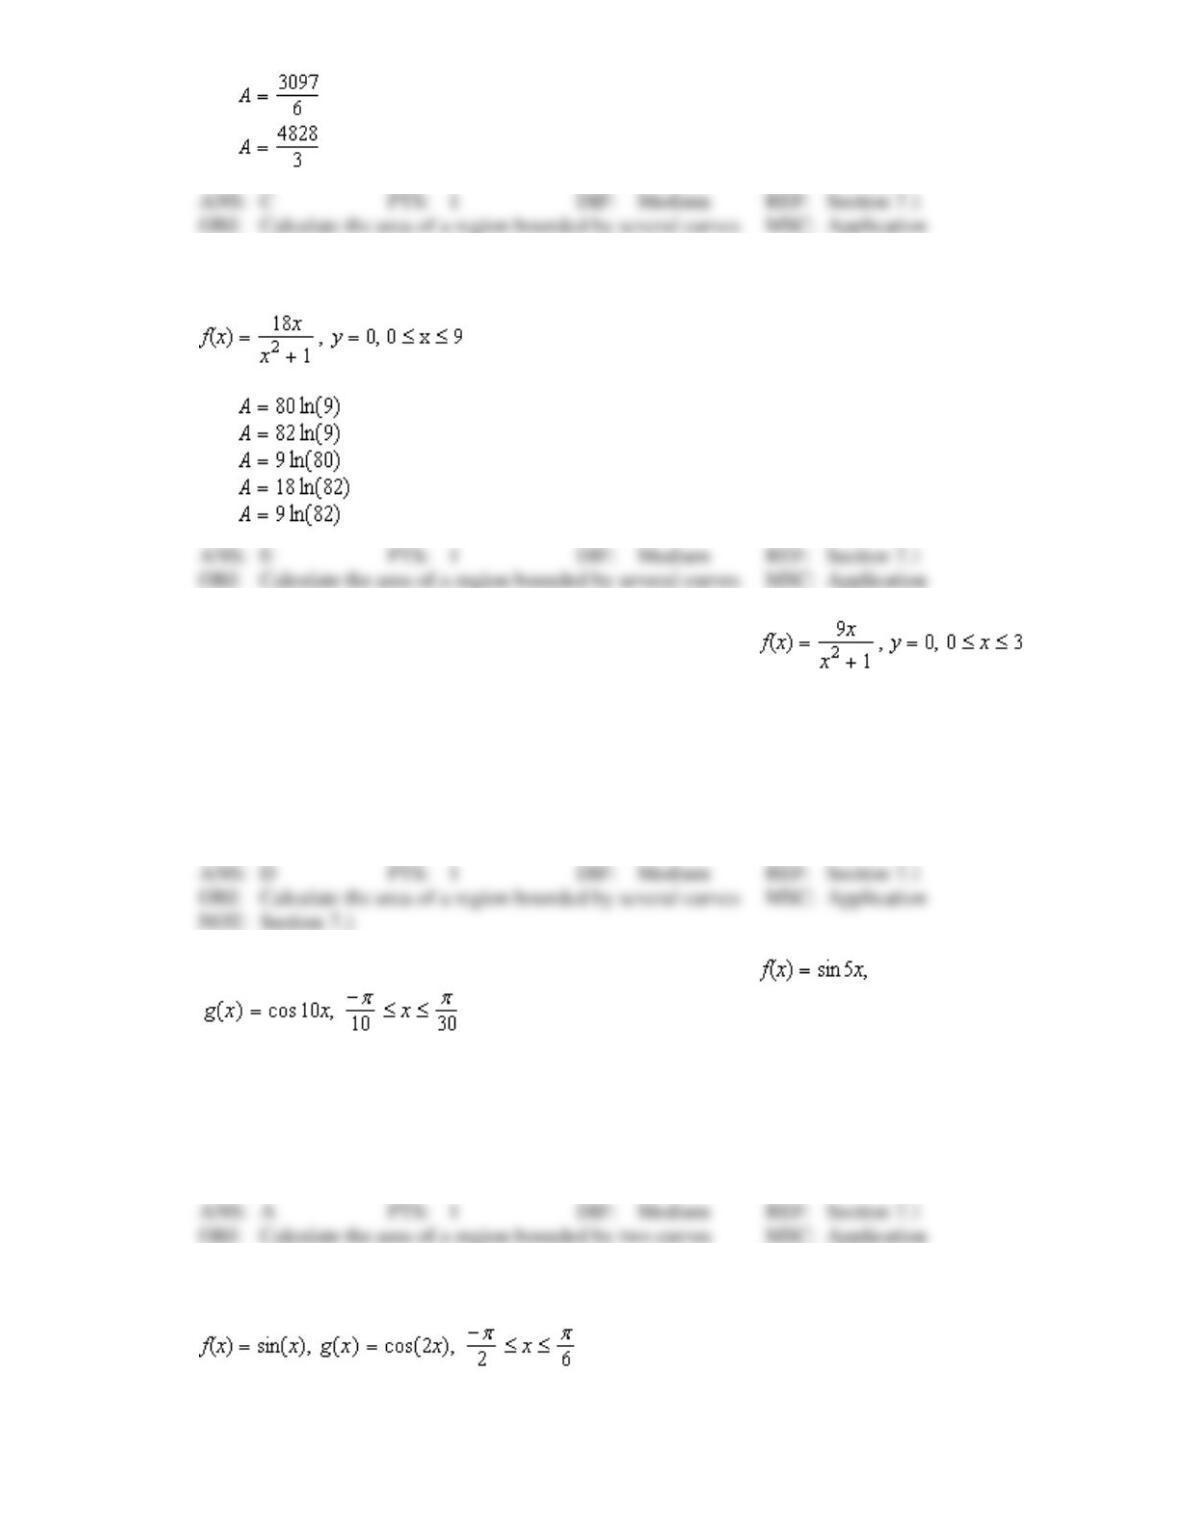
7. Find the area of the region bounded by the graphs of the algebraic functions.
a.
b.
c.
d.
e.
8. Find the area of the region bounded by the graphs of the equations.
a.
b.
c.
d.
e.
9. Find the area of the region bounded by the graphs of the function .
Round your answer to three decimal places.
a.
20.723
b.
11.182
c.
6.238
d.
10.362
e.
22.364
10. Find the area of the region bounded by the graphs of the function
. Round your answer to three decimal places.
a.
0.260
b.
0.289
c.
0.416
d.
0.139
e.
0.462
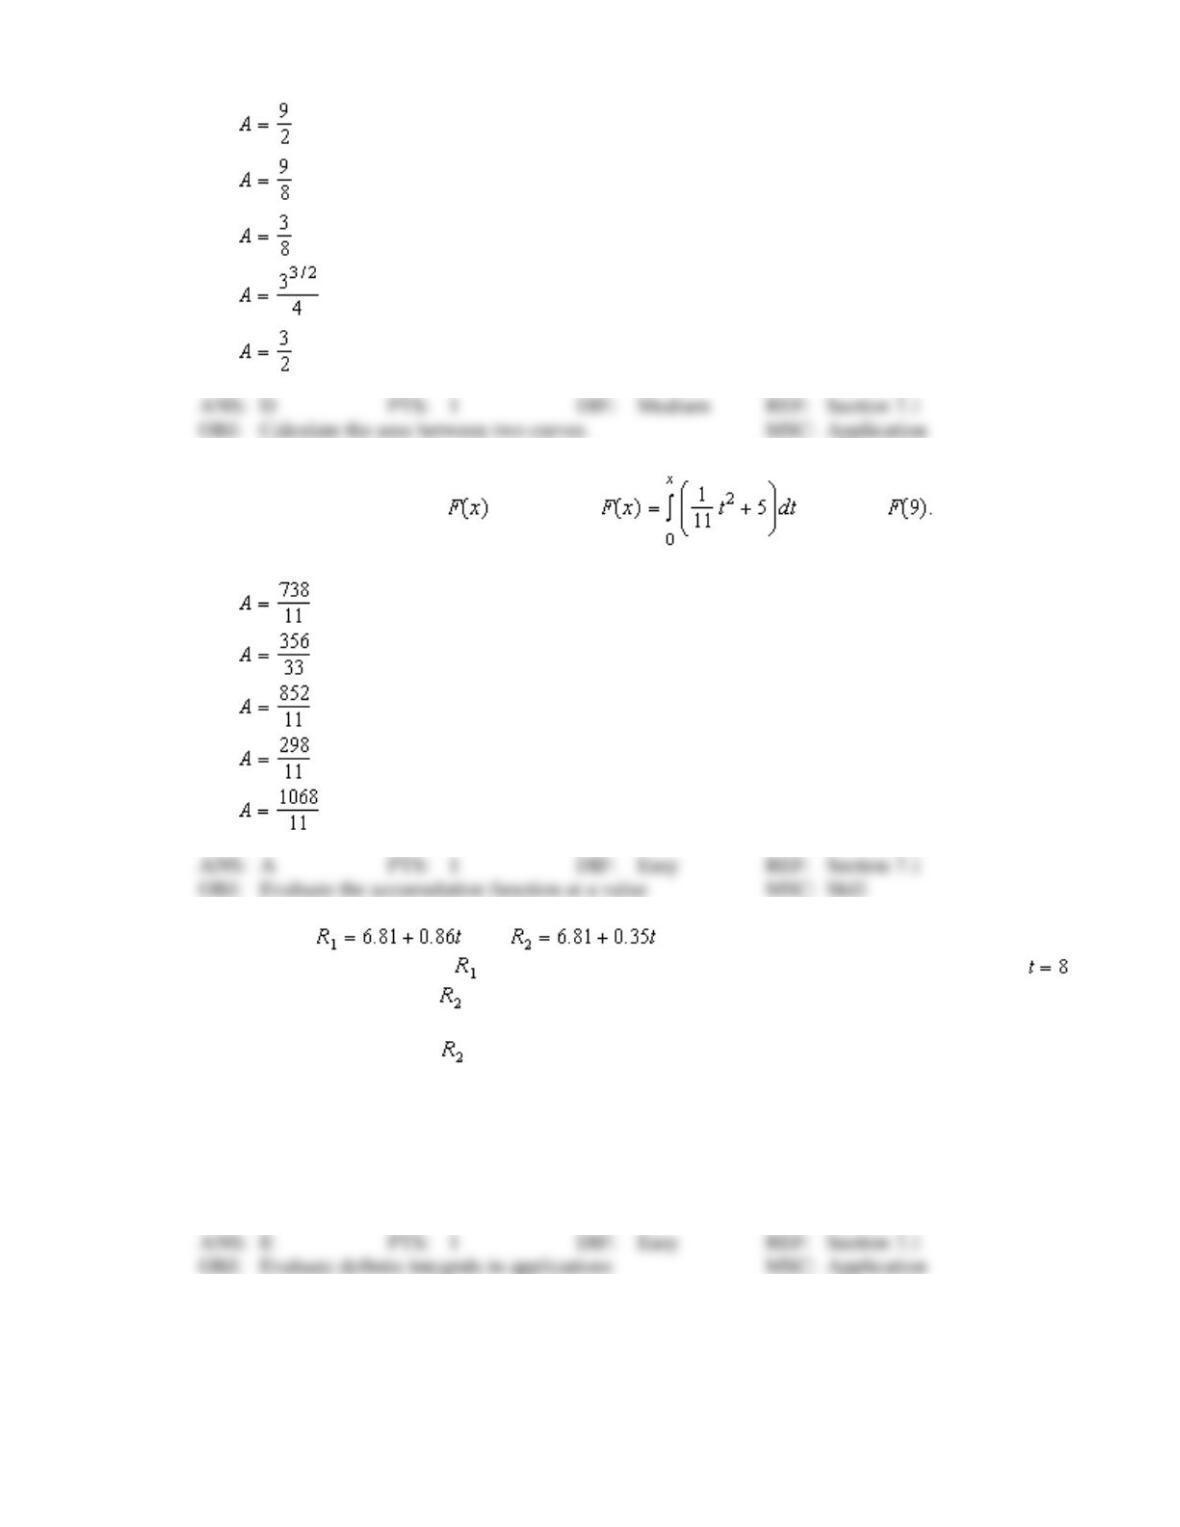
11. Find the area of the region bounded by the graphs of the equations.
.
a.
b.
c.
d.
e.
12. If the accumulation function is given by , evaluate
a.
b.
c.
d.
e.
13. Suppose that and model the revenue (in billions of dollars) for a
large corporation. The model gives projected annual revenues from 2008 through 2015, with
corresponding to 2008, and gives projected revenues if there is a decrease in the rate of growth of
corporate sales over the period. Approximate the total reduction in revenue if corporate sales are
actually closer to the model . Round your answer to three decimal places.
a.
$3.570 billion
b.
$24.990 billion
c.
$19.763 billion
d.
$29.645 billion
e.
$12.495 billion
14. The chief financial officer of a company reports that profits for the past fiscal year were $ million.
The officer predicts that profits for the next 7 years will grow at a continuous annual rate somewhere
between % and 6%. Estimate the cumulative difference in total profit over the 7 years based on the
predicted range of growth rates. Round your answer to three decimal places.
a.
$445.736 billion
b.
$30.221 billion
c.
$7.023 billion
d.
$18.710 billion
e.
$57.880 billion
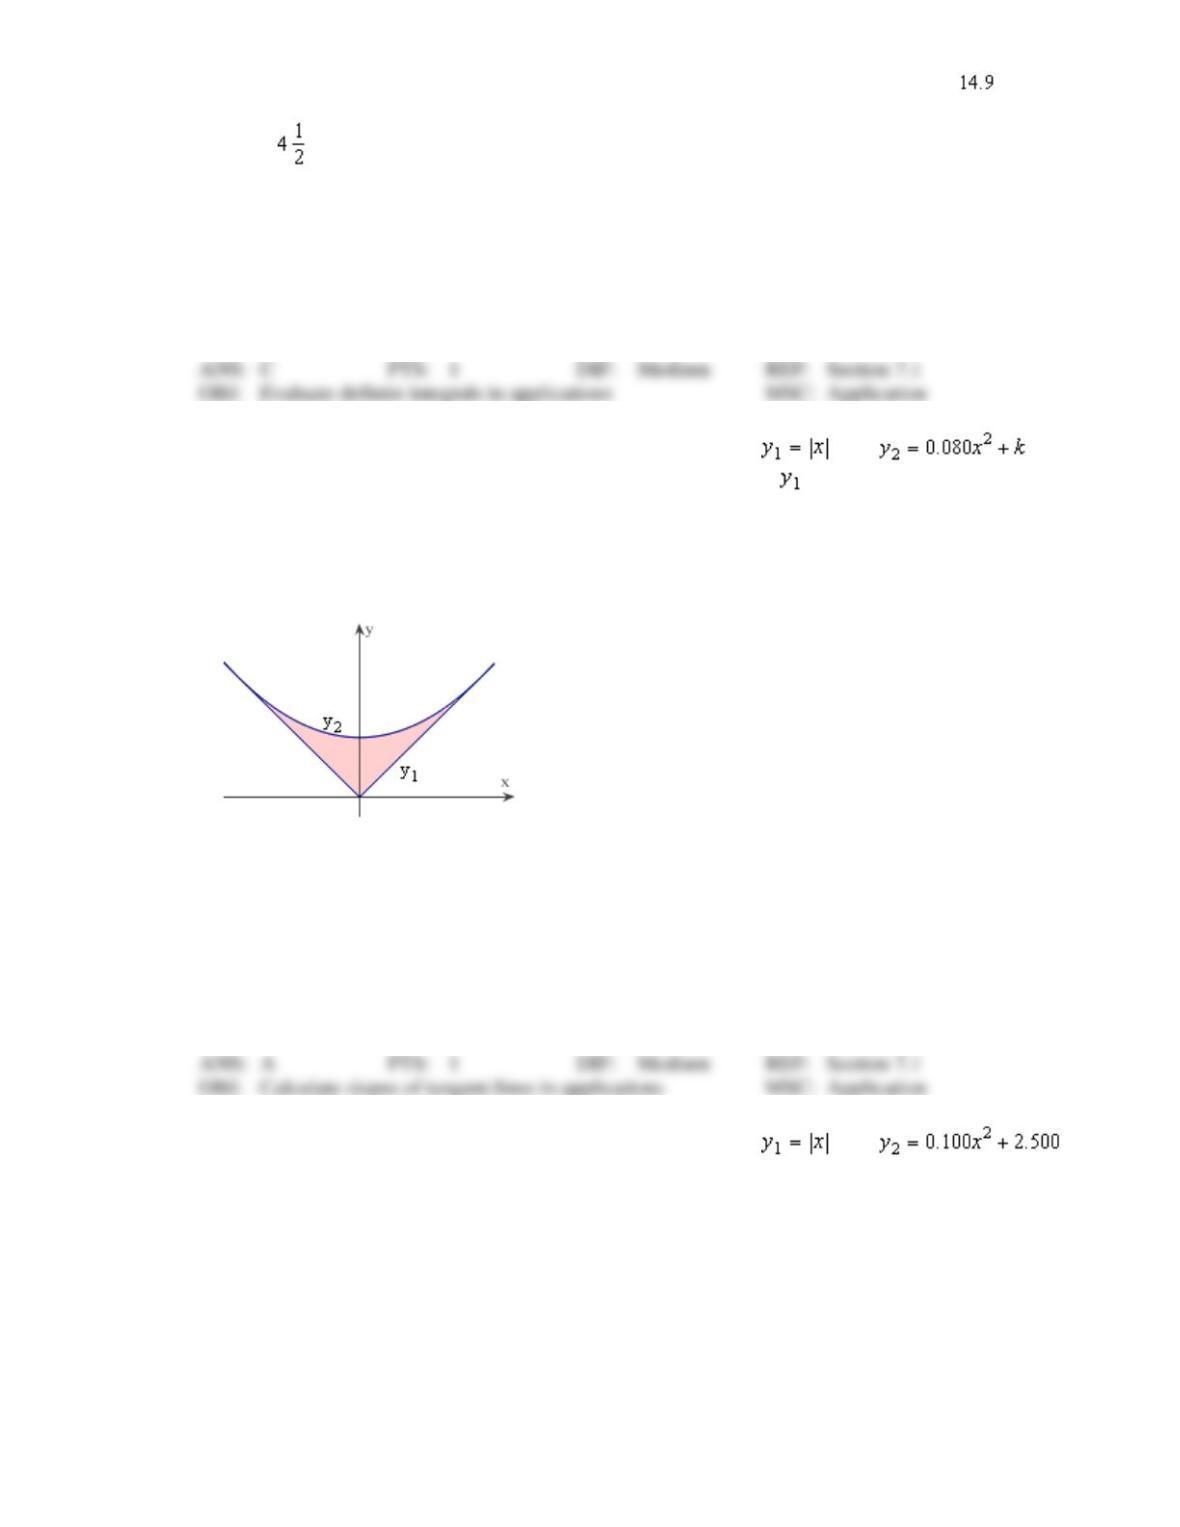
15. The surface of a machine part is the region between the graphs of and as
shown in the figure. Find k if the parabola is tangent to the graph of . Round your answer to three
decimal places.
a.
3.125
b.
0.160
c.
0.080
d.
0.320
e.
6.250
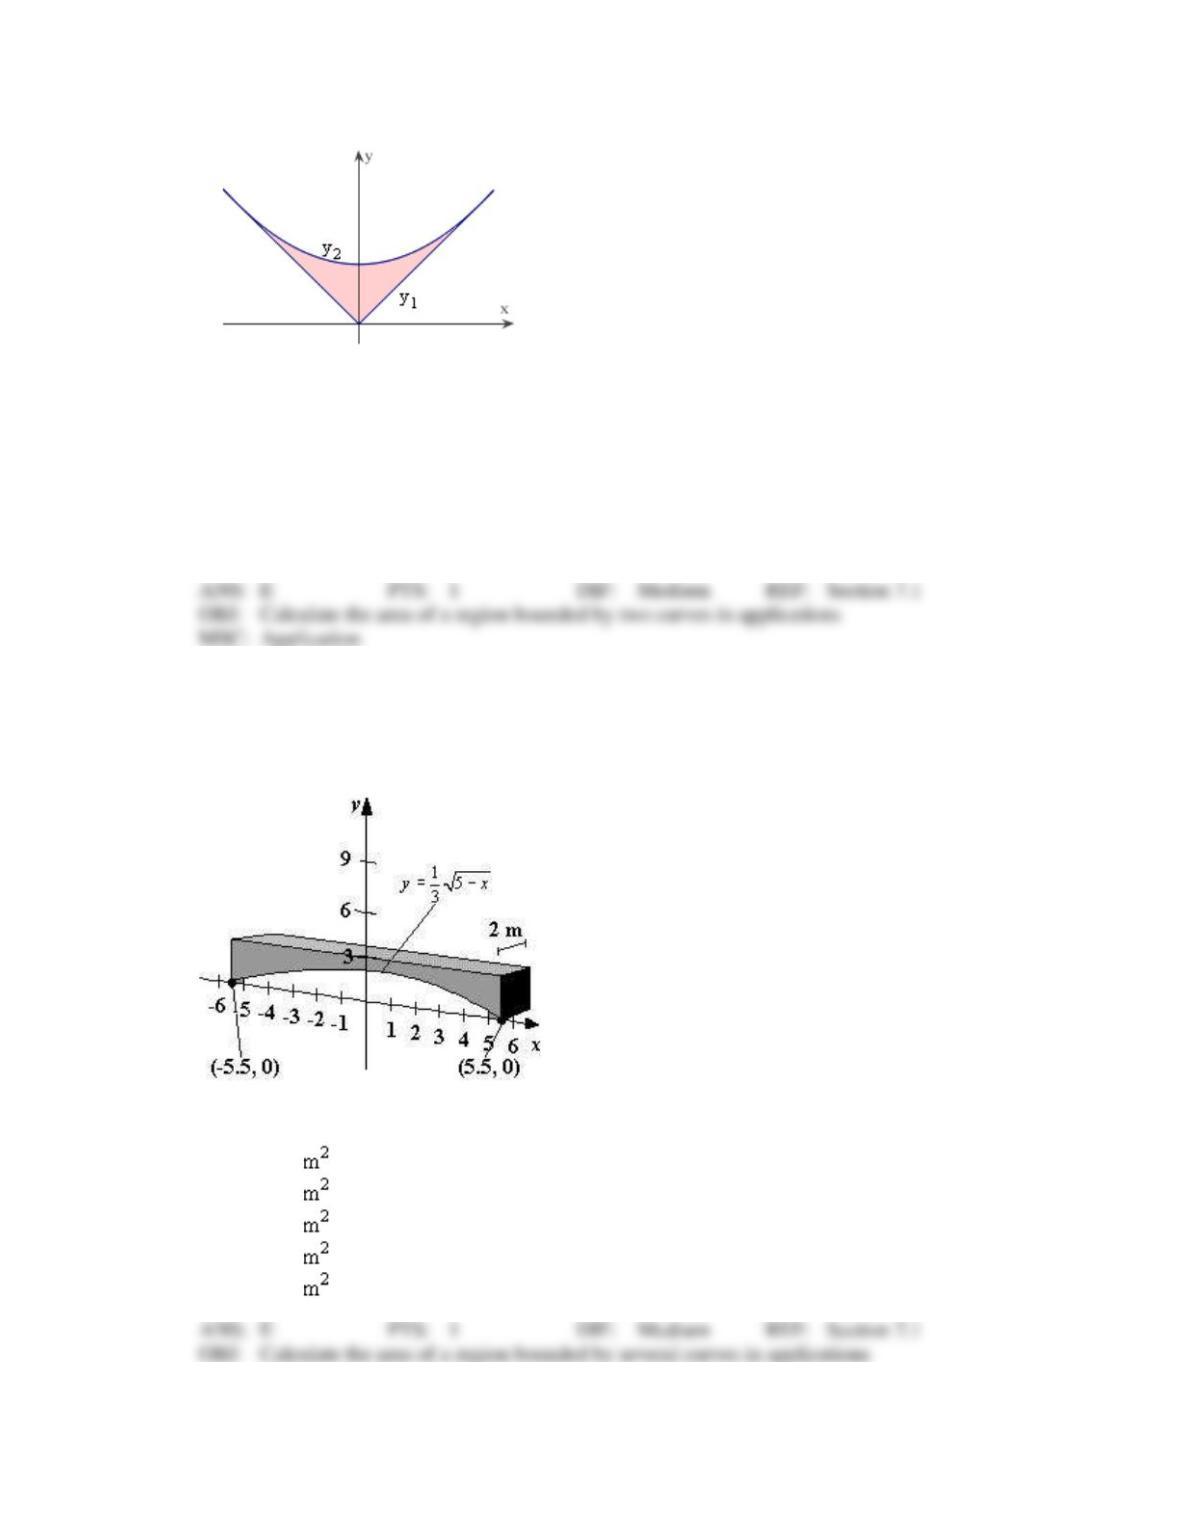
16. The surface of a machine part is the region between the graphs of and
as shown in the figure. Find the area of the surface of the machine part. Round your answer to five
decimal places.
a.
1.66667
b.
0.41667
c.
0.01333
d.
33.33333
e.
8.33333
17. Concrete sections for the new building have the dimensions (in meters) and shape as shown in the
figure (the picture is not necessarily drawn to scale). Find the area of the face of the section
superimposed on the rectangular coordinate system. Round your answer to three decimal places.
a.
25.031
b.
31.075
c.
29.151
d.
30.515
e.
28.031
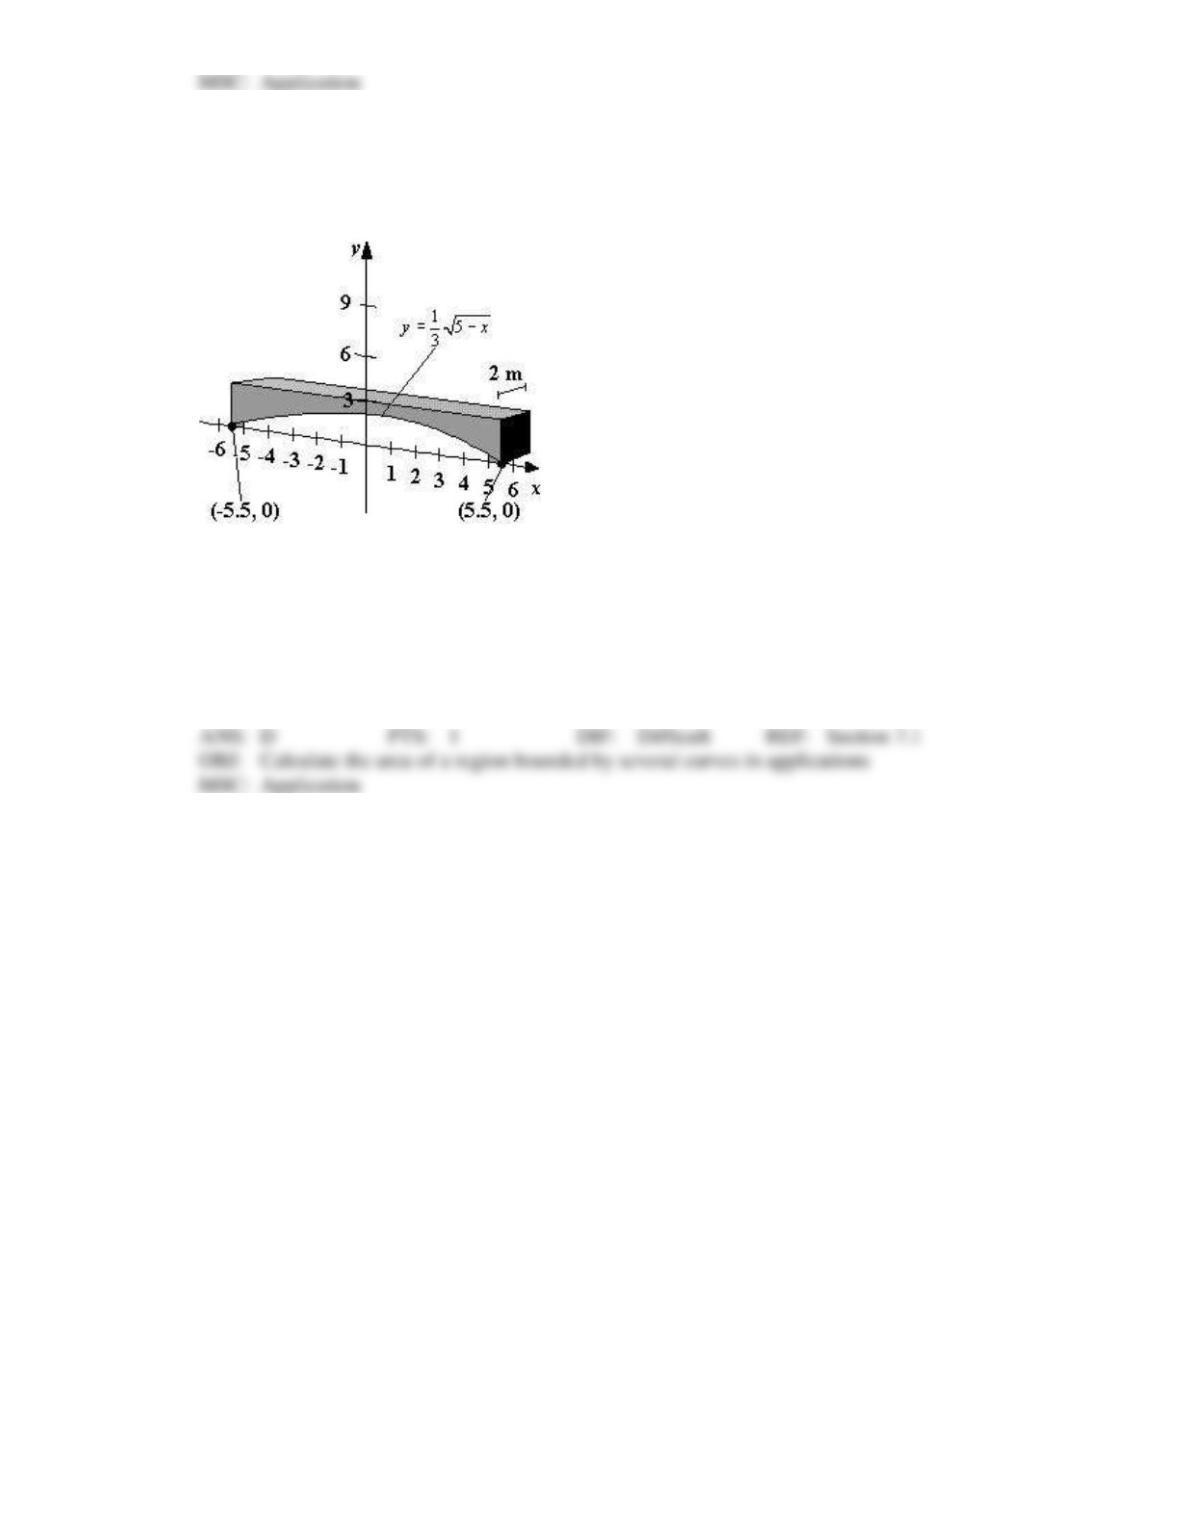
18. Concrete sections for the new building have the dimensions (in meters) and shape as shown in the
figure (the picture is not necessarily drawn to scale). One cubic meter of concrete weighs 4320 pounds.
Find the weight of the section. Round your answer to the nearest pound.
a.
268,492 pounds
b.
263,654 pounds
c.
216,267 pounds
d.
242,187 pounds
e.
251,865 pounds