Consumers, Producers, and the Efficiency of Markets 1893
51.
Refer to Figure 7-21. When the price is P1, area A represents
a.
total benefit.
b.
producer surplus.
c.
consumer surplus.
d.
None of the above is correct.
52.
Refer to Figure 7-21. When the price is P1, area B+C represents
a.
total surplus.
b.
producer surplus.
c.
consumer surplus.
d.
None of the above is correct.
53.
Refer to Figure 7-21. Which area represents total surplus in the market when the price is P1?
a.
A+B
b.
B+C
c.
C+D
d.
A+B+C+D
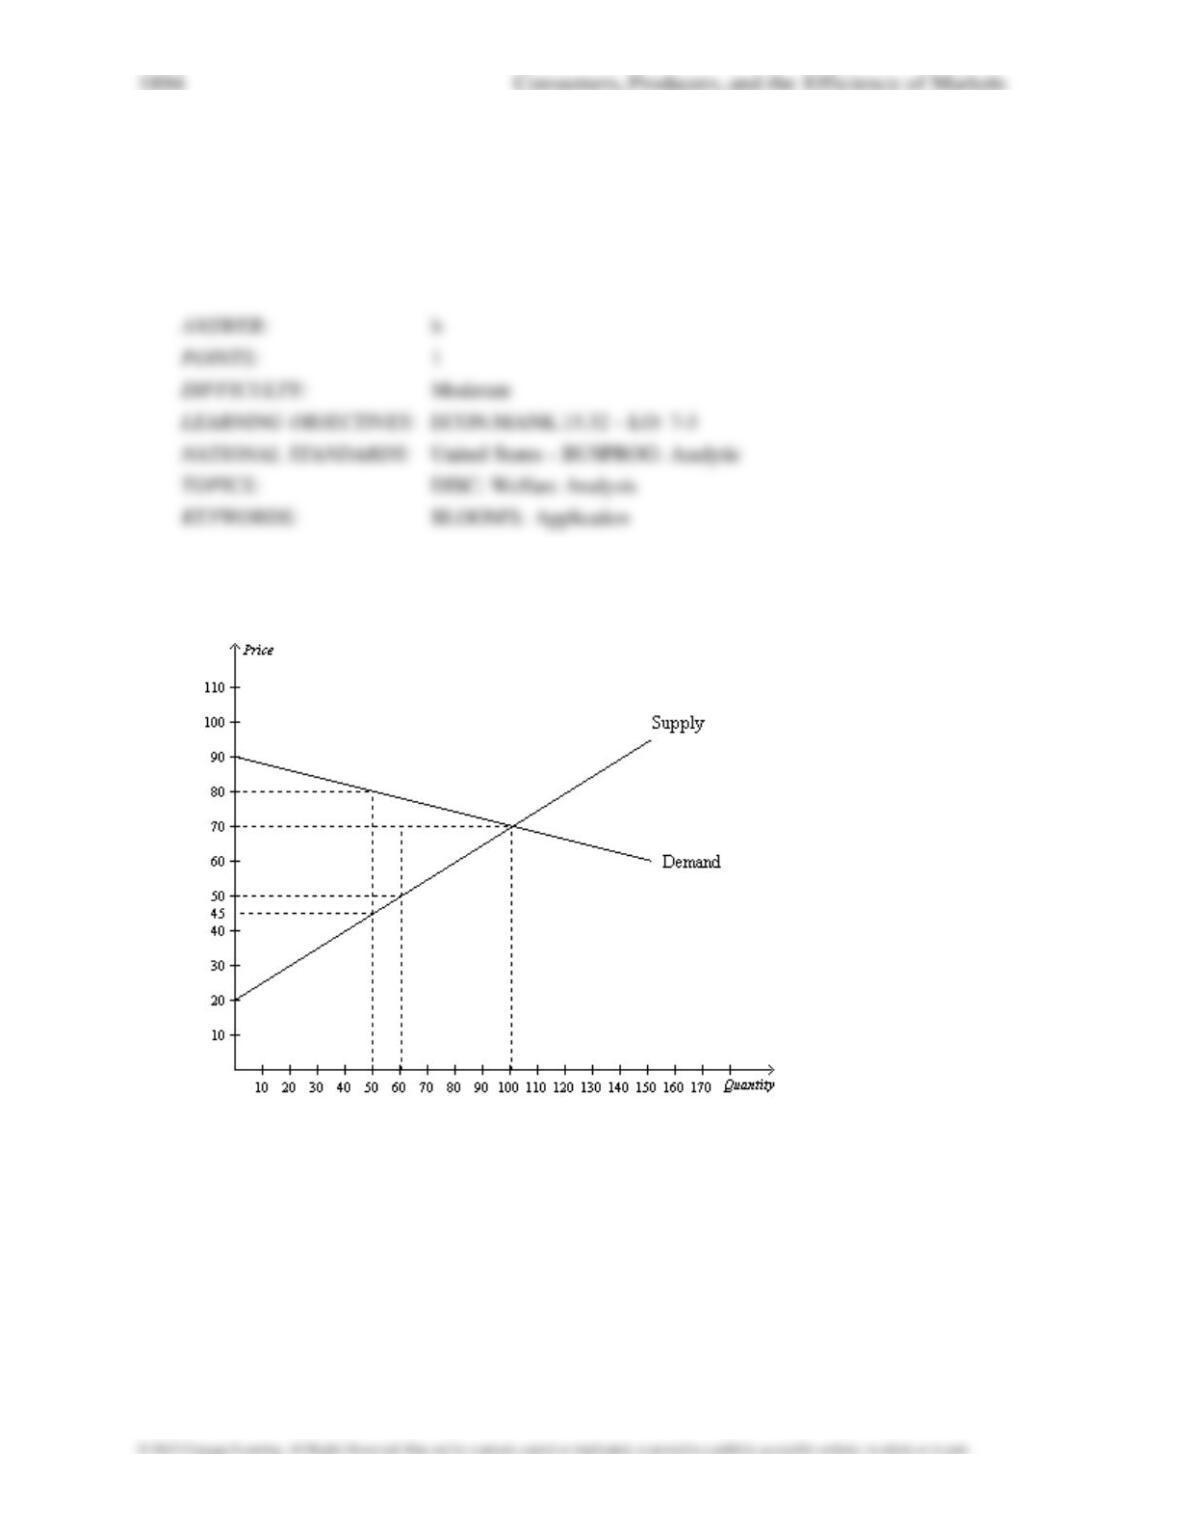
Figure 7-22

54.
Refer to Figure 7-22. At the equilibrium price, consumer surplus is
a. $1,000.
b. $2,000.
c. $3,500.
d. $500.
55.
Refer to Figure 7-22. If the price decreases from $80 to $70 due to a shift in the supply curve,
consumer surplus
increases by
a. $250.
b. $750.
c. $1000.
d. $500.
56.
Refer to Figure 7-22. At the equilibrium price, producer surplus is
a. $5,000.
b. $2,500.
c. $3,500.
d. $1,750.
57.
Refer to Figure 7-22. At the equilibrium price, total surplus is
a. $2,500.
b. $1,000.
c. $3,500.
d. $7,000.
58.
Refer to Figure 7-22. Assume demand increases, which causes the equilibrium price to increase
from $50 to $70.
The increase in producer surplus due to new producers entering the market would be
a. $400.
b. $800.
c. $1,200.
d. $900.
59.
Refer to Figure 7-22. Assume demand increases, which causes the equilibrium price to increase
from $50 to $70.
The increase in producer surplus to producers already in the market would be
a. $1,600.
b. $600.
c. $800.
d. $1,200.
60.
Refer to Figure 7–22. Assume demand increases, which causes the equilibrium price to increase
from $50 to $70.
The increase in producer surplus would be
a. $2,500.
b. $900.
c. $800.
d. $1,600.
61.
Refer to Figure 7-22. The efficient price is
a.
$80, and the efficient quantity is 50.
b.
$70, and the efficient quantity is 60.
c.
$70, and the efficient quantity is 100.
d.
$50, and the efficient quantity is 60.
62.
Refer to Figure 7–22. If 110 units of the good are bought and sold, then
a.
the marginal cost to sellers is equal to the marginal value to buyers.
b.
the marginal value to buyers is greater than the marginal cost to sellers.
c.
the marginal cost to buyers is greater than marginal value to sellers.
d.
producer surplus is greater than consumer surplus.
63.
Refer to Figure 7-22. If 40 units of the good are bought and sold, then
a.
the marginal cost to sellers is equal to the marginal value to buyers.
b.
the marginal value to buyers is greater than the marginal cost to sellers.
c.
the marginal cost to sellers is greater than the marginal value to buyers.
d.
producer surplus would be greater than consumer surplus.
1900 Consumers, Producers, and the Efficiency of Markets
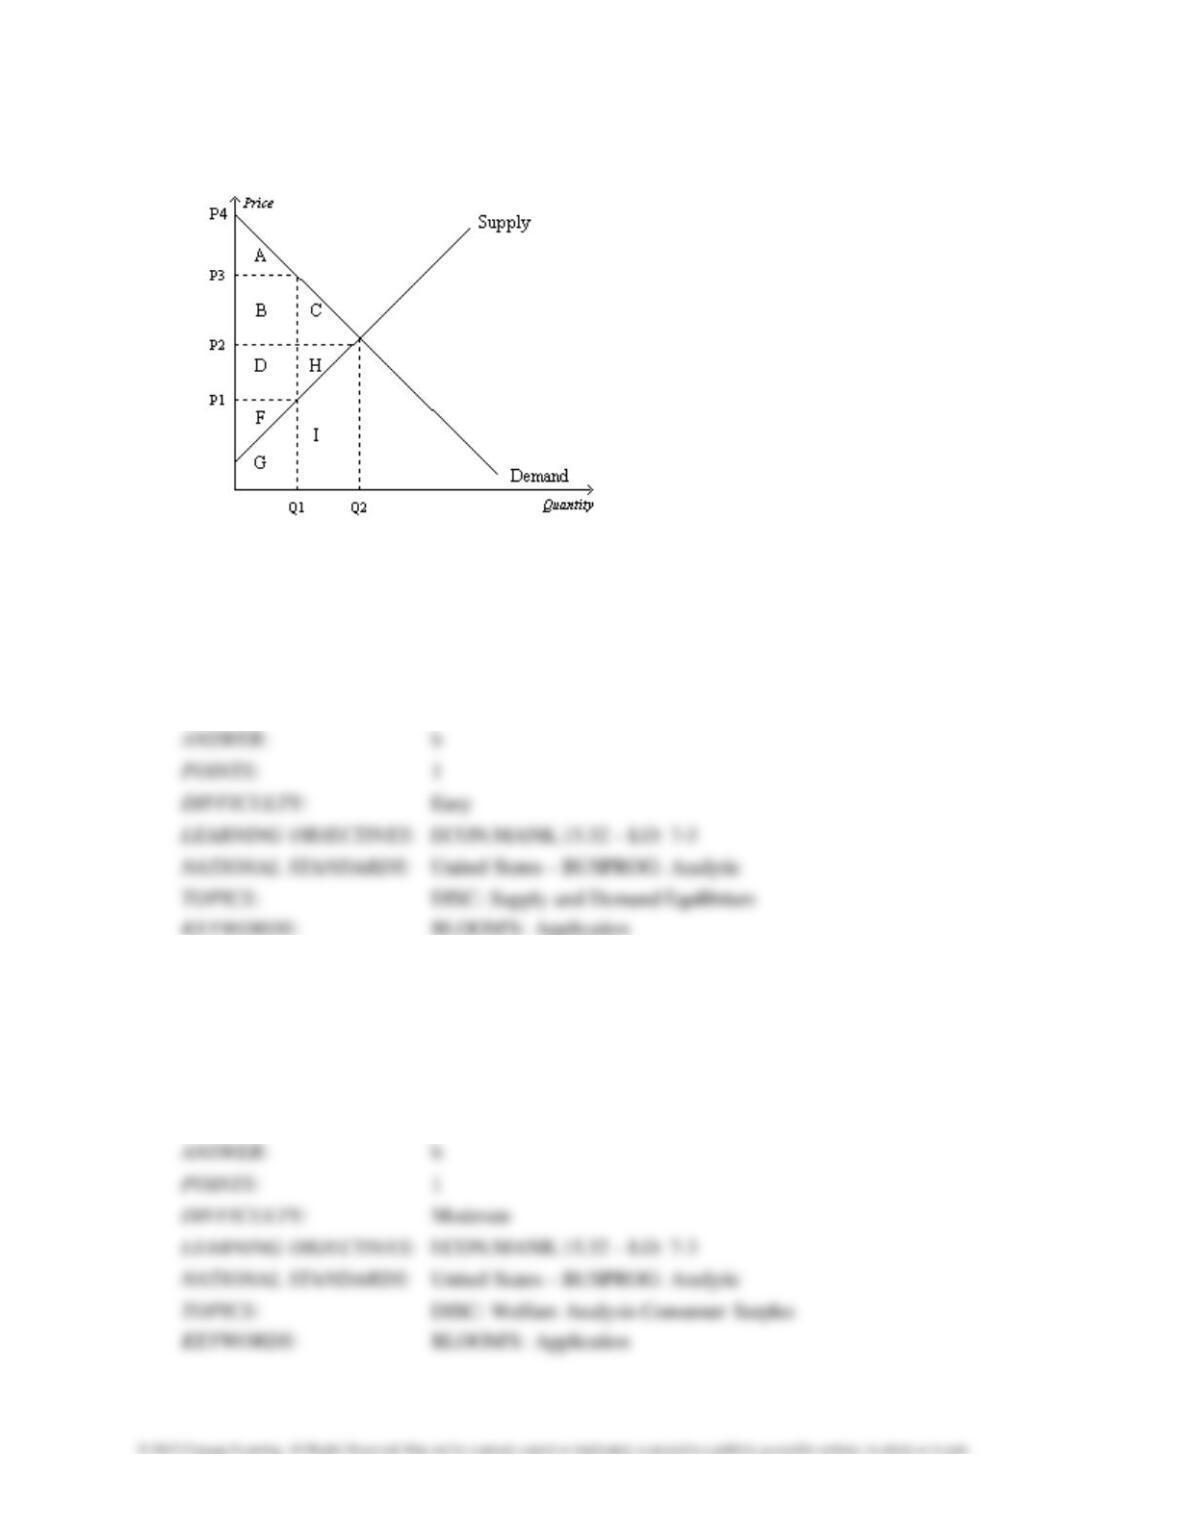
Figure 7-23
64.
Refer to Figure 7-23. The equilibrium price is
a.
P1.
b.
P2.
c.
P3.
d.
P4.
65.
Refer to Figure 7-23. At equilibrium, consumer surplus is represented by the area
a.
A.
b.
A+B+C.
c.
D+H+F.
d.
A+B+C+D+H+F.
66.
Refer to Figure 7-23. If the price were P3, consumer surplus would be represented by the area
a.
A.
b.
A+B+C.
c.
D+H+F.
d.
A+B+C+D+H+F.
67.
Refer to Figure 7-23. At equilibrium, producer surplus is represented by the area
a.
F.
b.
F+G.
c.
D+H+F.
d.
D+H+F+G+I.
68.
Refer to Figure 7-23. If the price were P1, producer surplus would be represented by the area
a.
F.
b.
F+G.
c.
D+H+F.
d.
D+H+F+G+I.
69.
Refer to Figure 7-23. At equilibrium, total surplus is represented by the area
a.
A+B+C.
b.
A+B+D+F.
c.
A+B+C+D+H+F.
d.
A+B+C+D+H+F+G+I.
70.
Refer to Figure 7-23. The efficient price-quantity combination is
a.
P1 and Q1.
b.
P2 and Q2.
c.
P3 and Q1.
d.
P4 and 0.
Consumers, Producers, and the Efficiency of Markets 1903
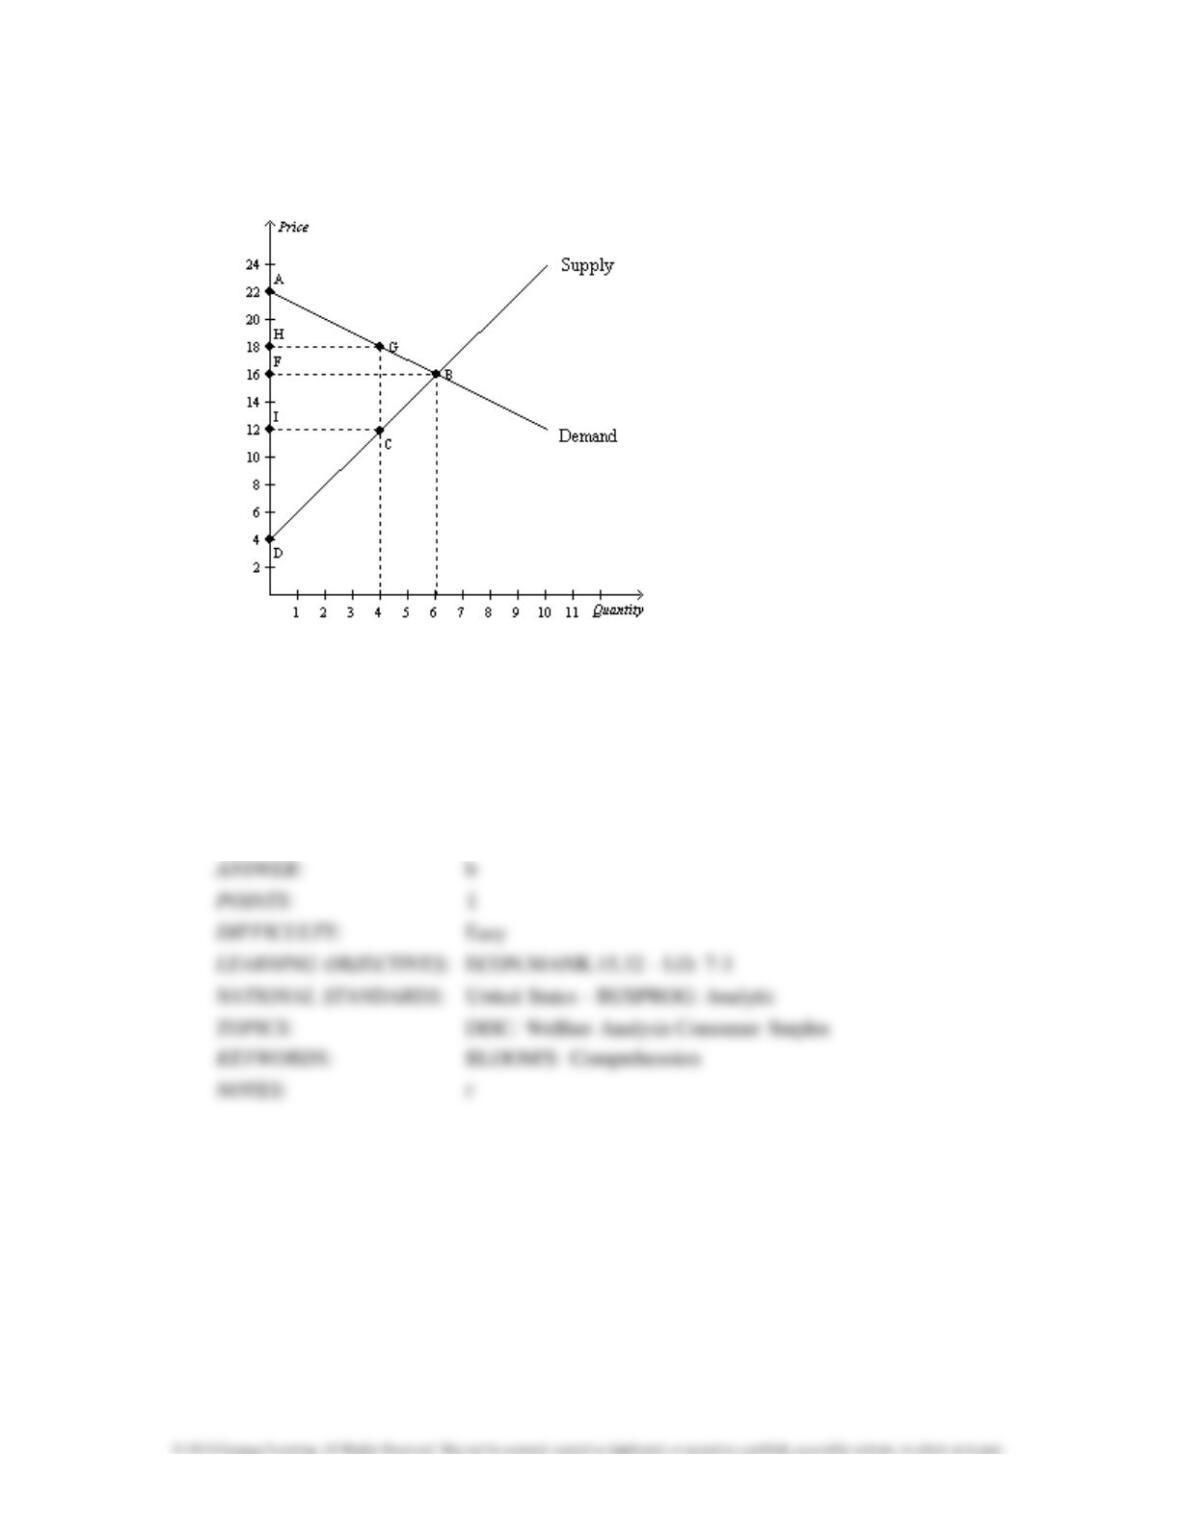
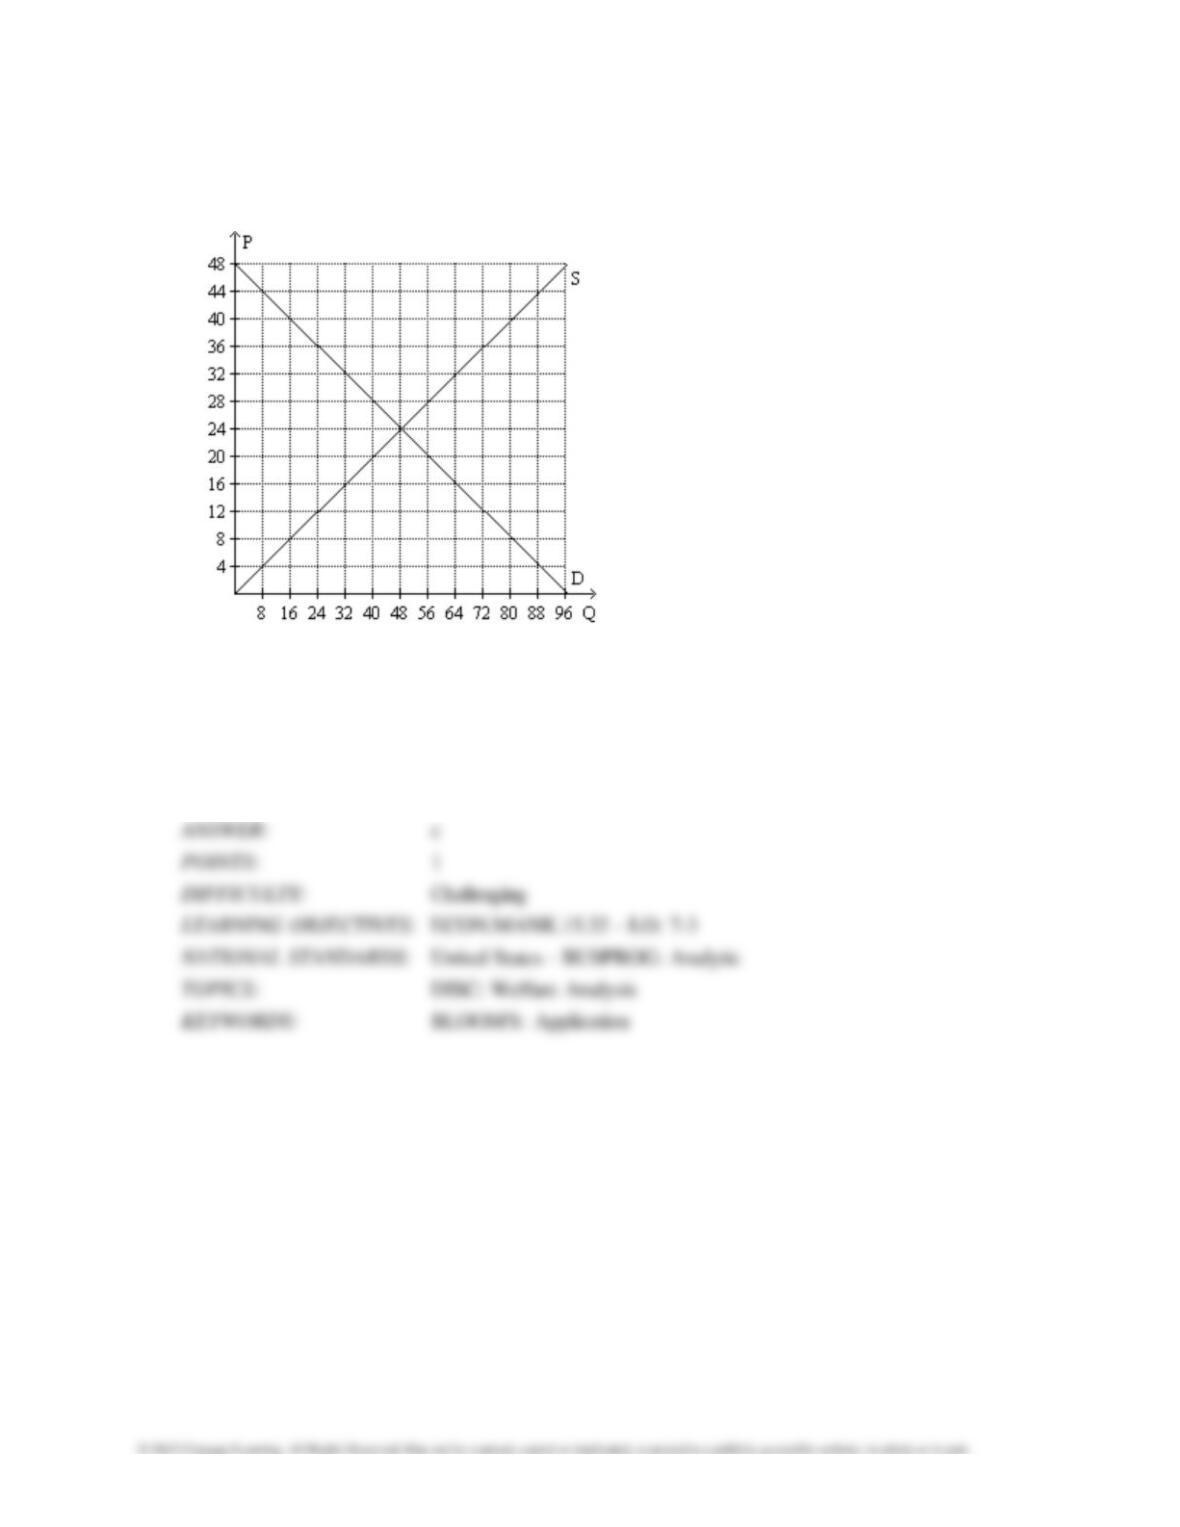
Figure 7-24
71.
Refer to Figure 7–24. At equilibrium, consumer surplus is measured by the area
a.
AHG.
b.
AFB.
c.
ABD.
d.
BDF.
72.
Refer to Figure 7–24. At equilibrium, consumer surplus is
a. $18.
b.
$36.
c.
$54.
d.
$72.
73.
Refer to Figure 7-24. At equilibrium, producer surplus is measured by the area
a.
ABD.
b.
ABF.
c.
CDI.
d.
BDF.
74.
Refer to Figure 7-24. At equilibrium, producer surplus is
a. $36.
b.
$72.
c.
$54.
d.
$18.
75.
Refer to Figure 7-24. At equilibrium, total surplus is measured by the area
a.
ABD.
b.
ABF.
c.
FBD.
d.
HGCI.
76.
Refer to Figure 7-24. At equilibrium, total surplus is
a. $36.
b.
$54.
c.
$18.
d.
$108.
77.
Refer to Figure 7-24. The equilibrium allocation of resources is
a.
efficient because total surplus is maximized at the equilibrium.
b.
efficient because consumer surplus is maximized at the equilibrium.
c.
inefficient because consumer surplus is larger than producer surplus at the equilibrium.
d.
inefficient because producer surplus is not maximized.
78.
Refer to Figure 7-24. If 4 units of the good are produced and sold, then
a.
producer surplus is greater than consumer surplus.
b.
consumer surplus is $16.
c.
total surplus is minimized.
d.
total surplus is not maximized.
79.
Refer to Figure 7-24. If 10 units of the good are produced and sold, then
a.
the marginal cost to sellers exceeds the marginal value to buyers.
b.
producer surplus is maximized.
c.
total surplus is minimized.
d.
the marginal value to buyers exceeds the marginal cost to sellers.
80.
Refer to Figure 7-24. If 6 units of the good are produced and sold, then
a.
consumer surplus is greater than producer surplus.
b.
producer surplus is maximized.
c.
the sum of consumer surplus and producer surplus is maximized.
d.
consumer surplus equals producer surplus.
81.
Refer to Figure 7-24. If 6 units of the good are produced and sold, then
a.
efficiency is achieved in this market.
b.
the marginal value to buyers equals the marginal cost to sellers.
c.
the sum of consumer surplus and producer surplus is maximized.
d.
All of the above are correct.
82.
Refer to Figure 7–24. If the government imposes a price floor at $18, then consumer surplus is
a.
ABF.
b.
AGH.
c.
HGCD.
d.
HGBF.
83.
Refer to Figure 7-24. If the government imposes a price ceiling at $12, then producer surplus is
a.
CDI.
b.
BDF.
c.
BCIF.
d.
HGCD.
1910 Consumers, Producers, and the Efficiency of Markets
Figure 7-25
84.
Refer to Figure 7-25. At the equilibrium price, total surplus is
a. $288.
b. $576.
c. $1,152.
d. $2,304.
85.
Refer to Figure 7–25. Suppose the government imposes a price ceiling of $16 in this market. If
the buyers with
the highest willingness to pay purchase the good, then total surplus will be
a. $256.
b. $768.
c. $1,024.
d. $1,280.
86.
Refer to Figure 7–25. Suppose the government imposes a price floor of $28 in this market. If
the sellers with the
lowest cost are the ones who sell the good and the government does not
purchase any excess units produced, then
total surplus will be
a. $400.
b. $800.
c. $1,120.
d. $1,184.
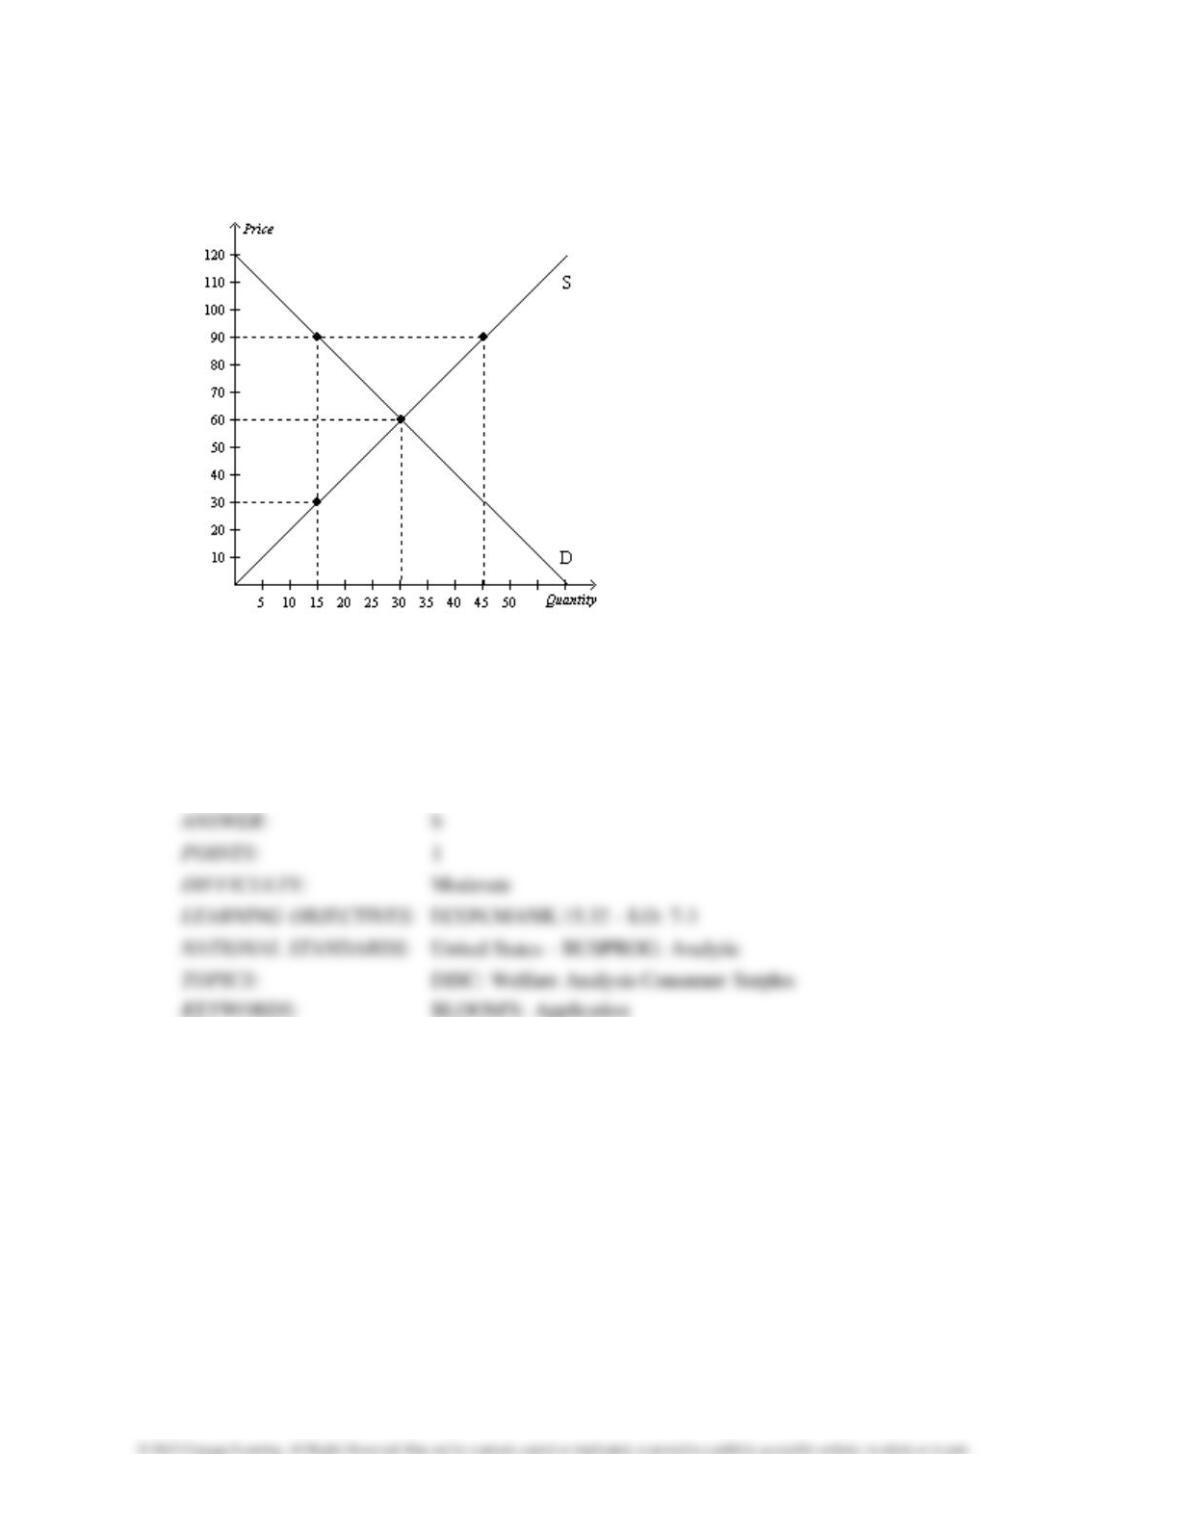
1912 Consumers, Producers, and the Efficiency of Markets
Figure 7-26
87.
Refer to Figure 7–26. At the equilibrium price, consumer surplus is
a. $600.
b. $900.
c. $1,500.
d. $1,800.