
140. Use the following comparative balance sheet to compute ratios as requested.
Buff Company
COMPARATIVE BALANCE SHEET
As of December 31, Year 1 and Year 2
Assets
Year 2
Year 1
Current assets
Cash
$10,000
$ 5,000
Accounts receivable
6,000
4,000
Merchandise inventory
20,000
15,000
Total Current assets
$36,000
$24,000
Property, plant, and equipment
Building
30,000
30,000
Total Assets
$66,000
$54,000
Liabilities and Shareholders’ Equity
Current liabilities
Advance from customer
$ 400
$ 500
Accounts payable
1,000
1,000
Rent payable
2,000
1,500
Utilities payable
200
200
Salaries payable
1,000
800
Total Current liabilities
$ 4,600
$ 4,000
Shareholders’ Equity
Common stock, 2,000 shares
5,000
5,000
Additional paid-in capital
40,000
40,000
Retained earnings
16,400
5,000
Total Shareholders’ equity
61,400
50,000
Total Liabilities and shareholders’ equity
$66,000
$54,000
Compute the following ratios at year end for Year 2 for Buff Company:
a.
Long-term debt ratio
b.
Debt-equity ratio
c.
Current ratio
d.
Leverage ratio
Assume that a bank loans $10,000 cash (due in 5 years) to the company on December 31, Year 2. Make the appropriate adjustments to the financial
statements and compute the following ratios:
e.
Long-term debt ratio
f.
Debt-equity ratio
g.
Current ratio
h.
Leverage ratio
a.
0
= 0 / (61,400 + 0)
b.
7.49%
= 4,600 / 61,400
c.
7.8
= 36,000 / 4,600
d.
1.077
= ((54,000 + 66,000)/2) / ((50,000 + 61,400)/2)
e.
14%
= 10,000 / (61,400 + 10,000)
f.
19.2%
= 14,600 / 76,000
g.
10
= 46,000 / 4,600
h.
1.16
= ((54,000 + 76,000)/2) / ((50,000 + 61,400)/2)
141. Given the following information for the Siri Company, calculate the ratios as requested.
December 31,
December 31,
Year 1
Year 2
Current assets
$100,000
$150,000
Noncurrent assets
400,000
500,000
Current liabilities
50,000
100,000
Long-term debt
300,000
300,000
Common stock, 10,000 shares
100,000
100,000
Retained earnings
50,000
150,000
Year 2
Net income
$ 100,000
Interest expense
40,000
Income taxes
30,000
Total revenues
1,000,000
a.
Interest coverage ratio
b.
Long-term debt ratio at December 31, Year 2
c.
Total assets turnover
a.
4.25
= (100,000 + 40,000 + 30,000) / 40,000
54.5%
= 300,000 / 550,000
c.
1.74
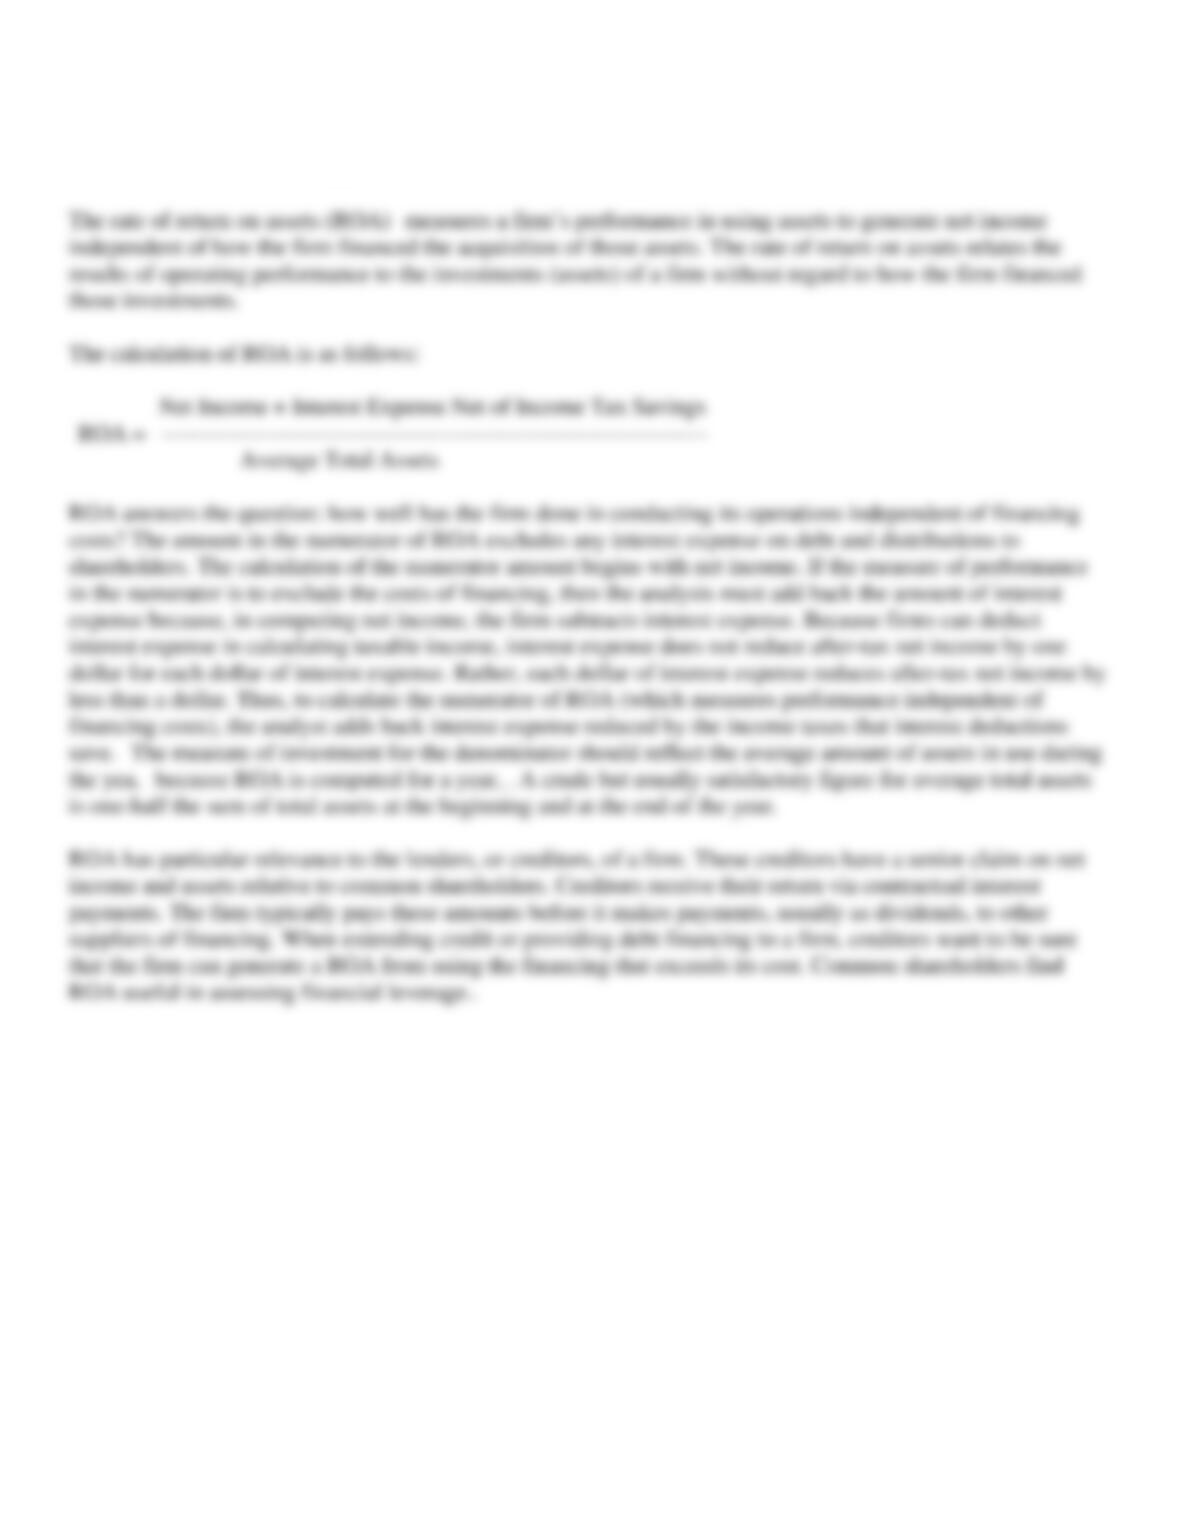
= 1,000,000 / ((500,000 + 650,000)/2)

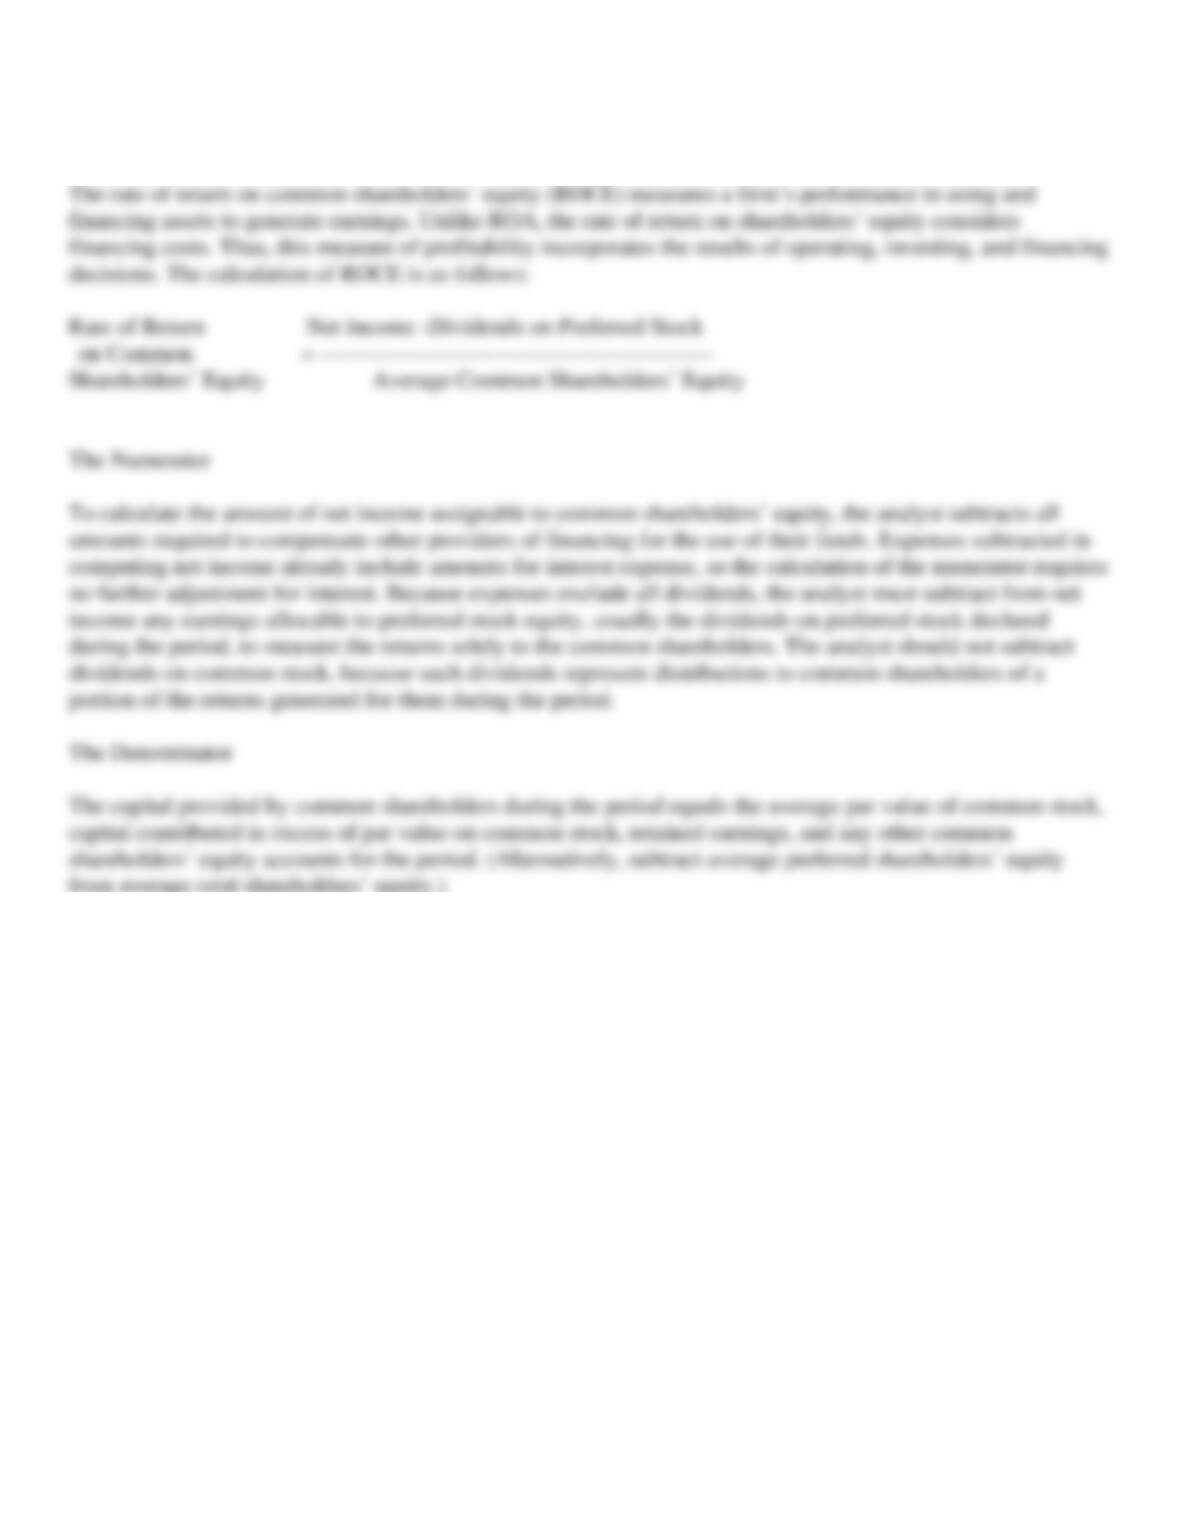
142. The financial statements of the Poston Company appear below. Calculate the following ratios:
a.
Rate of return on assets
b.
Rate of return on common shareholders’ equity
c.
Earnings per share of common stock
d.
Current ratio (both dates)
e.
Cash flow from operations to current liabilities
f.
Long-term debt ratio (both dates)
g.
Cash flow from operations to total liabilities
h.
Interest coverage
January 1
December 31
Current assets
$180,000
$210,000
Noncurrent assets
255,000
275,000
Current liabilities
85,000
78,000
Long-term liabilities
30,000
75,000
Common stock, 10,000 shares
300,000
300,000
Retained earnings
20,000
32,000
Operations
Net income
$84,000
Interest expense
3,000
Income taxes (30 percent rate)
36,000
Cash provided by operations
30,970
Dividends declared
72,000
a.
$84,000 + (1-0.30)$3,000 / 0.5($435,000 + $485,000) = 18.7 percent
b.
$84,000 / 0.5($320,000 + $332,000) = 25.8 percent
c.
$84,000 / 10,000 shares = $8.40 per share
d.
January 1 $180,000 / $85,000 = 2.12:1
December 31 $210,000 / $78,000 = 2.69:1
e.
$30,970 / 0.5($85,000 + $78,000) = 38.0 percent
f.
January 1 $30,000 / $435,000 = 6.9 percent
December 31 $75,000 / $485,000 = 15.5 percent
g.
$30,970 / 0.5($115,000 + $153,000) = 23.1 percent
h.
($84,000 + $36,000 + $3,000) / $3,000 = 41.0 times per year

143. (CMA Jun 96 #6) All-Things Inc. manufactures a variety of consumer products. The company’s founders
have managed the company for thirty years and are now interested in retiring. Consequently, they are seeking to
sell the company. Trial Associates is looking into the acquisition of All-Things and has requested the latest
financial statements and selected financial ratios in order to evaluate All-Things‘ financial stability and
operating efficiency. The summary information provided by All-Things is presented below.
All-Things Inc.
Income Statement
For the Year Ended May 31,Year 6
(in thousands)
Sales (net)
$30,500
Interest income
500
Total revenue
$31,000
Costs and expenses:
Cost of goods sold
17,600
Selling and administrative expense
3,550
Depreciation and amortization expense
1,890
Interest expense
900
Total costs and expenses
$23,940
Income before taxes
7,060
Income taxes
2,900
Net income
$ 4,160
Selected Financial Ratios
5-Year
All-Things
Industry
Year 4
Year 5
Average
Current ratio
1.62
1.61
1.63
Acid-test ratio
.63
.64
.68
Total asset turnover
1.83
1.84
1.84
Inventory turnover
3.21
3.17
3.18
Times interest earned
8.50
8.55
8.45
Total debt to net worth (Total debt / Total shareholders’ equity)
1.02
.86
1.03
Net profit margin
12.1%
13.2%
13.0%
All-Things Inc.
Comparative Statement of Financial Position
As of May 31
(In thousands)
Year 6
Year 7
Cash
$ 400
$ 500
Marketable securities (at cost)
500
200
Accounts receivable (net)
3,200
2,900
Inventory
5,800
5,400
Total current assets
$ 9,900
$ 9,000
Property, plant, and equipment (net)
7,100
7,000
Total assets
$17,000
$16,000
Accounts payable
$ 3,700
$ 3,400
Income taxes payable
900
800
Accrued expenses
1,700
1,400
Total current liabilities
$ 6,300
$ 5,600
Long-term debt
2,000
1,800
Total liabilities
$ 8,300
$ 7,400
Common stock ($1 par value)
2,700
2,700
Paid-in-capital in excess of par
1,000
1,000
Retained earnings
5,000
4,900
Total shareholders’ equity
$ 8,700
$ 8,600
Total liabilities and shareholders’ equity
$17,000
$16,000
Required:
a.
Calculate a new set of ratios for the fiscal Year 6 for All-Things Inc. based on the financial statements presented.
b.
Briefly explain the analytical use of each of the seven ratios presented, describing what the investors can learn about All-Things Inc.’s
financial stability and operating efficiency.
c.
Identify two limitations of ratio analysis.
a.
The calculation of selected financial ratios for All-Things Inc. for the fiscal Year 6 is as follows.
Current ratio = Current assets / Current liabilities =~ $9,900 / $6,300 = 1.57
Acid-test ratio = (Cash + Marketable securities + Net receivables) / Current liabilities = ($400 + $500 + $3,200) / $6,300 = 0.65
Total asset turnover = Net sales / Average total assets = $30,500 / ($17,000+$16,000)/2 = 1.85 times
Inventory turnover = Cost of goods sold / Average inventory = $17,600 / ($5,800 + $5,400)/2 = 3.14 times
Times interest earned = Income before interest & taxes / Interest expense = ($7,060 + $900) / $900 = 8.84
Total debt to net worth = Total debt / Total shareholders’ equity = $8,300 / $8,700 = 0.95
Net profit margin = Net income / Net sales = $4,160 / $30,500 = 13.64%
b.
The analytical use of each of the seven ratios and what investors can learn about All-Things Inc.’s financial stability and operating
efficiency is presented below.
·
Measures the ability to meet short-term obligations using short-term assets.
·
All-Things’ ratio has declined over the last three years from 1.62 to 1.57. This declining trend, coupled with the fact that it is below the
industry average, is not yet a major concern; however, the company should be watched in the future.
·
Measures the ability to meet short-term debt using the most liquid (quick) assets; i.e., excluding the amount invested in inventory.
·
All-Things has been steadily improving and is slightly above the industry average.
·
All-Things’ ratio has been steadily declining and is below the industry average. This slower than average situation may indicate a decline
in operating efficiency, hidden obsolete inventory, or overpriced stock items.
·
All-Things’ ratio has been improving over the last three years and is above the industry average. This indicates that All-Things has been
·
Measures the level of protection creditors have in the case of possible insolvency. Measures the degree of financial leverage and whether
or not the firm will be able to obtain additional financing through borrowing.
·
All-Things’ net profit margin has been improving and is currently above the industry average. Furthermore, this improving net profit
margin indicates the ability of the firm to weather soft economic periods, pay down debt, or take on additional debt for expansion.
144. Financial statement analysis often assess the profitability and risk of an organization. Specific ratios target
each of these areas to answer questions such as “How profitable is this company?” or “How risky (liquid) is an
investment in this company?”
Required:
a.
Discuss three ratios that address how profitable a company might be.
b.
Discuss three ratios that address how risky (liquid) a company might be.
c.
At least two limitations of ratio analysis include the following.
·
Ratios represent conditions that existed in the past, and may not be an indication of the future trend.

145. (CMA adapted, Jun 90 #3) Flores Company is a manufacturer of highly specialized products for
networking video-conferencing equipment. Production of specialized units are, to a large extent, under contract,
with standard units manufactured to marketing projections. Maintenance of customer equipment is an important
area of customer satisfaction. With the recent downturn in the computer industry, the video-conferencing
equipment segment has suffered, causing a slide in Flores’ performance. Flores’ Income Statement for the fiscal
year ended October 31, Year 3, is presented below.
Flores Company
Income Statement
For the Year Ended October 31, Year 3
($000 omitted)
Net sales
Equipment
$6,000
Maintenance contracts
1,800
Total net sales
$7,800
Expenses
Cost of goods sold
4,600
Customer maintenance
1,000
Selling expense
600
Administrative expense
900
Interest expense
150
Total expenses
$7,250
Income before income taxes
$ 550
Income taxes
220
Net income
$ 330
Flores’ return on sales before interest and taxes was 9 percent in fiscal Year 3 while the industry average was 12 percent. Flores’ total asset turnover
was three times, and its return on average assets before interest and taxes was 27 percent, both well below the industry average. In order to improve
performance and raise these ratios nearer to, or above, industry averages, Bill Hunt, Flores’ president, established the following goals for fiscal Year
4.
·
Return on sales before interest and taxes 11 percent
·
Total asset turnover 4 times
·
Return on average assets before interest and taxes 35 percent
To achieve Hunt’s goals, Flores’ management team took into consideration the growing international video-conferencing market and proposed the
following actions for fiscal Year 4.
·
Increase equipment sales prices by 10 percent.
·
Increase the cost of each unit sold by 3 percent for needed technology and quality improvements, and increased variable costs.
·
Increase maintenance inventory by $250,000 at the beginning of the year and add two maintenance technicians at a total cost of $130,000
to cover wages and related travel expenses. These revisions are intended to improve customer service and response time. The increased
inventory will be financed at an annual interest rate of 12 percent; no other borrowings or loan reductions are contemplated during fiscal
Year 4. All other assets will be held to fiscal Year 3 levels.
·
Increase selling expenses by $250,000 but hold administrative expenses at Year 3 levels.
·
The effective rate for Year 4 federal and state taxes is expected to be 40 percent, the same as Year 3.
It is expected that these actions will increase equipment unit sales by 6 percent, with a corresponding 6 percent growth in maintenance contracts.
Required:
146. What factors affect the risk of business firms?
ANALYSIS OF RISK
147. Discuss how investors base their investment decisions on the return anticipated from each investment and
the risk associated with that return.
148. Describe the relation between financial statement analysis and investment decisions.
Relation Between Financial Statement Analysis and Investment Decisions
149. Why are ratios useful?
USEFULNESS OF RATIOS
150. What are the limitations of ratio analysis?
LIMITATIONS OF RATIO ANALYSIS
151. A measure of profitability for a firm engaging in operations selling merchandise in its stores to generate
net income includes the rate of return on assets. Discuss the rate of return on assets.
RATE OF RETURN ON ASSETS
152. Discuss how the rate of return on common shareholders’ equity is calculated.
RATE OF RETURN ON COMMON SHAREHOLDERS’ EQUITY