99. Selected data from Carson Corporation’s financial statements for the year ended December 31, Year 2 are as
follows.
Current ratio
1.4
Quick ratio
0.86
Current liabilities
$450,000
Accounts receivable turnover
6.0
Merchandise inventory turnover
4.0
Rate of return on assets
6.5%
Selected Account Balances at December 31, Year 1:
Accounts receivable
$355,000
Merchandise inventory
190,000
Year 2 Operations
Sales
$1,241,000
Cost of goods sold
800,000
Assuming that prepaid expenses are immaterial, ending merchandise inventory at December 31, Year 2 is
100. Why might a firm use the quick ratio instead of the current ratio in its liquidity analysis?
101. Ramer Company and Matson Company
Assume the following information for Ramer Company, Matson Company, and for their common industry for a
recent year.
Ramer
Matson
Industry Average
Current ratio
3.50
2.80
3.00
Accounts receivable turnover
5.00
8.10
6.00
Inventory turnover
6.20
8.00
6.10
Interest coverage ratio
9.00
12.30
10.40
Debt-equity ratio
0.70
0.40
0.55
Return on investment
0.15
0.12
0.15
Dividend payout ratio
0.80
0.60
0.55
Earnings per share
$3.00
$ 2.00
–
(CMA adapted, Jun 90 #19) Regarding the data for Ramer Company and Matson Company, which one of the following is correct if both companies
have the same total assets and the same sales?
102. Ramer Company and Matson Company
Assume the following information for Ramer Company, Matson Company, and for their common industry for a
recent year.
Ramer
Matson
Industry Average
Current ratio
3.50
2.80
3.00
Accounts receivable turnover
5.00
8.10
6.00
Inventory turnover
6.20
8.00
6.10
Interest coverage ratio
9.00
12.30
10.40
Debt-equity ratio
0.70
0.40
0.55
Return on investment
0.15
0.12
0.15
Dividend payout ratio
0.80
0.60
0.55
Earnings per share
$3.00
$ 2.00
–
(CMA adapted, Jun 90 #18) Regarding the data for Ramer and Matson Company, if a company is profitable and is effectively using leverage,
which one of the following ratios is likely to be the largest?
103. (CMA adapted, Jun 90 #21) Regarding the information for Ramer Company and Matson Company,
assume that some of the ratios and data for Ramer and Matson are affected by income taxes. Assuming no
interperiod income tax allocation, which of the following items would be directly affected by income taxes for
the period?
104. (CMA adapted, Jun 90 #20) Regarding the data for Ramer Company and Matson Company, the attitudes of
both Ramer and Matson concerning risk are best explained by the
105. (CMA adapted, Dec 93 #17) Norton Inc. has a 2 to 1 current ratio. This ratio would increase to more than
2 to 1 if
106. Mother’s Company has current assets of $900,000 and current liabilities of $1,000,000. Mother’s
Company’s current ratio would be increased by
107. A measure of short-term debt paying ability is a company’s

108. (CMA adapted, Dec 87 #1) When a balance sheet amount is related to an income statement amount in
computing a ratio,

109. King Products Corporation
King Products Corporation
Statement of Financial Position
(in thousands)
June 30
Year 6
Year 5
Cash
$ 60
$ 50
Marketable securities (at market)
40
30
Accounts receivable (net)
90
60
Inventories (at lower of cost or market)
120
100
Prepaid items
30
40
Total current assets
$ 340
$280
Long-term investments (at cost)
50
40
Land (at cost)
150
150
Building (net)
160
180
Equipment (net)
190
200
Patents (net)
70
34
Goodwill (net)
40
26
Total long-term assets
$ 660
$630
Total assets
$1,000
$910
Notes payable
$ 46
$ 24
Accounts payable
94
56
Accrued interest
30
30
Total current liabilities
$ 170
$110
Notes payable, 10% due 12/31/Year 12
20
20
Bonds payable, 12% due 6/30/Year 15
30
30
Total long-term debt
$ 50
$ 50
Total liabilities
$ 220
$160
Preferred stock-5% cumulative, $100 par, non-participating, authorized, issued and
outstanding, 2,000 shares
200
200
Common stock-$10 par, 40,000 shares authorized, 30,000 shares issued and outstanding
300
300
Additional paid-in capital—common
150
150
Retained earnings
130
100
Total shareholders’ equity
$ 780
$750
Total liabilities and shareholders’ equity
$1,000
$910
King Products Corporation
Income Statement
For the year ended June 30
(in thousands)
Year 6
Net sales
$600
Costs and expenses
Cost of goods sold
440
Selling, general, and administrative
60
Interest expense
10
Income before taxes
$ 90
Income taxes
45
Net income
$ 45
(CMA adapted, Dec 96 #15) Refer to the King Products Corporation example. King Products Corporation’s inventory turnover for the fiscal year
ended at June 30, Year 6, was

110. King Products Corporation
King Products Corporation
Statement of Financial Position
(in thousands)
June 30
Year 6
Year 5
Cash
$ 60
$ 50
Marketable securities (at market)
40
30
Accounts receivable (net)
90
60
Inventories (at lower of cost or market)
120
100
Prepaid items
30
40
Total current assets
$ 340
$280
Long-term investments (at cost)
50
40
Land (at cost)
150
150
Building (net)
160
180
Equipment (net)
190
200
Patents (net)
70
34
Goodwill (net)
40
26
Total long-term assets
$ 660
$630
Total assets
$1,000
$910
Notes payable
$ 46
$ 24
Accounts payable
94
56
Accrued interest
30
30
Total current liabilities
$ 170
$110
Notes payable, 10% due 12/31/Year 12
20
20
Bonds payable, 12% due 6/30/Year 15
30
30
Total long-term debt
$ 50
$ 50
Total liabilities
$ 220
$160
Preferred stock-5% cumulative, $100 par, non-participating, authorized, issued and
outstanding, 2,000 shares
200
200
Common stock-$10 par, 40,000 shares authorized, 30,000 shares issued and outstanding
300
300
Additional paid-in capital—common
150
150
Retained earnings
130
100
Total shareholders’ equity
$ 780
$750
Total liabilities and shareholders’ equity
$1,000
$910
King Products Corporation
Income Statement
For the year ended June 30
(in thousands)
Year 6
Net sales
$600
Costs and expenses
Cost of goods sold
440
Selling, general, and administrative
60
Interest expense
10
Income before taxes
$ 90
Income taxes
45
Net income
$ 45
(CMA adapted, Dec 96 #16) Refer to the King Products Corporation example. King Products Corporation’s accounts receivable turnover for the
fiscal year ended at June 30, Year 6, was

111. King Products Corporation
King Products Corporation
Statement of Financial Position
(in thousands)
June 30
Year 6
Year 5
Cash
$ 60
$ 50
Marketable securities (at market)
40
30
Accounts receivable (net)
90
60
Inventories (at lower of cost or market)
120
100
Prepaid items
30
40
Total current assets
$ 340
$280
Long-term investments (at cost)
50
40
Land (at cost)
150
150
Building (net)
160
180
Equipment (net)
190
200
Patents (net)
70
34
Goodwill (net)
40
26
Total long-term assets
$ 660
$630
Total assets
$1,000
$910
Notes payable
$ 46
$ 24
Accounts payable
94
56
Accrued interest
30
30
Total current liabilities
$ 170
$110
Notes payable, 10% due 12/31/Year 12
20
20
Bonds payable, 12% due 6/30/Year 15
30
30
Total long-term debt
$ 50
$ 50
Total liabilities
$ 220
$160
Preferred stock-5% cumulative, $100 par, non-participating, authorized, issued and
outstanding, 2,000 shares
200
200
Common stock-$10 par, 40,000 shares authorized, 30,000 shares issued and outstanding
300
300
Additional paid-in capital—common
150
150
Retained earnings
130
100
Total shareholders’ equity
$ 780
$750
Total liabilities and shareholders’ equity
$1,000
$910
King Products Corporation
Income Statement
For the year ended June 30
(in thousands)
Year 6
Net sales
$600
Costs and expenses
Cost of goods sold
440
Selling, general, and administrative
60
Interest expense
10
Income before taxes
$ 90
Income taxes
45
Net income
$ 45
(CMA adapted, Dec 96 #17) Refer to the King Products Corporation example. King Products Corporation’s average collection period for the fiscal
year ended at June 30, Year 6, using a 360-day year, was.

112. King Products Corporation
King Products Corporation
Statement of Financial Position
(in thousands)
June 30
Year 6
Year 5
Cash
$ 60
$ 50
Marketable securities (at market)
40
30
Accounts receivable (net)
90
60
Inventories (at lower of cost or market)
120
100
Prepaid items
30
40
Total current assets
$ 340
$280
Long-term investments (at cost)
50
40
Land (at cost)
150
150
Building (net)
160
180
Equipment (net)
190
200
Patents (net)
70
34
Goodwill (net)
40
26
Total long-term assets
$ 660
$630
Total assets
$1,000
$910
Notes payable
$ 46
$ 24
Accounts payable
94
56
Accrued interest
30
30
Total current liabilities
$ 170
$110
Notes payable, 10% due 12/31/Year 12
20
20
Bonds payable, 12% due 6/30/Year 15
30
30
Total long-term debt
$ 50
$ 50
Total liabilities
$ 220
$160
Preferred stock-5% cumulative, $100 par, non-participating, authorized, issued and
outstanding, 2,000 shares
200
200
Common stock-$10 par, 40,000 shares authorized, 30,000 shares issued and outstanding
300
300
Additional paid-in capital—common
150
150
Retained earnings
130
100
Total shareholders’ equity
$ 780
$750
Total liabilities and shareholders’ equity
$1,000
$910
King Products Corporation
Income Statement
For the year ended June 30
(in thousands)
Year 6
Net sales
$600
Costs and expenses
Cost of goods sold
440
Selling, general, and administrative
60
Interest expense
10
Income before taxes
$ 90
Income taxes
45
Net income
$ 45
(CMA adapted, Dec 96 #18) Refer to the King Products Corporation example. King Products Corporation’s quick (acid test) ratio at June 30, Year 6,
was

113. Devlin Company
Devlin Company
Statement of Financial Position
as of May 31
(in thousands)
Assets
Year 7
Year 6
Current assets
Cash
$ 45
$ 38
Trading securities
30
20
Accounts receivable (net)
68
48
Inventories
90
80
Prepaid expenses
22
30
Total current assets
$255
$216
Investments, at equity
38
30
Property, plant, and equipment (net)
375
400
Intangible assets (net)
80
45
Total assets
$748
$691
Liabilities and shareholders’ equity
Current liabilities
Notes payable
$ 35
$ 18
Accounts payable
70
42
Accrued expenses
5
4
Income taxes payable
15
16
Total current liabilities
125
80
Long-term debt
35
35
Deferred taxes
3
2
Total liabilities
$163
$117
Shareholders’ equity
Preferred stock, 6%, $100 par value, cumulative
150
150
Common stock, $10 par value
225
195
Additional paid-in capital-common stock
114
100
Retained earnings
96
129
Total shareholders’ equity
$585
$574
Total liabilities and shareholders’ equity
$748
$691
Devlin Company
Income Statement
For the year ended May 31
(in thousands)
Year 7
Year 6
Net sales
$480
$460
Costs and expenses
Cost of goods sold
330
315
Selling, general, and administrative
52
51
Interest expense
8
9
Income before taxes
$ 90
$ 85
Income taxes
36
34
Net income
$ 54
$ 51
(CMA adapted, Jun 97 #13) Refer to the Devlin Company example. Devlin Company’s acid-test ratio at May 31, Year 7, was

114. Devlin Company
Devlin Company
Statement of Financial Position
as of May 31
(in thousands)
Assets
Year 7
Year 6
Current assets
Cash
$ 45
$ 38
Trading securities
30
20
Accounts receivable (net)
68
48
Inventories
90
80
Prepaid expenses
22
30
Total current assets
$255
$216
Investments, at equity
38
30
Property, plant, and equipment (net)
375
400
Intangible assets (net)
80
45
Total assets
$748
$691
Liabilities and shareholders’ equity
Current liabilities
Notes payable
$ 35
$ 18
Accounts payable
70
42
Accrued expenses
5
4
Income taxes payable
15
16
Total current liabilities
125
80
Long-term debt
35
35
Deferred taxes
3
2
Total liabilities
$163
$117
Shareholders’ equity
Preferred stock, 6%, $100 par value, cumulative
150
150
Common stock, $10 par value
225
195
Additional paid-in capital-common stock
114
100
Retained earnings
96
129
Total shareholders’ equity
$585
$574
Total liabilities and shareholders’ equity
$748
$691
Devlin Company
Income Statement
For the year ended May 31
(in thousands)
Year 7
Year 6
Net sales
$480
$460
Costs and expenses
Cost of goods sold
330
315
Selling, general, and administrative
52
51
Interest expense
8
9
Income before taxes
$ 90
$ 85
Income taxes
36
34
Net income
$ 54
$ 51
(CMA adapted, Jun 97 #14) Refer to the Devlin Company example. Assuming there are no preferred stock dividends in arrears, Devlin Company’s
return on common shareholders’ equity for the year ended May 31, Year 7, was

115. Devlin Company
Devlin Company
Statement of Financial Position
as of May 31
(in thousands)
Assets
Year 7
Year 6
Current assets
Cash
$ 45
$ 38
Trading securities
30
20
Accounts receivable (net)
68
48
Inventories
90
80
Prepaid expenses
22
30
Total current assets
$255
$216
Investments, at equity
38
30
Property, plant, and equipment (net)
375
400
Intangible assets (net)
80
45
Total assets
$748
$691
Liabilities and shareholders’ equity
Current liabilities
Notes payable
$ 35
$ 18
Accounts payable
70
42
Accrued expenses
5
4
Income taxes payable
15
16
Total current liabilities
125
80
Long-term debt
35
35
Deferred taxes
3
2
Total liabilities
$163
$117
Shareholders’ equity
Preferred stock, 6%, $100 par value, cumulative
150
150
Common stock, $10 par value
225
195
Additional paid-in capital-common stock
114
100
Retained earnings
96
129
Total shareholders’ equity
$585
$574
Total liabilities and shareholders’ equity
$748
$691
Devlin Company
Income Statement
For the year ended May 31
(in thousands)
Year 7
Year 6
Net sales
$480
$460
Costs and expenses
Cost of goods sold
330
315
Selling, general, and administrative
52
51
Interest expense
8
9
Income before taxes
$ 90
$ 85
Income taxes
36
34
Net income
$ 54
$ 51
(CMA adapted, Jun 97 #18) Refer to the Devlin Company example. Devlin Company’s times interest earned for the year ended May 31, Year 7,
was

116. Devlin Company
Devlin Company
Statement of Financial Position
as of May 31
(in thousands)
Assets
Year 7
Year 6
Current assets
Cash
$ 45
$ 38
Trading securities
30
20
Accounts receivable (net)
68
48
Inventories
90
80
Prepaid expenses
22
30
Total current assets
$255
$216
Investments, at equity
38
30
Property, plant, and equipment (net)
375
400
Intangible assets (net)
80
45
Total assets
$748
$691
Liabilities and shareholders’ equity
Current liabilities
Notes payable
$ 35
$ 18
Accounts payable
70
42
Accrued expenses
5
4
Income taxes payable
15
16
Total current liabilities
125
80
Long-term debt
35
35
Deferred taxes
3
2
Total liabilities
$163
$117
Shareholders’ equity
Preferred stock, 6%, $100 par value, cumulative
150
150
Common stock, $10 par value
225
195
Additional paid-in capital-common stock
114
100
Retained earnings
96
129
Total shareholders’ equity
$585
$574
Total liabilities and shareholders’ equity
$748
$691
Devlin Company
Income Statement
For the year ended May 31
(in thousands)
Year 7
Year 6
Net sales
$480
$460
Costs and expenses
Cost of goods sold
330
315
Selling, general, and administrative
52
51
Interest expense
8
9
Income before taxes
$ 90
$ 85
Income taxes
36
34
Net income
$ 54
$ 51
(CMA adapted, Jun 97 #15) Refer to the Devlin Company example. Devlin Company’s inventory turnover for the year ended May 31, Year 7, was

117. Devlin Company
Devlin Company
Statement of Financial Position
as of May 31
(in thousands)
Assets
Year 7
Year 6
Current assets
Cash
$ 45
$ 38
Trading securities
30
20
Accounts receivable (net)
68
48
Inventories
90
80
Prepaid expenses
22
30
Total current assets
$255
$216
Investments, at equity
38
30
Property, plant, and equipment (net)
375
400
Intangible assets (net)
80
45
Total assets
$748
$691
Liabilities and shareholders’ equity
Current liabilities
Notes payable
$ 35
$ 18
Accounts payable
70
42
Accrued expenses
5
4
Income taxes payable
15
16
Total current liabilities
125
80
Long-term debt
35
35
Deferred taxes
3
2
Total liabilities
$163
$117
Shareholders’ equity
Preferred stock, 6%, $100 par value, cumulative
150
150
Common stock, $10 par value
225
195
Additional paid-in capital-common stock
114
100
Retained earnings
96
129
Total shareholders’ equity
$585
$574
Total liabilities and shareholders’ equity
$748
$691
Devlin Company
Income Statement
For the year ended May 31
(in thousands)
Year 7
Year 6
Net sales
$480
$460
Costs and expenses
Cost of goods sold
330
315
Selling, general, and administrative
52
51
Interest expense
8
9
Income before taxes
$ 90
$ 85
Income taxes
36
34
Net income
$ 54
$ 51
(CMA adapted, Jun 97 #16) Refer to the Devlin Company example. Devlin Company’s asset turnover for the year ended May 31, Year 7, was

118. Devlin Company
Devlin Company
Statement of Financial Position
as of May 31
(in thousands)
Assets
Year 7
Year 6
Current assets
Cash
$ 45
$ 38
Trading securities
30
20
Accounts receivable (net)
68
48
Inventories
90
80
Prepaid expenses
22
30
Total current assets
$255
$216
Investments, at equity
38
30
Property, plant, and equipment (net)
375
400
Intangible assets (net)
80
45
Total assets
$748
$691
Liabilities and shareholders’ equity
Current liabilities
Notes payable
$ 35
$ 18
Accounts payable
70
42
Accrued expenses
5
4
Income taxes payable
15
16
Total current liabilities
125
80
Long-term debt
35
35
Deferred taxes
3
2
Total liabilities
$163
$117
Shareholders’ equity
Preferred stock, 6%, $100 par value, cumulative
150
150
Common stock, $10 par value
225
195
Additional paid-in capital-common stock
114
100
Retained earnings
96
129
Total shareholders’ equity
$585
$574
Total liabilities and shareholders’ equity
$748
$691
Devlin Company
Income Statement
For the year ended May 31
(in thousands)
Year 7
Year 6
Net sales
$480
$460
Costs and expenses
Cost of goods sold
330
315
Selling, general, and administrative
52
51
Interest expense
8
9
Income before taxes
$ 90
$ 85
Income taxes
36
34
Net income
$ 54
$ 51
(CMA adapted, Jun 97 #17) Refer to the Devlin Company example. Devlin Company’s rate of return on assets for the year ended May 31, Year 7,
was
119. A firm desires to increase its ratio of cash flow from operations divided by average current liabilities from
its anticipated level of 30 percent for the coming year to a more desirable level of 40 percent. Which of the
following actions is consistent with this increase?
120. A steel manufacturer experienced a decrease in its fixed asset turnover from .9 in Year 5 to .7 in Year 6.
This change is consistent with which of the following explanations?
121. Inventory turnover ratio
122. Various techniques are used in the analysis of financial data to emphasize the comparative and relative
importance of data presented and to evaluate the position of the firm. These techniques include(s)
123. A common-sized income statement permit(s)
124. Comparing firms using a common-size balance sheet rests on the assumption that
125. A common-size income statementpermits an analysis of changes or differences in the relations between
revenues, expenses, and net income and identifies relations that the analyst should explore further, such as
126. Concerning the analysis of financial data to emphasize the comparative and relative importance of data
presented and to evaluate the position of the firm, it is important to take into consideration
127. Many firms sell to customers on account as a strategy to stimulate sales. Comparing accounts receivable
turnovers over time or between firms requires an analysis of
128. An analyst examines changes in a firm’s various ratios over a three-year period—a so-called _____
analysis and performs a _____ analysis comparing a given firm’s ratios with those of other firms for a specific
period.
129. The preparation of pro forma financial statements typically begins with the _____, followed by the _____
and then the _____.
130. What is the first step in preparing pro forma financial statements?
131. What is the last step in preparing pro forma financial statements?
132. Why would a firm prepare pro forma financial statements?
133. The traditional use of the term _____ financial statements refers to projected financial statements based
on some set of assumptions about the future. One set of assumptions might be that historical patterns (for
example, growth rates or rates of return) will continue.
134. The analysis of business transactions is facilitated by
135. In a modern corporate environment, the trial balance is prepared from the
136. Ratio analysis is one tool management may use to examine a firm’s profitability and risk. Another tool
often used by management are pro forma financial statements.
Required:
a.
Describe the purpose of pro forma financial statements.
b.
Describe how pro forma financial statements may be constructed.
assumptions to test their viability.
137. For each of the following independent situations, suggest what ratio would provide appropriate information
to answer the question.
a.
You need to determine the number of days outstanding for accounts receivable.
b.
You are considering investing in bonds of a publicly held company. You wish to analyze the possibility of the company failing to meet
required interest payments.
c.
You wish to measure and compare a firm’s performance in using assets independent of the financing of the assets to the industry
average.
d.
You wish to assess a company’s ability to meet immediate liabilities in an emergency.
e.
You would like to determine how much capital is provided by common shareholders.
f.
You wish to understand how long inventory remains on hand during the period.
g.
You are considering how much additional long-term debt a company may be able to take on.
h.
You are interested in how productive a company’s fixed assets have been.
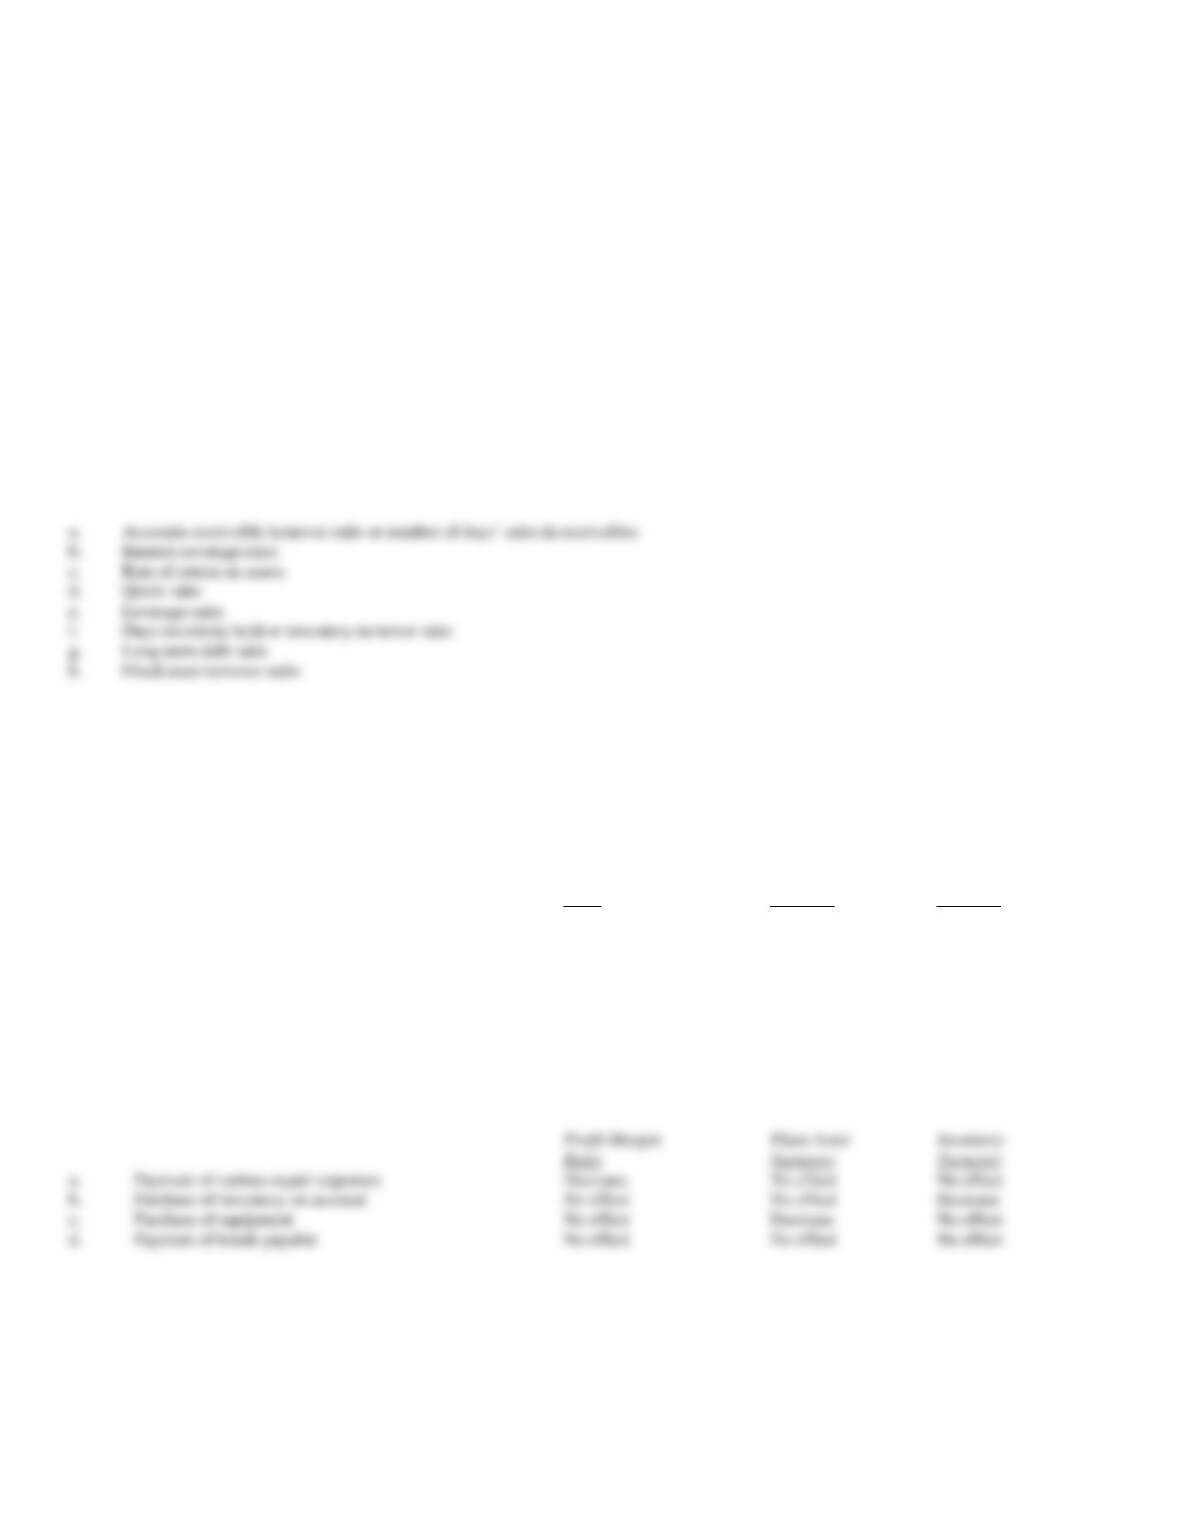
138. Indicate the effects (increase, decrease, no effect) of the following independent transactions on (1) the
profit margin ratio, (2) the plant asset turnover, and (3) the inventory turnover.
Profit Margin
Plant Asset
Inventory
Ratio
Turnover
Turnover
a.
Payment of various repair expenses
__________
__________
__________
b.
Purchase of inventory on account
__________
__________
__________
c.
Purchase of equipment
__________
__________
__________
d.
Payment of bonds payable
__________
__________
__________
Profit Margin
Plant Asset
Inventory
Ratio
Turnover
Turnover
a.
Payment of various repair expenses
Decrease
No effect
No effect
b.
Purchase of inventory on account
No effect
No effect
Decrease
c.
Purchase of equipment
No effect
Decrease
No effect
d.
Payment of bonds payable
No effect
No effect
No effect
a.
Accounts receivable turnover ratio or number of days’ sales in receivables
b.
Interest coverage ratio
c.
Rate of return on assets
d.
Quick ratio
e.
Leverage ratio
Days inventory held or inventory turnover ratio
g.
Long-term debt ratio
h.
Fixed asset turnover ratio

139. For each of the following independent situations, solve for the unknown amount.
CASE A
CASE B
CASE C
CASE D
Current ratio
A
1.14
2.0
0.67
Quick ratio
0.2
B
1.0
0.60
Current liabilities
400
175
100
360
Current assets
150
200
C
240
Highly liquid assets
80
75
100
D