84. Dunn Corporation finds that 60% of the time spent in its manufacturing process is on non-value added
activities such as moving parts and inspection. Dunn needs to improve:
85. Companies using just–in–time (JIT) inventory systems will generally have:
86. Identify the company or companies below that is (are) most likely using a traditional inventory system as
opposed to a JIT system.
87. Which of the following is not one of the three dimensions of time that successful organizations must focus
on?
Use the following to answer questions 88-91:
Le Francois Company developed the following information for its first quarter cost of quality
report:
Hilton – Chapter 07
88. The total cost of prevention activities for Le Francois Company is:
89. The relevant percentage to be used to express internal failure activities at Le Francois is:
90. The total cost of external failure activities at Le Francois is:
91. The relevant percentage to be used to express appraisal activities at Le Francois is:
92. Customer response time:
93. Which of the following is not a component of customer response time?
94. Which of the following is compatible with Just-in-Time (JIT) manufacturing techniques?
95. Which of the following activities would be found in a “pull” manufacturing environment?
96. Which of the following is likely to be found in a “push” manufacturing environment?
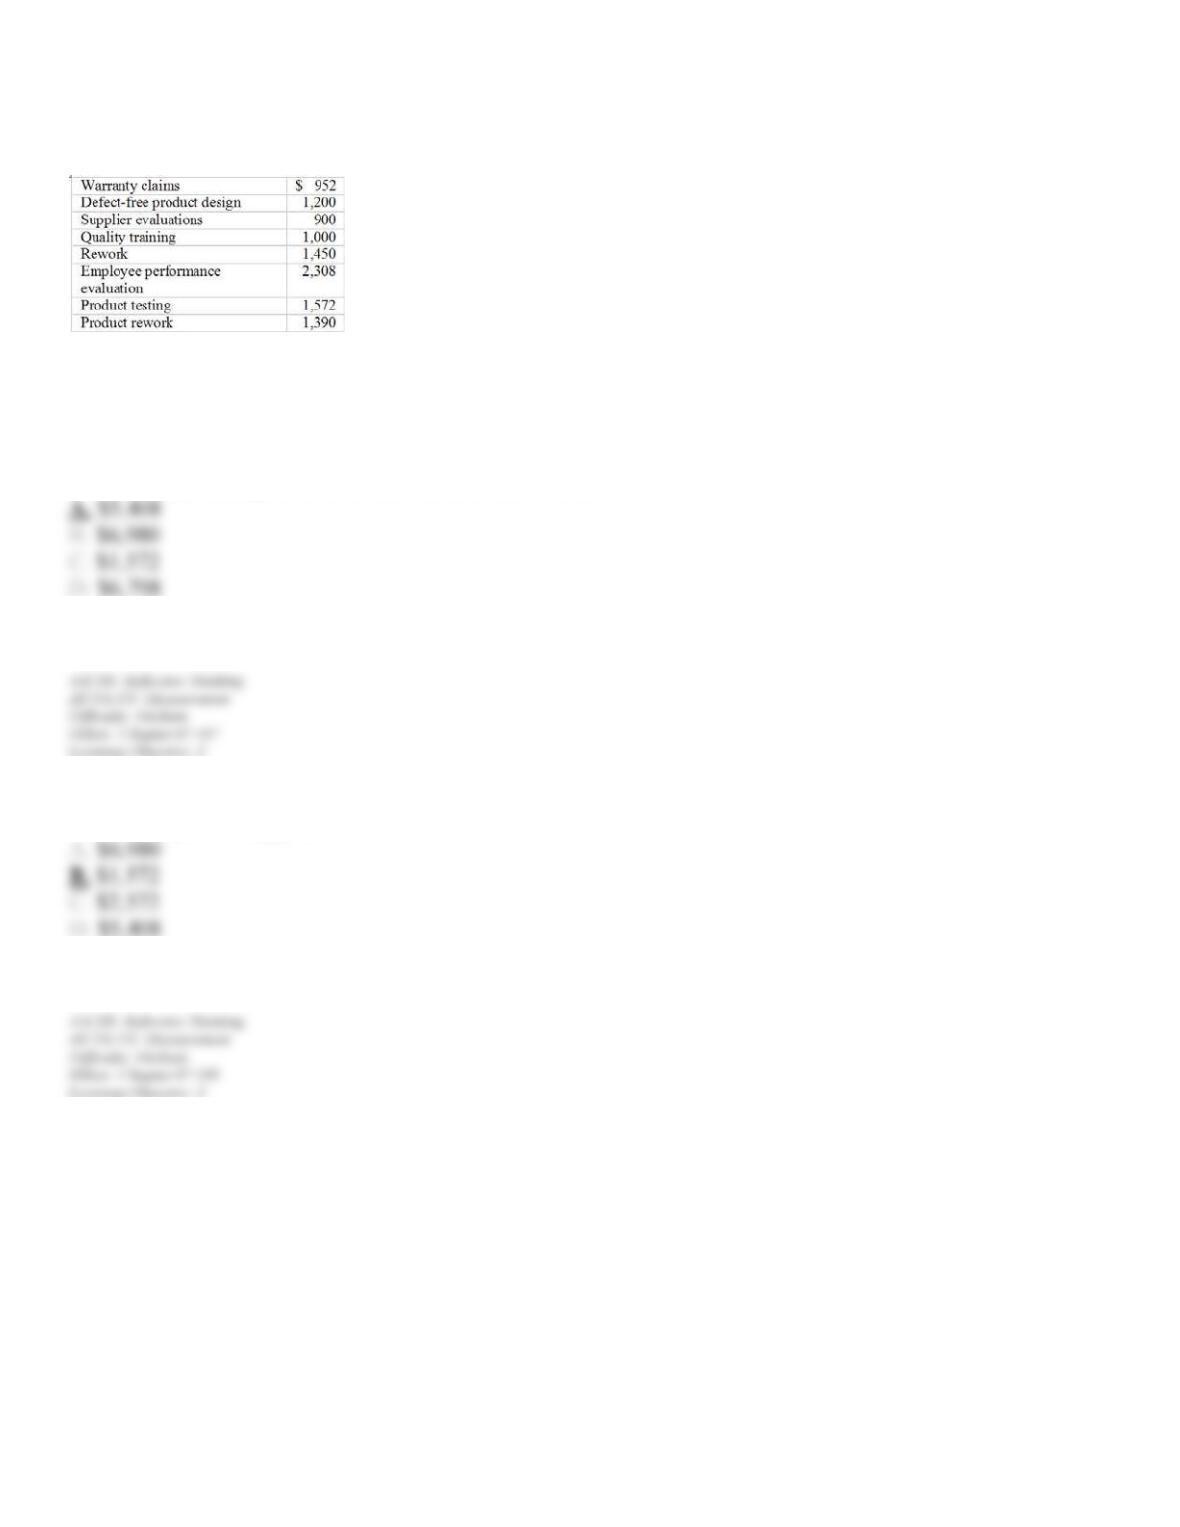
Use the following to answer questions 97-99:
Listed below are selected operating costs for Miskelly Products last month:
Hilton – Chapter 07
97. Miskelly’s total prevention costs for the month were:
98. Miskelly’s total appraisal costs for the month were:
99. Miskelly’s total external failure costs for the month were
100. The quality control department at Conant Manufacturing Company prepared the following diagnostic tool
regarding causes of quality problems:
The diagnostic tool presented above is known as a:
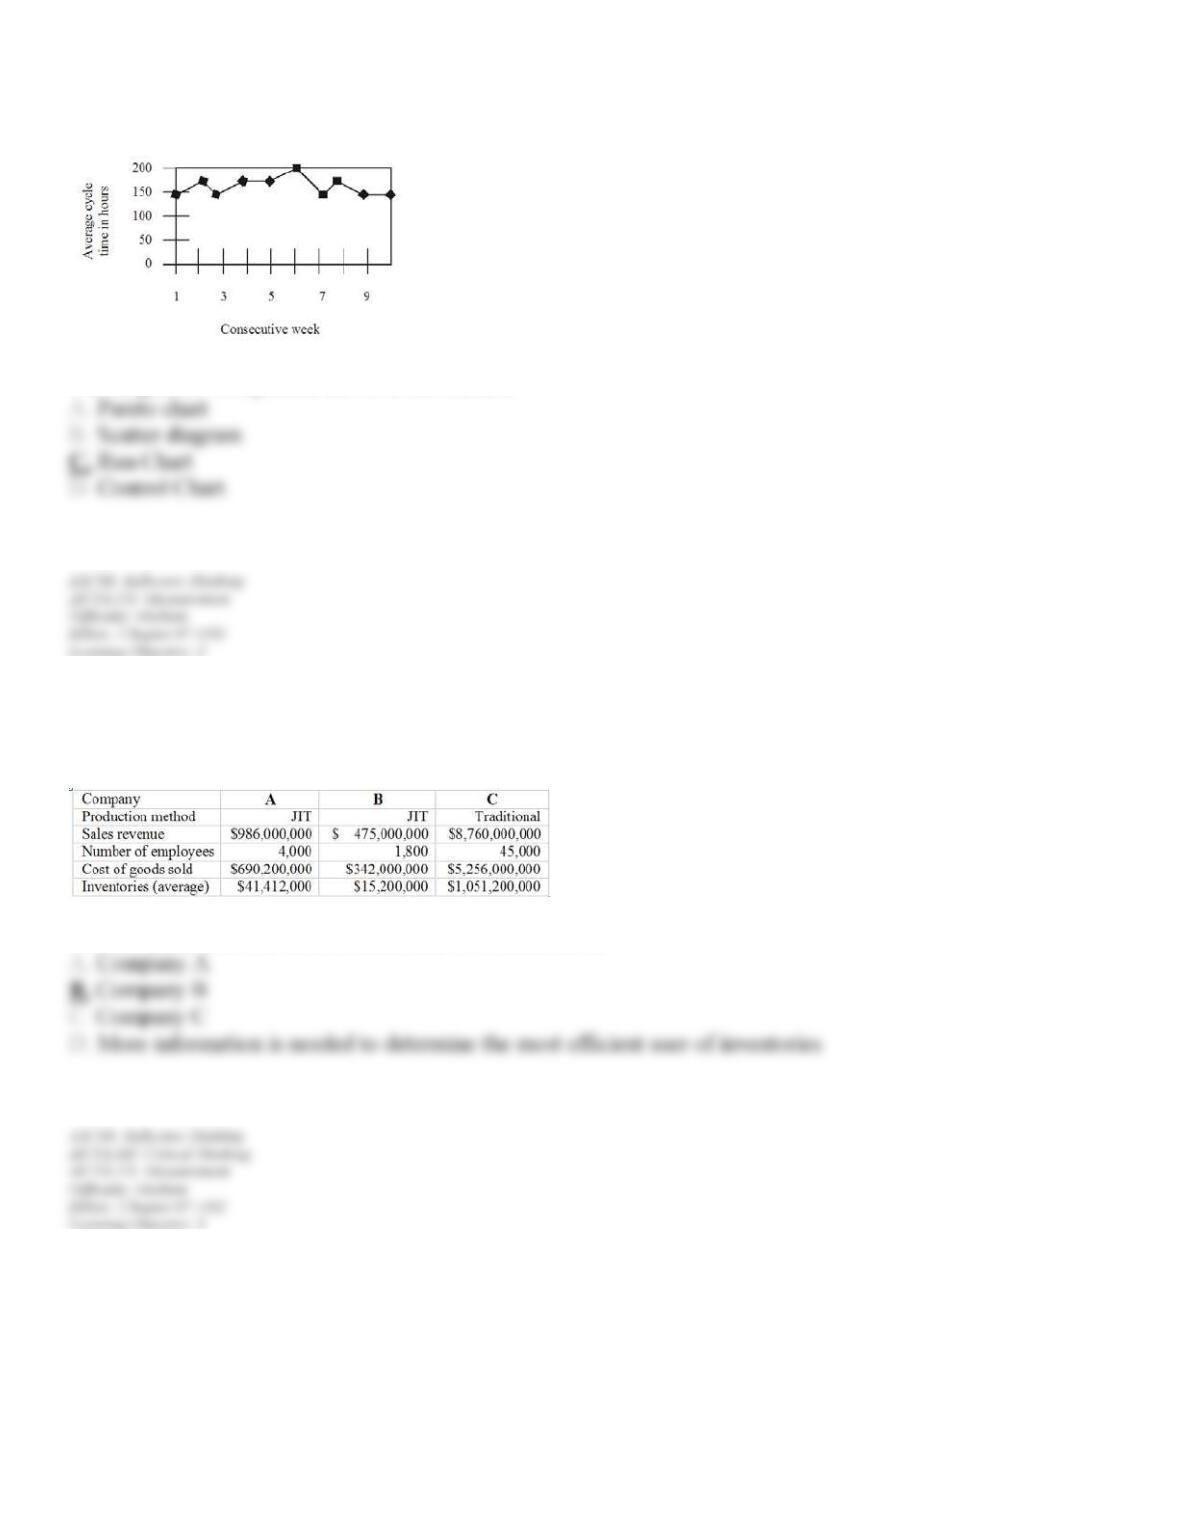
101. The Quality Control Department prepared the following diagnostic tool for the Production at McHugh
Molding Company:
The diagnostic tool present above is known as a:
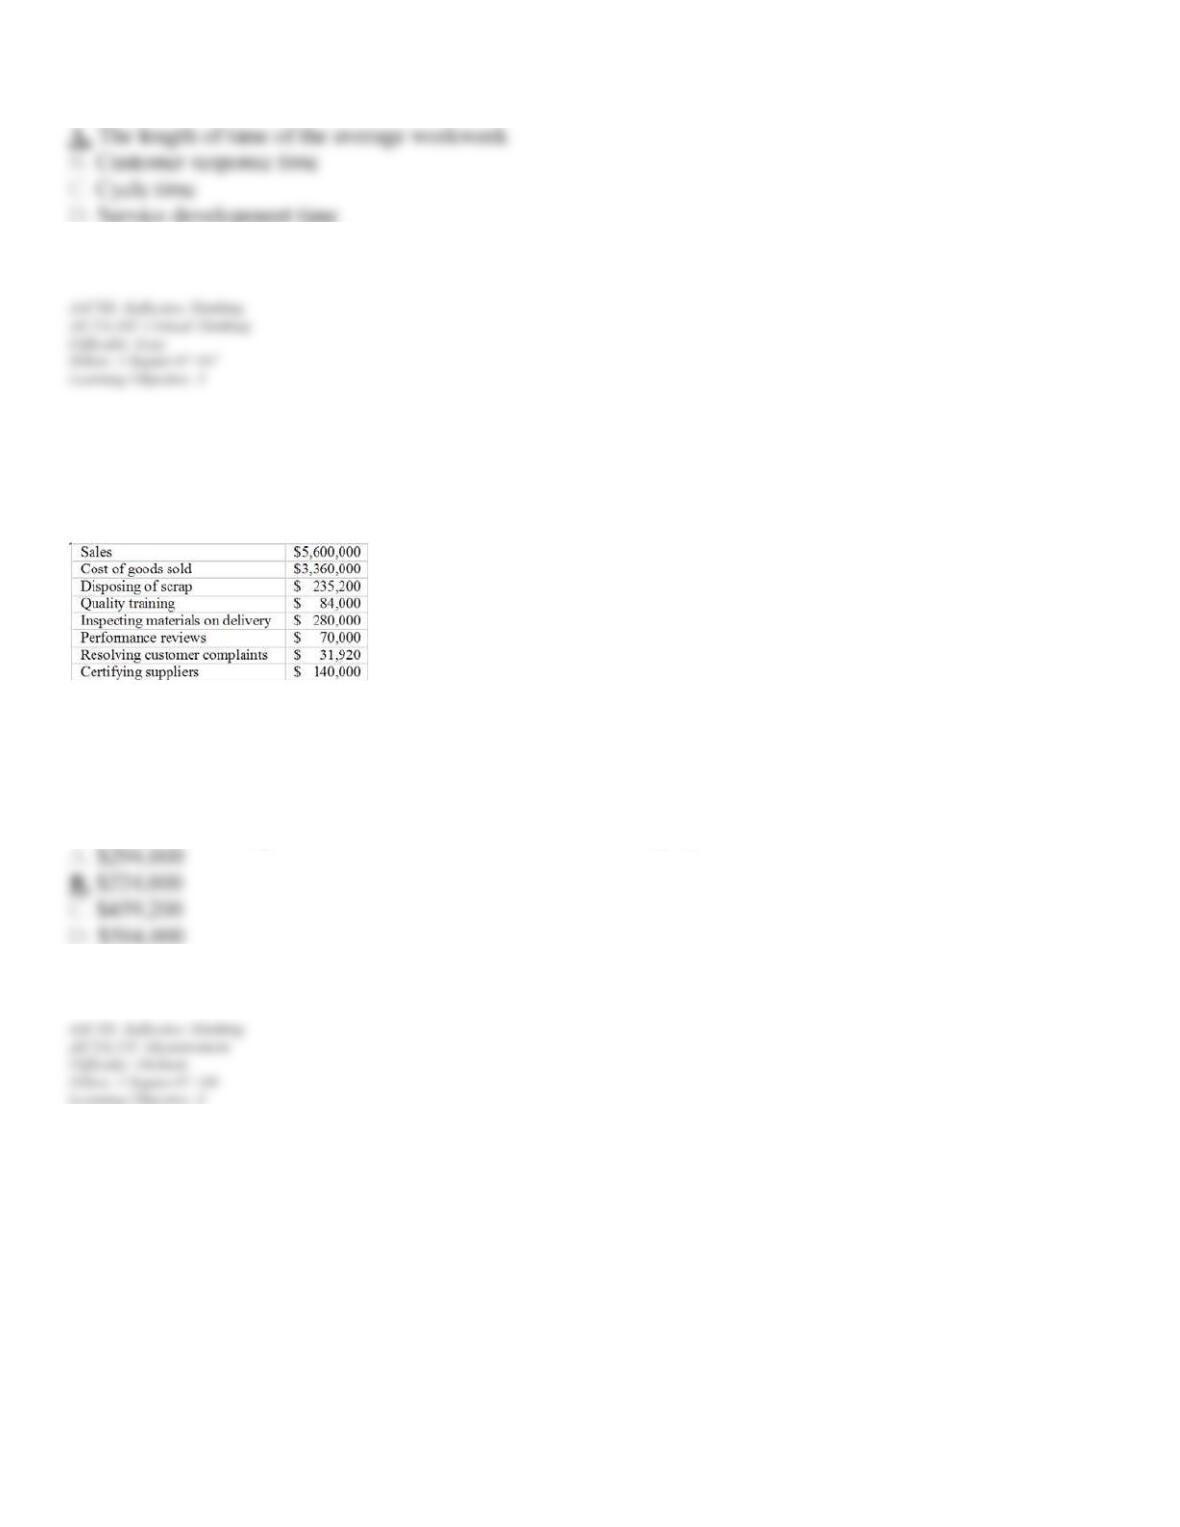
102. Consider the following information related to three manufacturing companies:
The company with the most efficient use of inventories is:
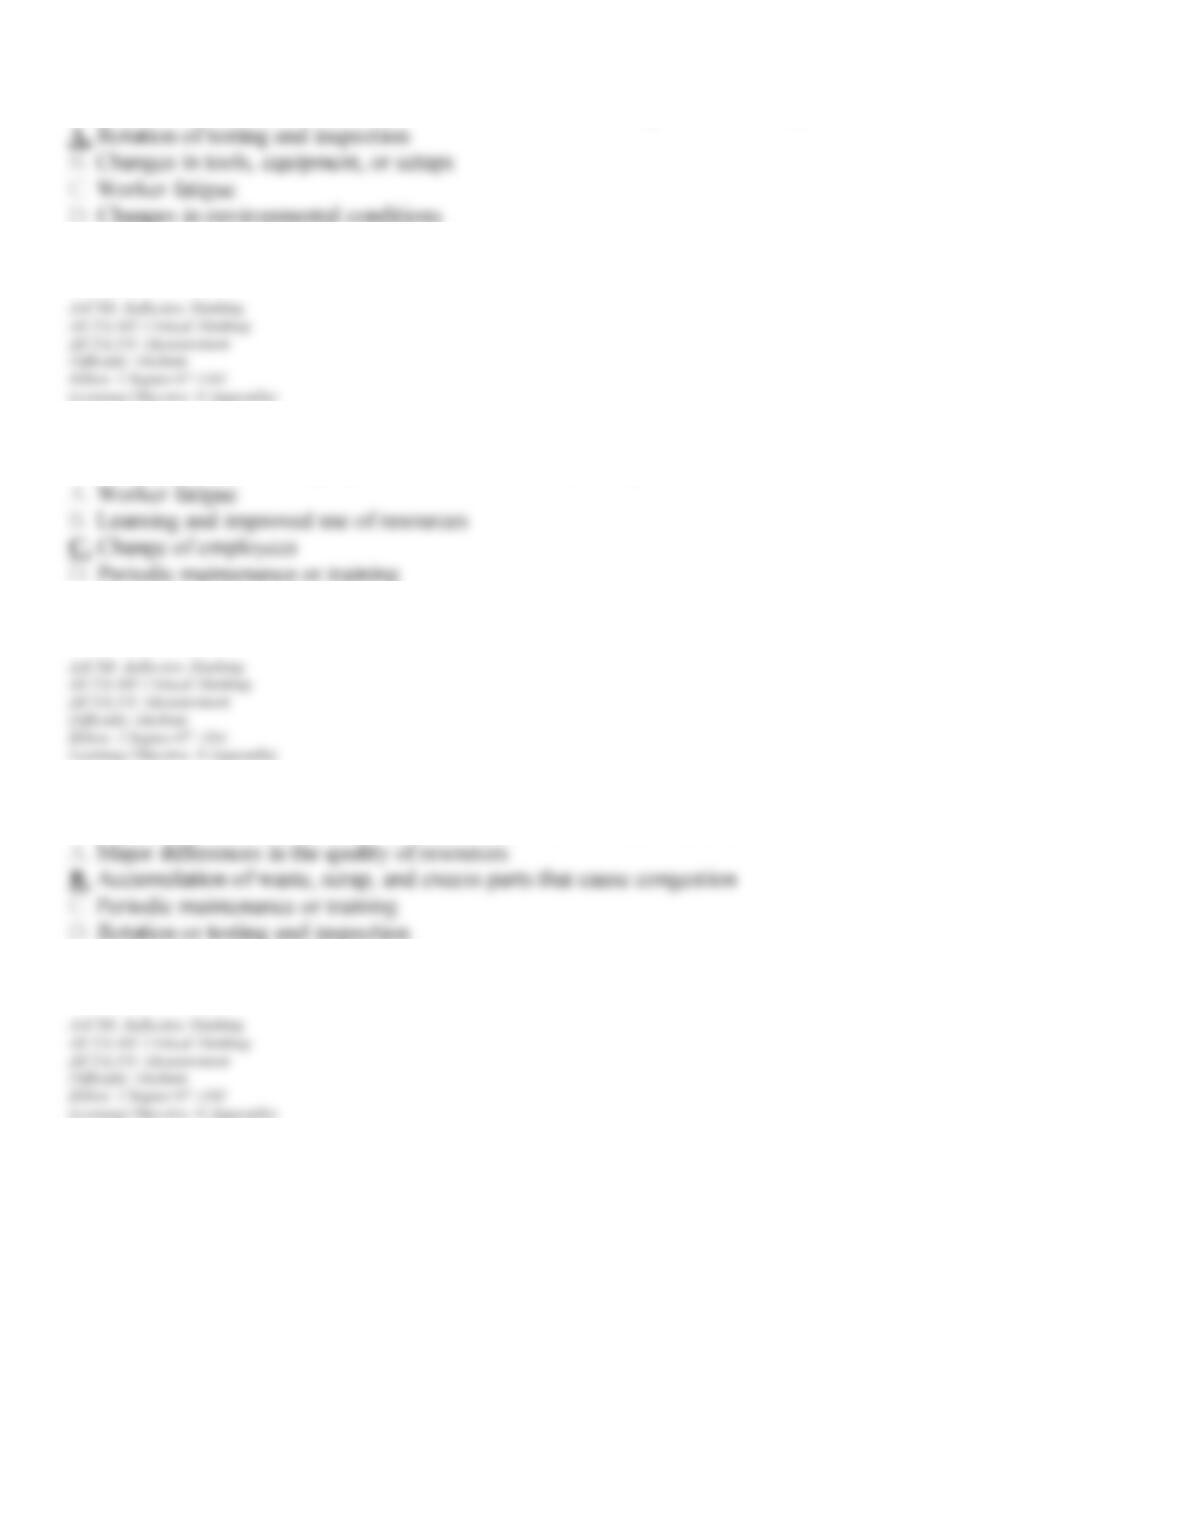
103. Connolly Corporation has prepared a control chart of weekly average customer-response times against the
historical mean and historical variation. Which of the following is a cause of cyclical behavior?
104. A pattern of extreme jumps in behavior can be caused by:
105. In a statistical control chart, the most likely cause of a run would be:
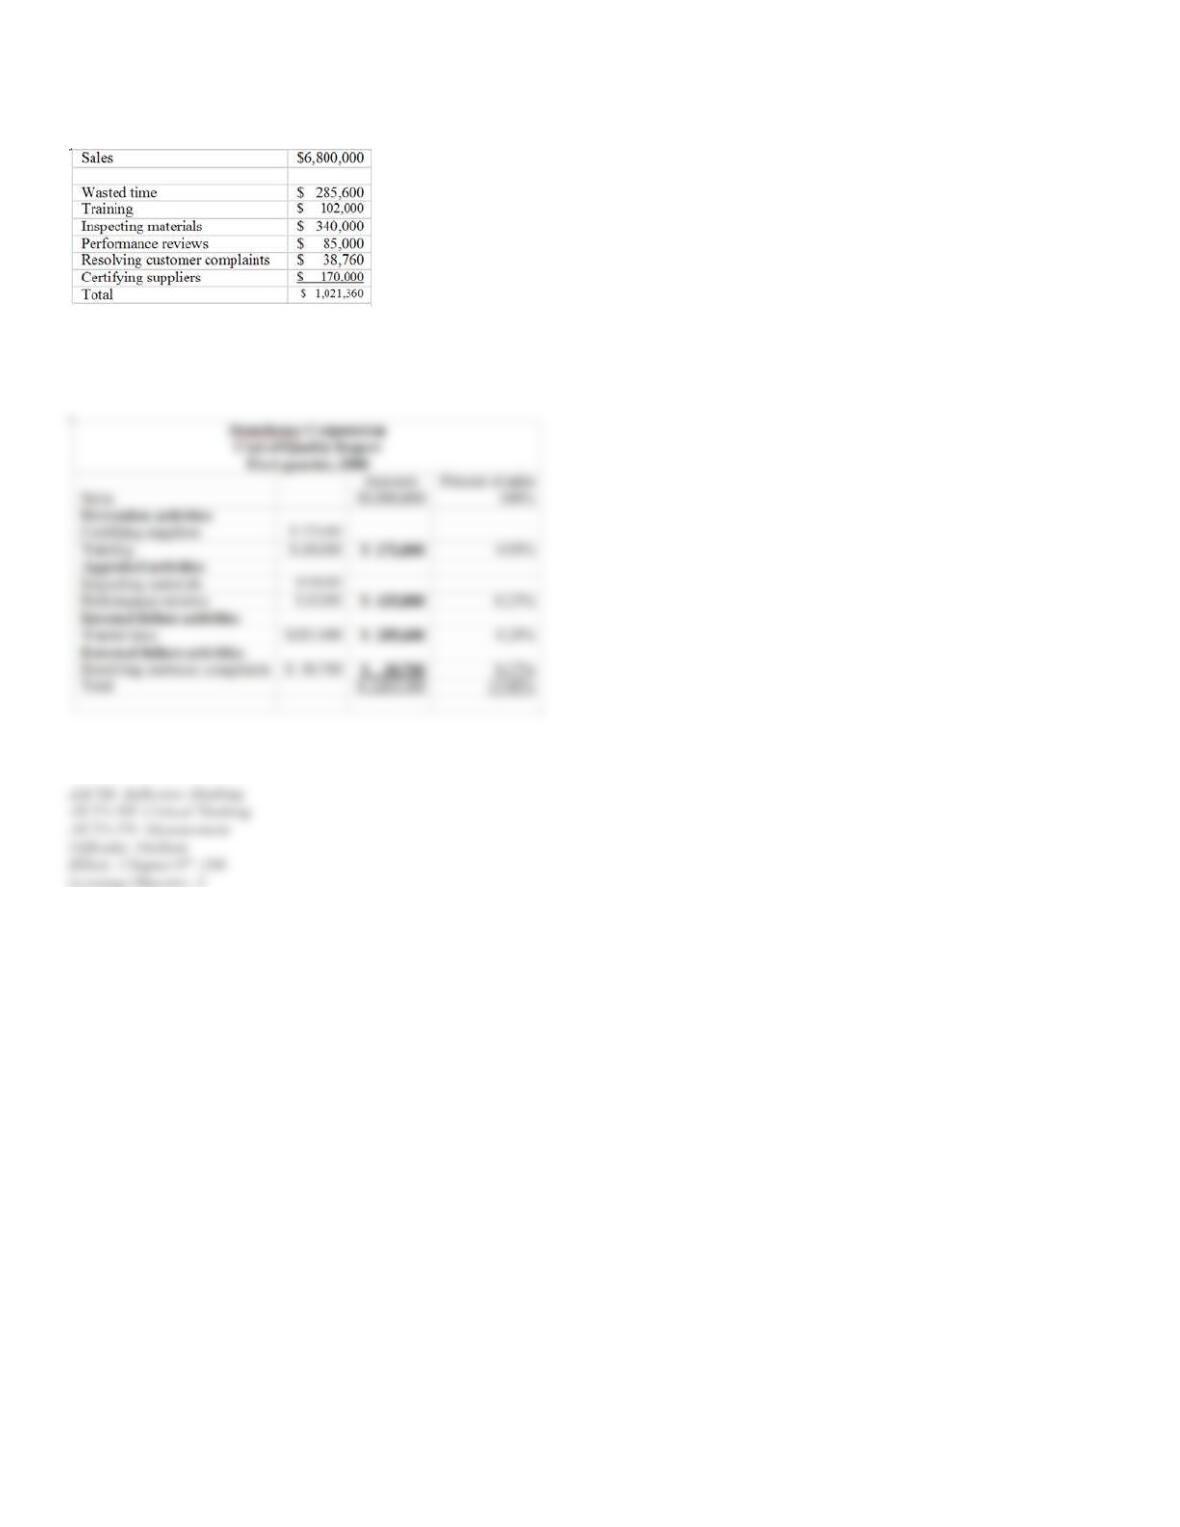
106. Stonehouse Corporation developed the following information regarding quality for the first quarter of the
year 2008:
Required: Prepare a cost of quality report sorting costs by quality activity and expressing in relevant percentage
terms.
107. Match the description of the tool used to assess quality to the appropriate name:
(1) Histogram
(2) Scatter Diagram
(3) Run chart
(4) Control chart
(5) Cause and effect diagram
(6) Flowchart
(7) Pareto chart
(a) Shows a trend in variation in product or service attributes over time by reflecting measures of important
quality features taken at defined points in time.
(b) Describes variation in product or service attributes by measuring important quality features and comparing
to upper and lower limits.
(c) Displays the frequency distribution of an attribute’s measures around an average attribute value.
(d) Formulates diagnostic signals that identify potential causes of product or service defects.
(e) Plot of two measures that may be related.
(f) Prioritizes the causes of problems or defects as bars of varying height, in order of frequency or size.
(g) Reflects cause and effect and sequential linkages among process activities.
108. Identify each of the following as Prevention Activities (P), Appraisal Activities (A), Internal Failure
Activities (I) or External Failure Activities (E)
(1) Inspecting production materials upon delivery
(2) Designing products for manufacturability
(3) Process improvement
(4) Warranty repairs
(5) Lost sales
(6) Inspecting machines
(7) Rework
(8) Delaying processes
(9) Quality training
(10) Certifying suppliers
109. Identify each of the following as Prevention Activities (P), Appraisal Activities (A), Internal Failure
Activities (I) or External Failure Activities (E)
(1) Field Testing
(2) Statistical process control
(3) Sampling at the end of process
(4) Disposing of scrap
(5) Quality evaluations
(6) Retesting
(7) Settling product liability
(8) Resolving customer complaints
(9) Lost sales
(10) Restoring reputation
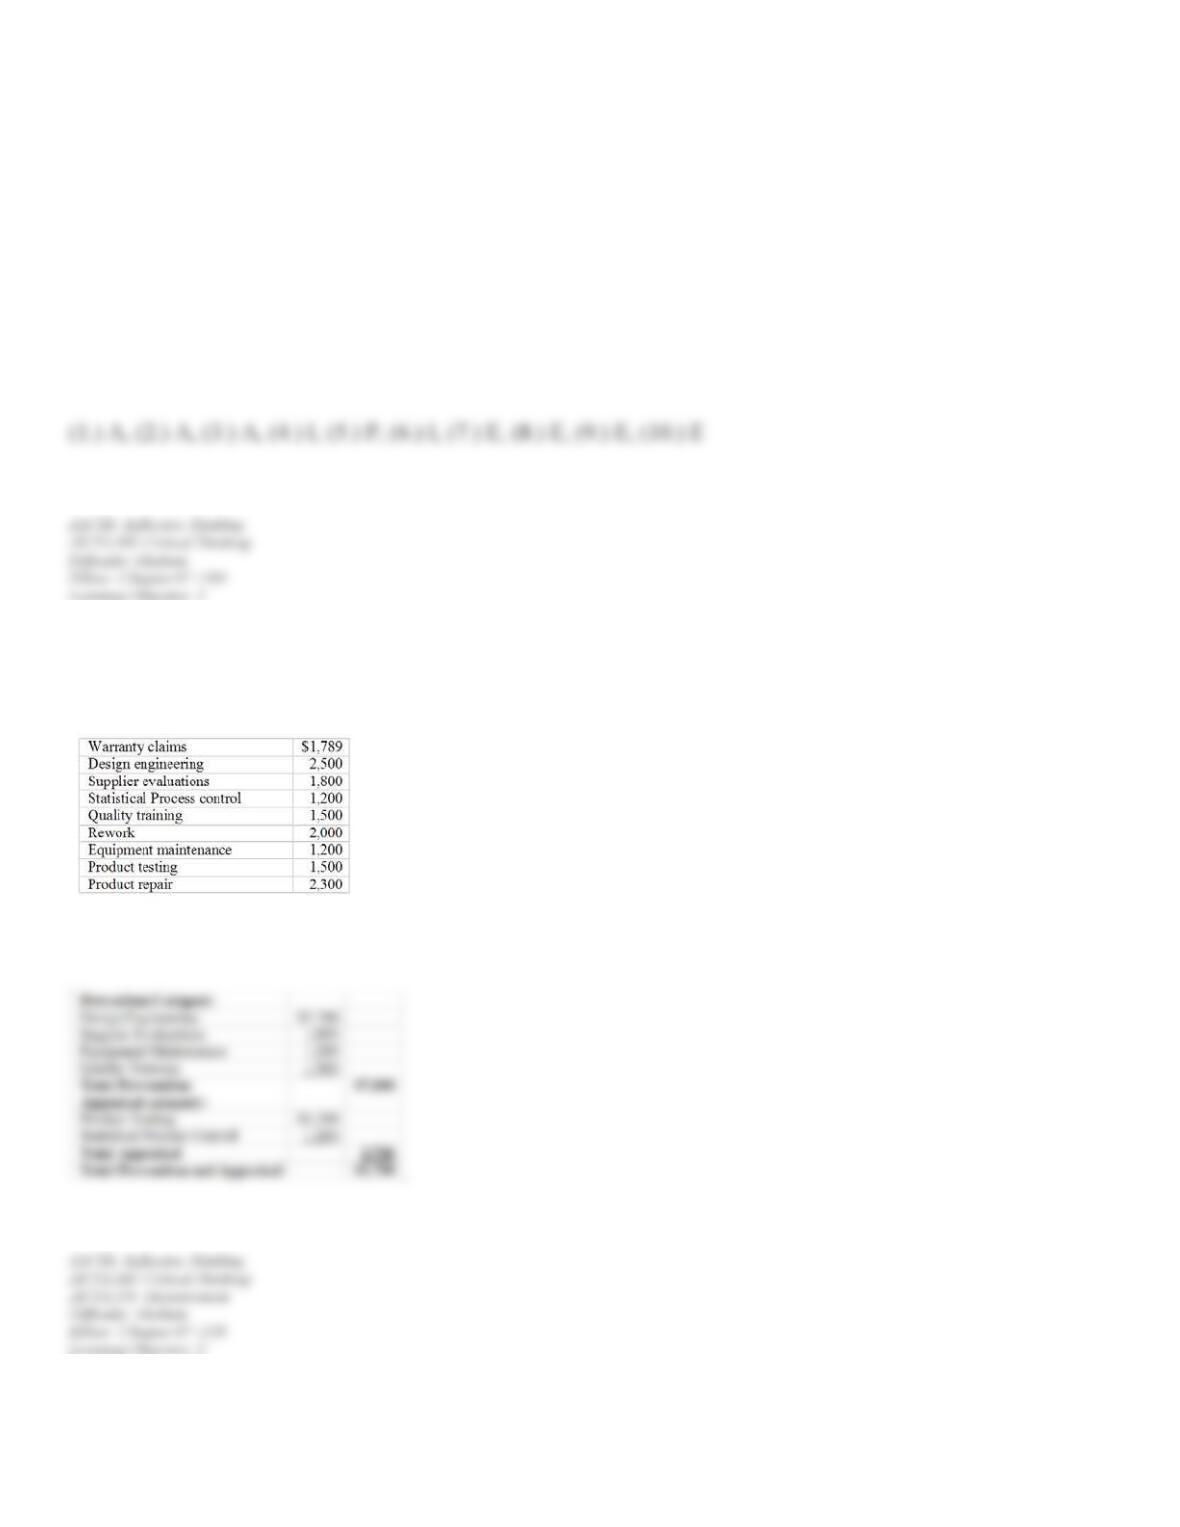
110. Listed below are selected operating costs for Hershey Products last month:
Required: Compute Hershey’s total prevention and appraisal costs for last month.
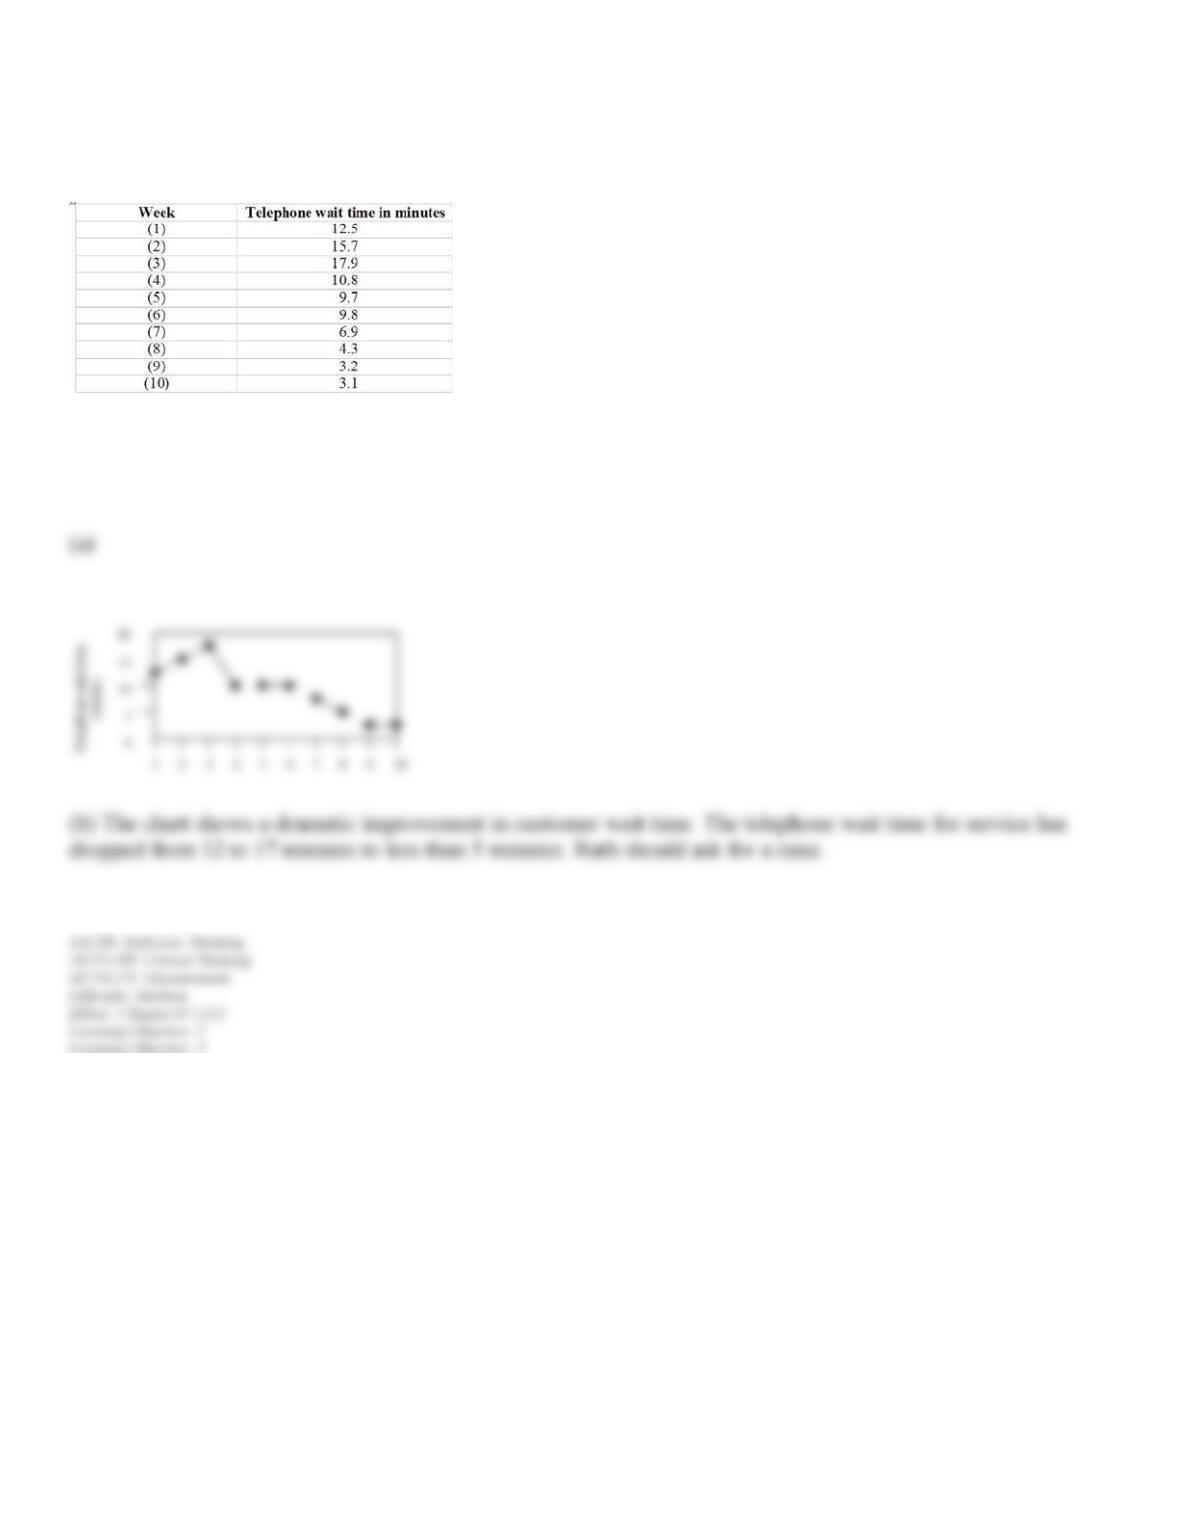
111. Ruth Farrar has been hired as the new customer service manager at Dover Automotive. Ruth has recently
instituted certain new policies and training procedures to improve customer telephone service. The following
data have been gathered for the most recent 10-week period:
Required:
a) Prepare a run chart of the most recent 10-week period.
b) What does this chart indicate?
112. For each of the following products or services, indicate the most important customer quality attributes and
the most important customer quality tradeoffs.
(a) Personal computer
(b) Legal representation in divorce court
(c) New home purchase
(d) Meals in a fast food restaurant
(e) Airline travel
(f) Prom dress
(g) Cruise ship vacation
(h) Auto repair