1456 Supply, Demand, and Government Policies
105. Refer to Figure 6-6. In which of the following cases would sellers have to develop a rationing
mechanism?
a. a price ceiling set at $8
b. a price ceiling set at $6
c. a price floor set at $8
d. a price floor set at $6
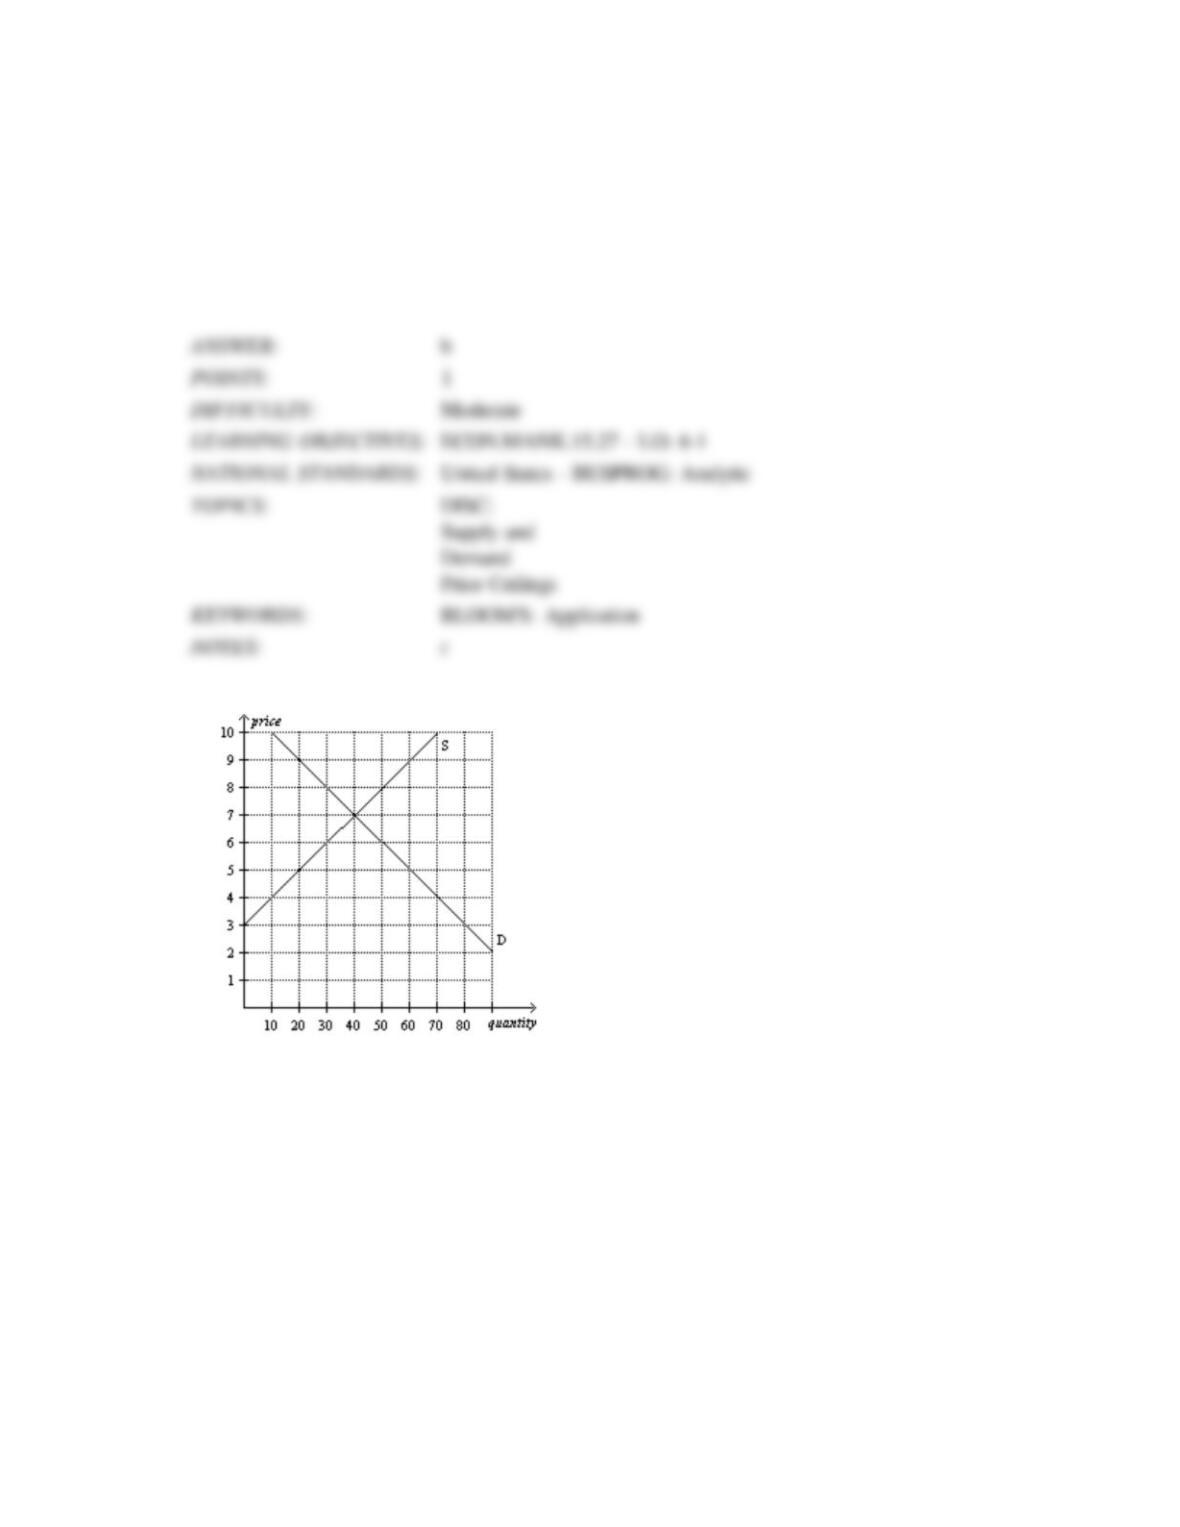
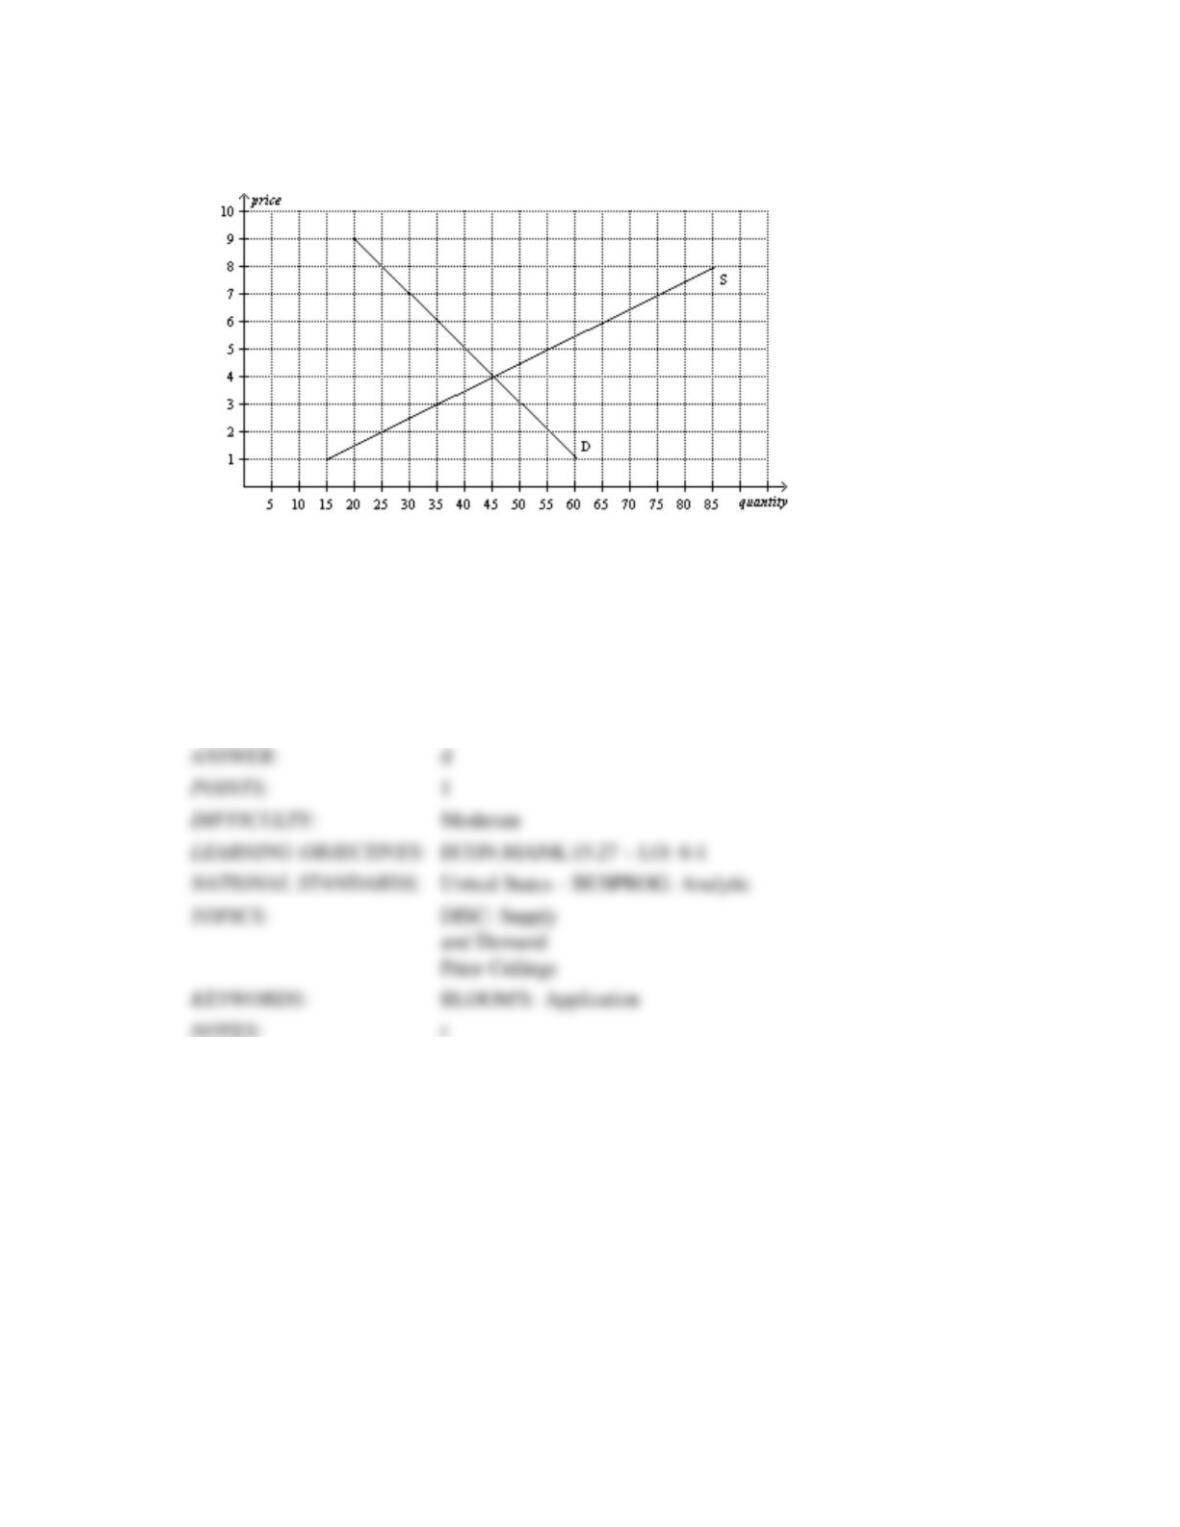
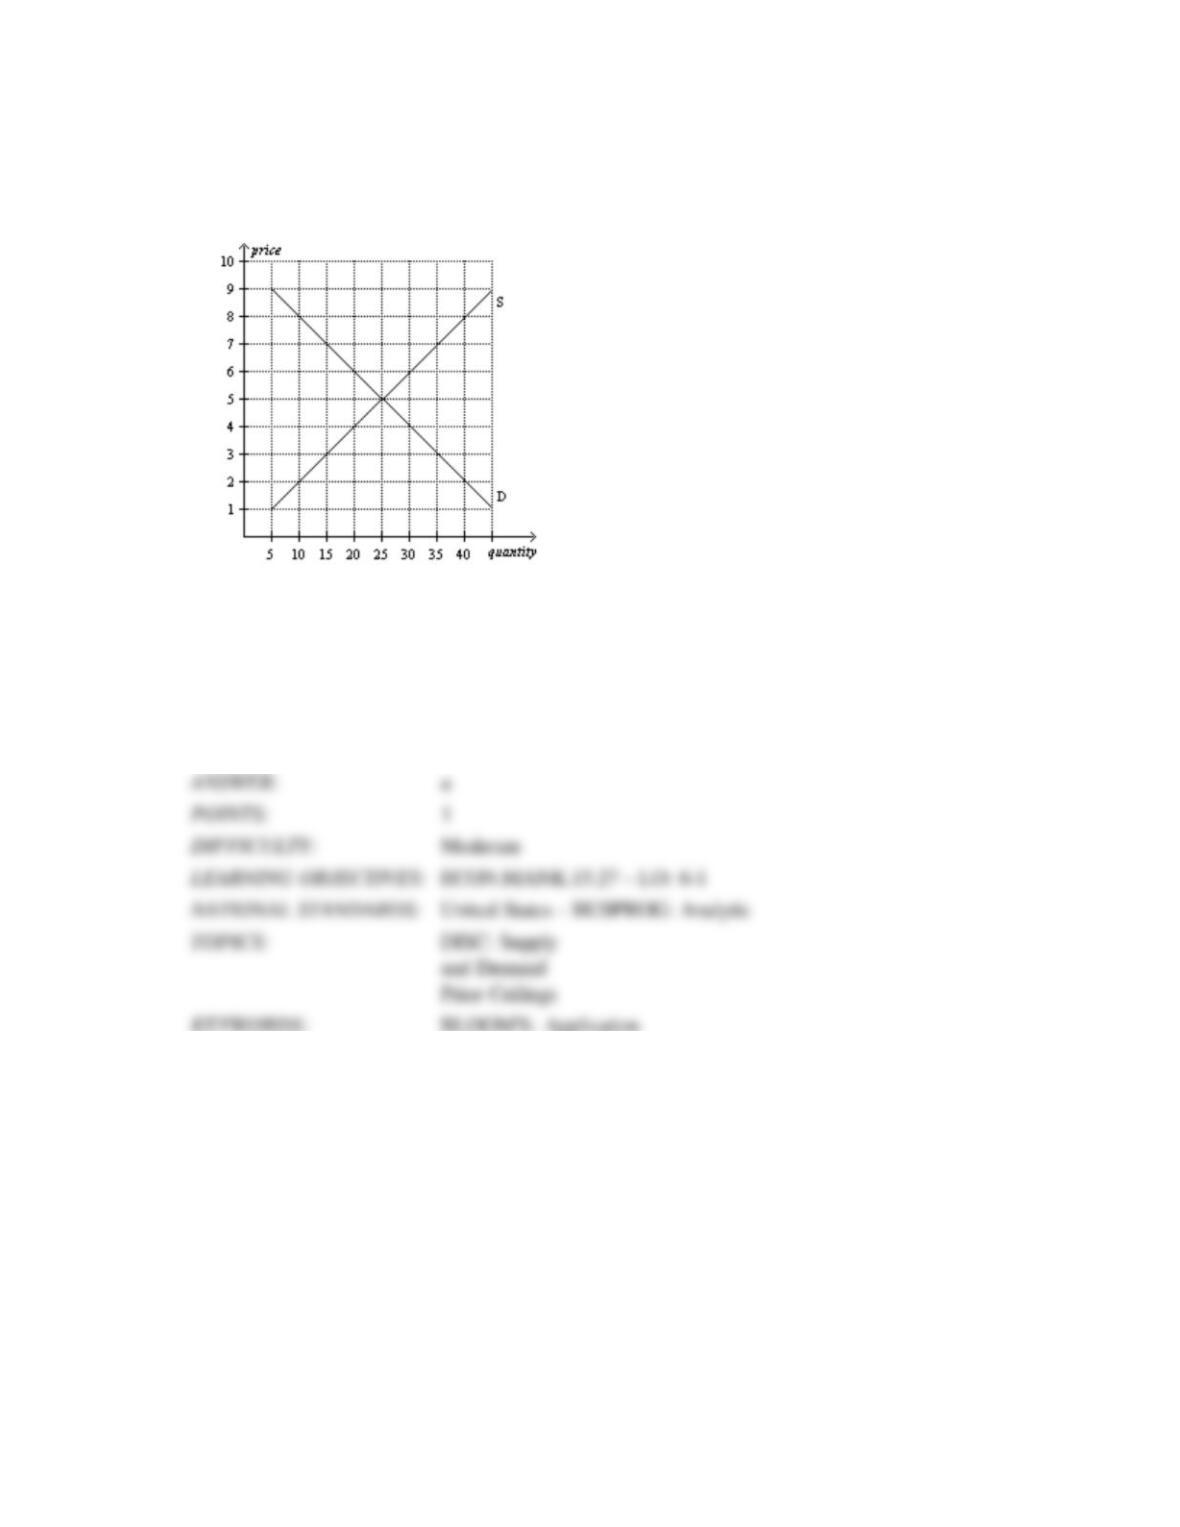
Figure 6-7
Supply, Demand, and Government Policies 1457
106. Refer to Figure 6-7. For a price ceiling to be binding in this market, it would have to be set at
a. any price below $7.
b. any price above $3.
c. any price below $9.
d. any price above $7.
107. Refer to Figure 6-7. For a price floor to be binding in this market, it would have to be set at
a. any price below $7.
b. any price below $3.
c. any price below $9.
d. any price above $7.
1458 Supply, Demand, and Government Policies
108. Refer to Figure 6-7. Which of the following price controls would cause a shortage of 20 units
of the good?
a. a price ceiling set at $6
b. a price ceiling set at $5
c. a price floor set at $9
d. a price floor set at $8
109. Refer to Figure 6-7. Which of the following price controls would cause a surplus of 20 units of
the good?
a. a price ceiling set at $6
b. a price ceiling set at $5
c. a price floor set at $9
d. a price floor set at $8
Supply, Demand, and Government Policies 1459
110. Refer to Figure 6-7. Suppose a price ceiling of $5 is imposed on this market. As a result,
a. the quantity of the good supplied decreases by 20 units.
b. the demand curve shifts to the left; quantity sold is now 30 units and the price is $5.
c. buyers’ total expenditure on the good decreases by $80.
d. the price of the good continues to serve as the rationing mechanism.
111. Refer to Figure 6-7. Suppose a price floor of $8 is imposed on this market. As a result,
a. buyers’ total expenditure on the good decreases by $20.
b. the supply curve shifts to the left; quantity sold is now 30 units and the price is $8.
c. the quantity of the good demanded decreases by 10 units.
d. the price of the good continues to serve as the rationing mechanism.
1460 Supply, Demand, and Government Policies
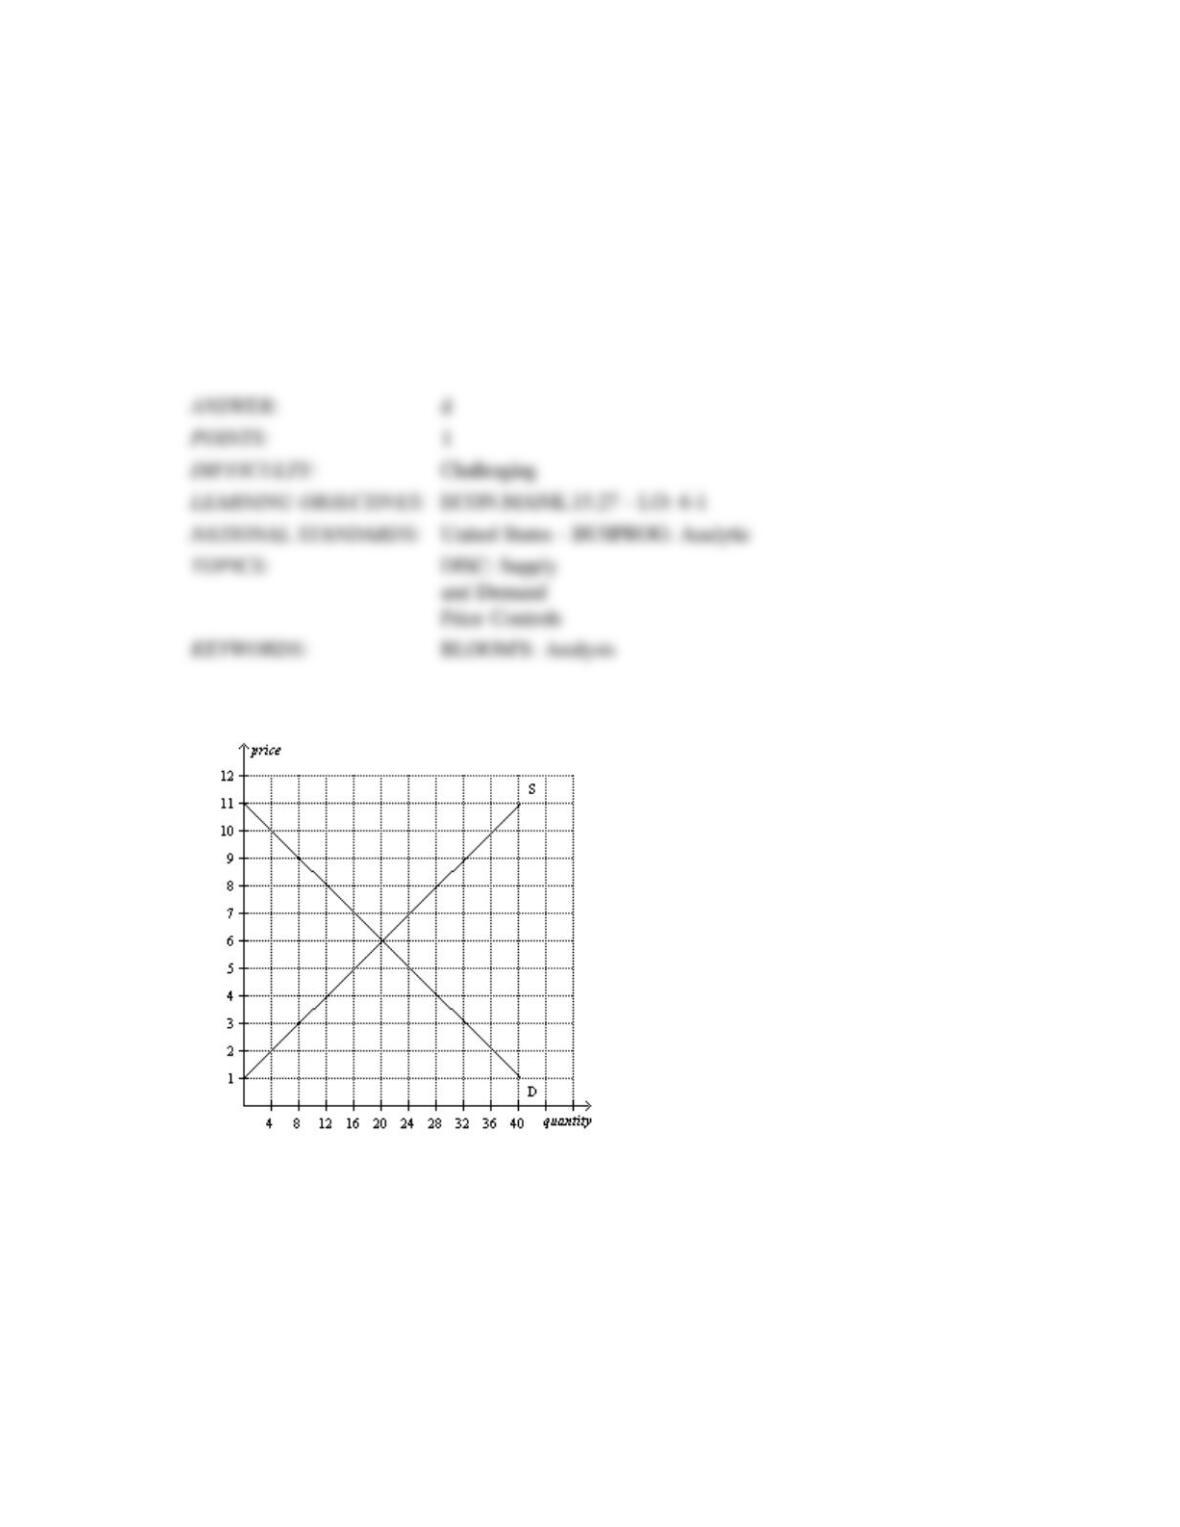
Figure 6-8
112. Refer to Figure 6-8. If the government imposes a price ceiling of $2 on this market, then there
will be
a. no shortage of the good.
b. a shortage of 10 units of the good.
c. a shortage of 20 units of the good.
d. a shortage of 30 units of the good.
Supply, Demand, and Government Policies 1461
113. Refer to Figure 6-8. If the government imposes a price floor of $5 on this market, then there
will be
a. no surplus of the good.
b. a surplus of 5 units of the good.
c. a surplus of 10 units of the good.
d. a surplus of 15 units of the good.
114. Refer to Figure 6-8. The price of the good would continue to serve as the rationing mechanism
if
a. a price ceiling of $3 is imposed.
b. a price ceiling of $5 is imposed.
c. a price floor of $5 is imposed.
d. All of the above are correct.
1462 Supply, Demand, and Government Policies
115. Refer to Figure 6-8. When a certain price control is imposed on this market, the resulting
quantity of the good that is actually bought and sold is such that buyers are willing and able to
pay a maximum of P1 dollars per unit for that quantity and sellers are willing and able to accept
a minimum of P2 dollars per unit for that quantity. If P1 – P2 = $3, then the price control is
a. a price ceiling of $2.00.
b. a price ceiling of $5.00.
c. a price floor of $5.00.
d. either a price ceiling of $2.00 or a price floor of $5.00.
Figure 6-9
Supply, Demand, and Government Policies 1463
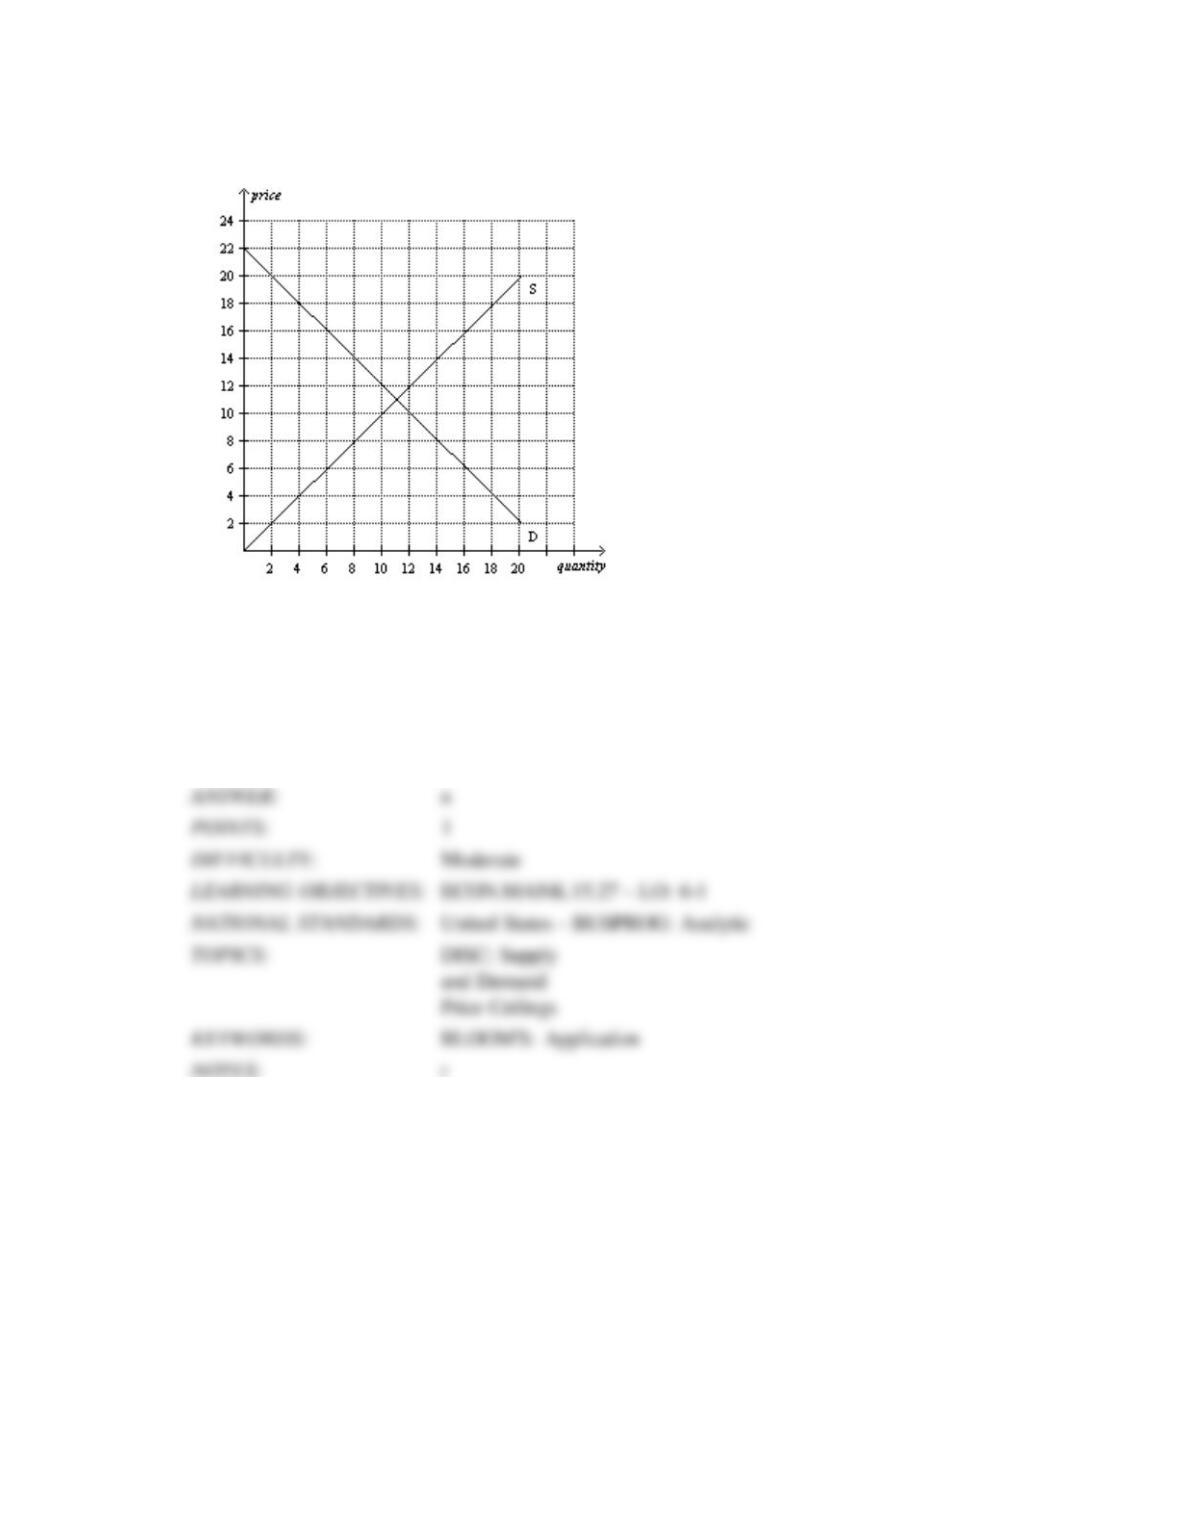
116. Refer to Figure 6-9. A price ceiling set at
a. $4 will be binding and will result in a shortage of 8 units.
b. $4 will be binding and will result in a shortage of 16 units.
c. $7 will be binding and will result in a surplus of 4 units.
d. $7 will be binding and will result in a surplus of 8 units.
117. Refer to Figure 6-9. At which price would a price ceiling be binding?
a. $8
b. $5
c. $6
d. $7
1464 Supply, Demand, and Government Policies
118. Refer to Figure 6-9. At which price would a price ceiling be nonbinding?
a. $4
b. $5
c. $3
d. $7
119. Refer to Figure 6-9. A price floor set at
a. $4 will be binding and will result in a shortage of 8 units.
b. $4 will be binding and will result in a shortage of 16 units.
c. $7 will be binding and will result in a surplus of 4 units.
d. $7 will be binding and will result in a surplus of 8 units.
Supply, Demand, and Government Policies 1465
120. Refer to Figure 6-9. At which price would a price floor be binding?
a. $7
b. $6
c. $4
d. $5
121. Refer to Figure 6-9. At which price would a price floor be nonbinding?
a. $8
b. $7
c. $6
d. $9
1466 Supply, Demand, and Government Policies
Figure 6-10
122. Refer to Figure 6-10. A price ceiling set at
a. $6 will be binding and will result in a shortage of 10 units.
b. $6 will be binding and will result in a shortage of 6 units.
c. $16 will be binding and will result in a shortage of 10 units.
d. $16 will be binding and will result in a shortage of 4 units.
Supply, Demand, and Government Policies 1467
123. Refer to Figure 6-10. A price floor set at
a. $6 will be binding and will result in a surplus of 10 units.
b. $6 will be binding and will result in a surplus of 6 units.
c. $16 will be binding and will result in a surplus of 10 units.
d. $16 will be binding and will result in a surplus of 4 units.
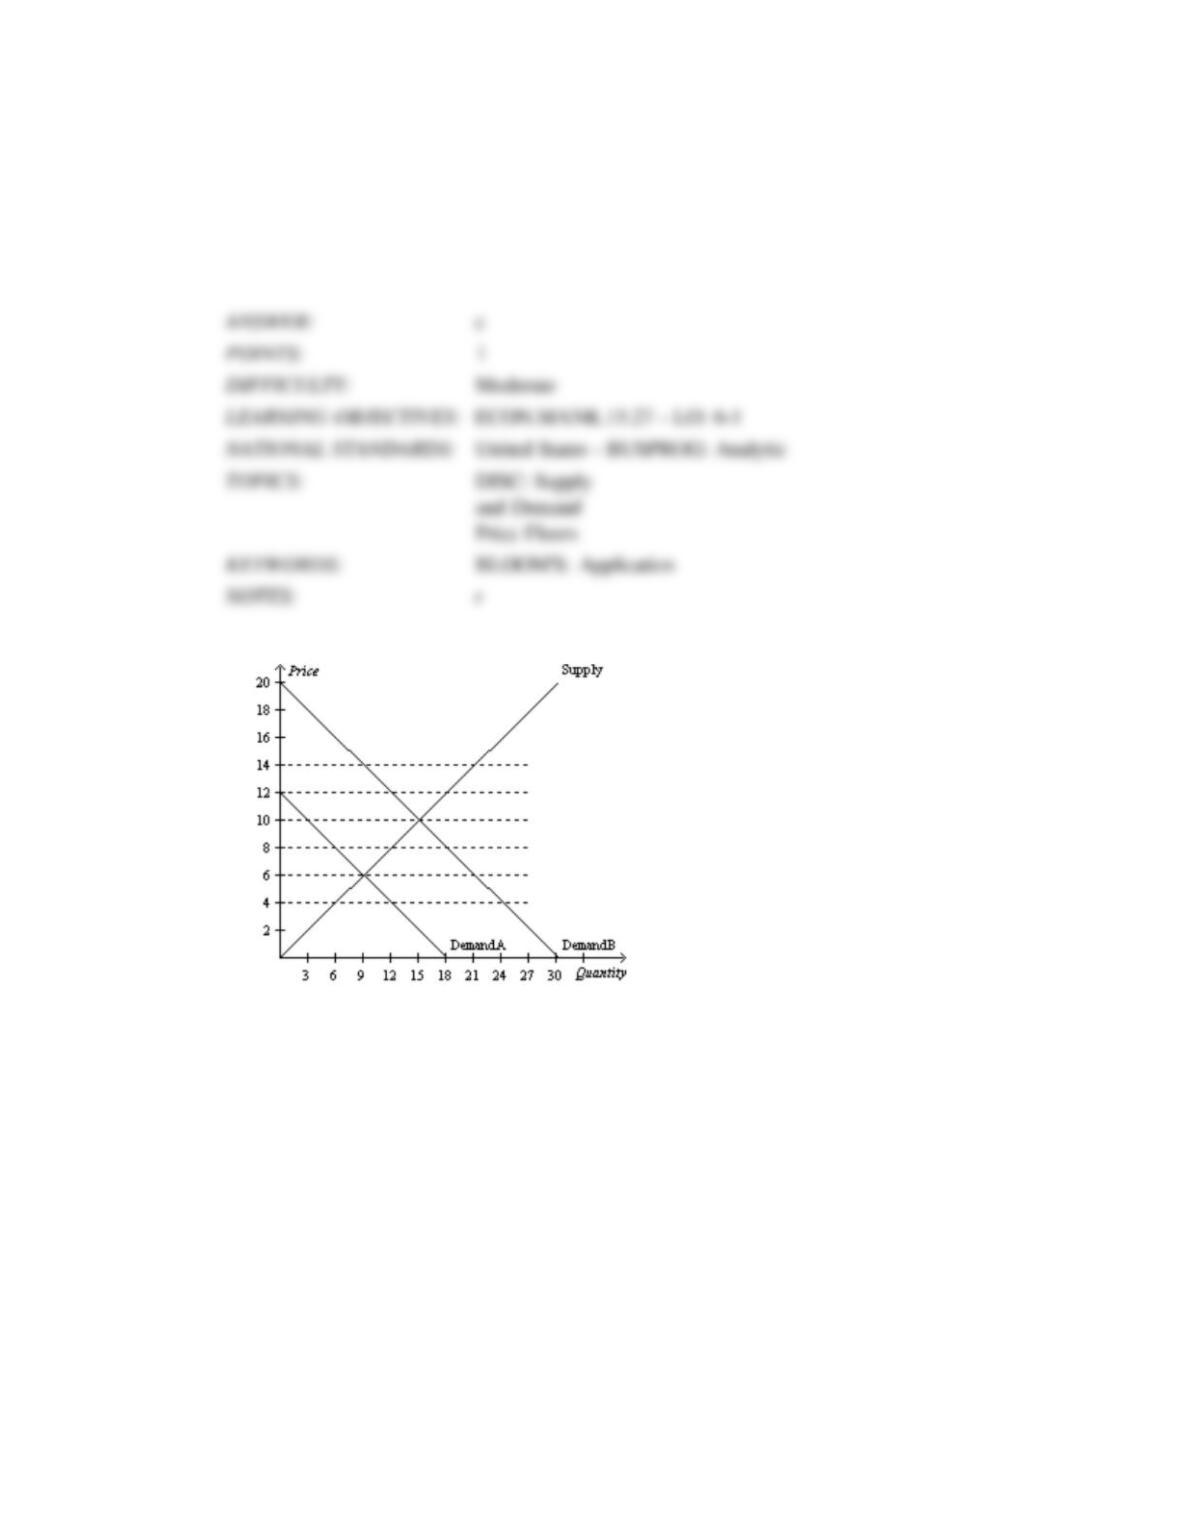
Figure 6-11
1468 Supply, Demand, and Government Policies
124. Refer to Figure 6-11. If the government imposes a price ceiling at $6, it would be
a. binding if market demand is Demand A or Demand B.
b. non-binding if market demand is Demand A or Demand B.
c. binding if market demand is Demand A and non–binding if market demand is Demand B.
d. non-binding if market demand is Demand A and binding if market demand is Demand B.
125. Refer to Figure 6-11. If the government imposes a price floor at $10, it would be
a. binding if market demand is Demand A or Demand B.
b. non-binding if market demand is Demand A or Demand B.
c. binding if market demand is Demand A and non–binding if market demand is Demand B.
d. non-binding if market demand is Demand A and binding if market demand is Demand B.
Supply, Demand, and Government Policies 1469
126. Refer to Figure 6-11. Which of the following statements is not correct?
a. A government-imposed price of $8 would be a binding price floor if market demand is
Demand A and a binding price ceiling if market demand is Demand B.
b. A government-imposed price of $10 would be a binding price ceiling if market demand is
either Demand A or Demand B.
c. A government-imposed price of $4 would be a binding price ceiling if market demand is
either Demand A or Demand B.
d. A government-imposed price of $10 would be a binding price floor if market demand is
Demand A and a non–binding price ceiling if market demand is Demand B.
1470 Supply, Demand, and Government Policies
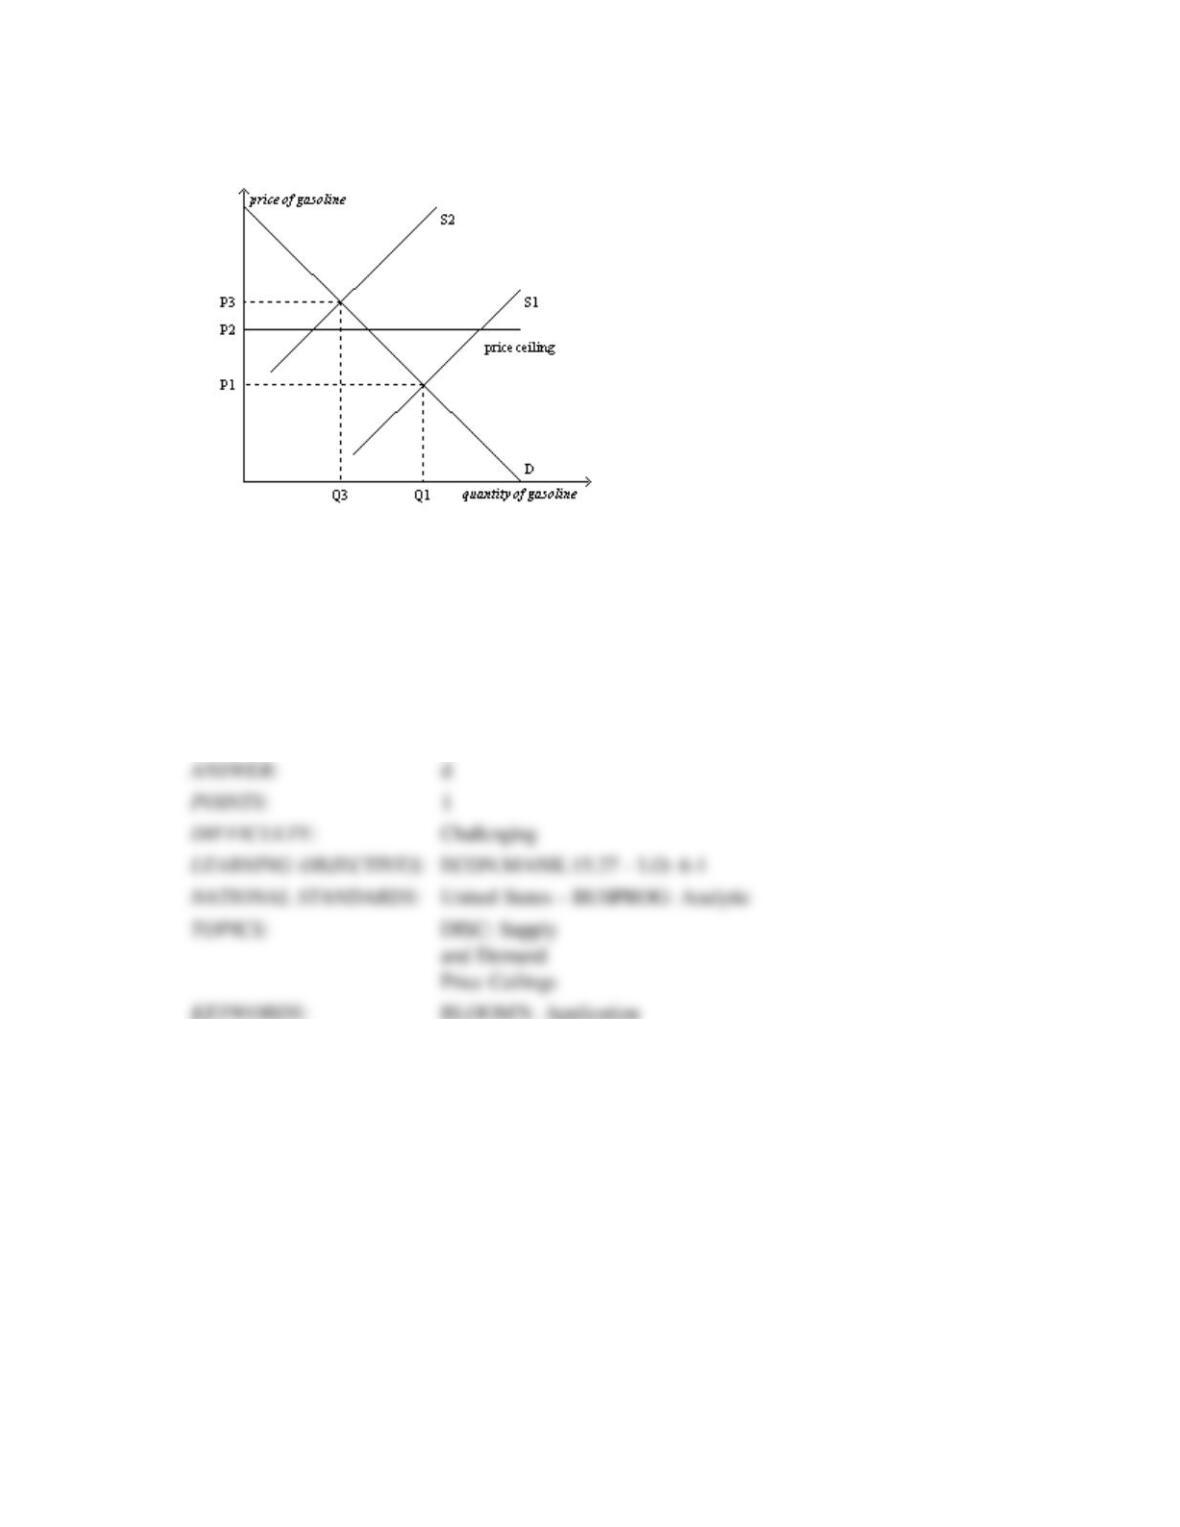
Figure 6-12
127. Refer to Figure 6-12. When the price ceiling applies in this market and the supply curve for
gasoline shifts from S1 to S2,
a. the market price will increase to P3.
b. a surplus will occur at the new market price of P2.
c. the market price will stay at P1.
d. a shortage will occur at the new market price of P2.
Supply, Demand, and Government Policies 1471
128. Refer to Figure 6-12. When the price ceiling applies in this market, and the supply curve for
gasoline shifts from S1 to S2, the resulting quantity of gasoline that is bought and sold is
a. less than Q3.
b. Q3.
c. between Q1 and Q3.
d. at least Q1.
129. Refer to Figure 6-12. Which of the following statements best relates the figure to the events
that occurred in the United States in the 1970s?
a. Buyers of gasoline paid a price of P1 before 1973; they paid a price of P2 after OPEC
increased the price of crude oil in 1973, and there was a shortage of gasoline at that
price.
b. Buyers of gasoline paid a price of P1 before 1973; they paid a price of P3 after OPEC
increased the price of crude oil in 1973, and there was a shortage of gasoline at that
price.
c. Buyers of gasoline paid a price of P2 before 1973; they paid a price of P3 after OPEC
increased the price of crude oil in 1973, with no shortage of gasoline at that price.
d. The price ceiling was binding before 1973; the price ceiling was no longer binding after
OPEC increased the price of crude oil in 1973.
1472 Supply, Demand, and Government Policies
Figure 6-13
This figure shows the market demand and market supply curves for good X.
130. Refer to Figure 6-13. Which of the following price ceilings would be binding in this market?
a. $4
b. $5
c. $6
d. $7
Supply, Demand, and Government Policies 1473
131. Refer to Figure 6-13. Which of the following price floors would be binding in this market?
a. $3
b. $4
c. $5
d. $6
132. Refer to Figure 6-13. Which of the following statements is correct?
a. A price ceiling set at $6 would be binding, but a price ceiling set at $4 would not be binding.
b. A price floor set at $4 would be binding, but a price ceiling set at $4 would not be binding.
c. A price ceiling set at $3.50 would result in a surplus.
d. A price floor set at $6.50 would result in a surplus.
1474 Supply, Demand, and Government Policies
133. Refer to Figure 6-13. Which of the following statements is not correct?
a. A price ceiling set at $4 would be binding, but a price ceiling set at $6 would not be binding.
b. A price floor set at $7 would be binding, but a price floor set at $4 would not be binding.
c. A price ceiling set at $3.50 would result in a surplus.
d. A price floor set at $6.50 would result in a surplus.
134. Refer to Figure 6-13. If the government imposes a price ceiling of $4 on this market, then
there will be
a. no shortage.
b. a shortage of 5 units.
c. a shortage of 10 units.
d. a shortage of 20 units.
Supply, Demand, and Government Policies 1475
135. Refer to Figure 6-13. If the government imposes a price ceiling of $6 on this market, then
there will be
a. no shortage.
b. a shortage of 5 units.
c. a shortage of 10 units.
d. a shortage of 20 units.
136. Refer to Figure 6-13. If the government imposes a price floor of $3 on this market, then there
will be
a. no surplus.
b. a surplus of 10 units.
c. a surplus of 15 units.
d. a surplus of 20 units.