Stewart – Calculus 8e ET Chapter 6 Form A
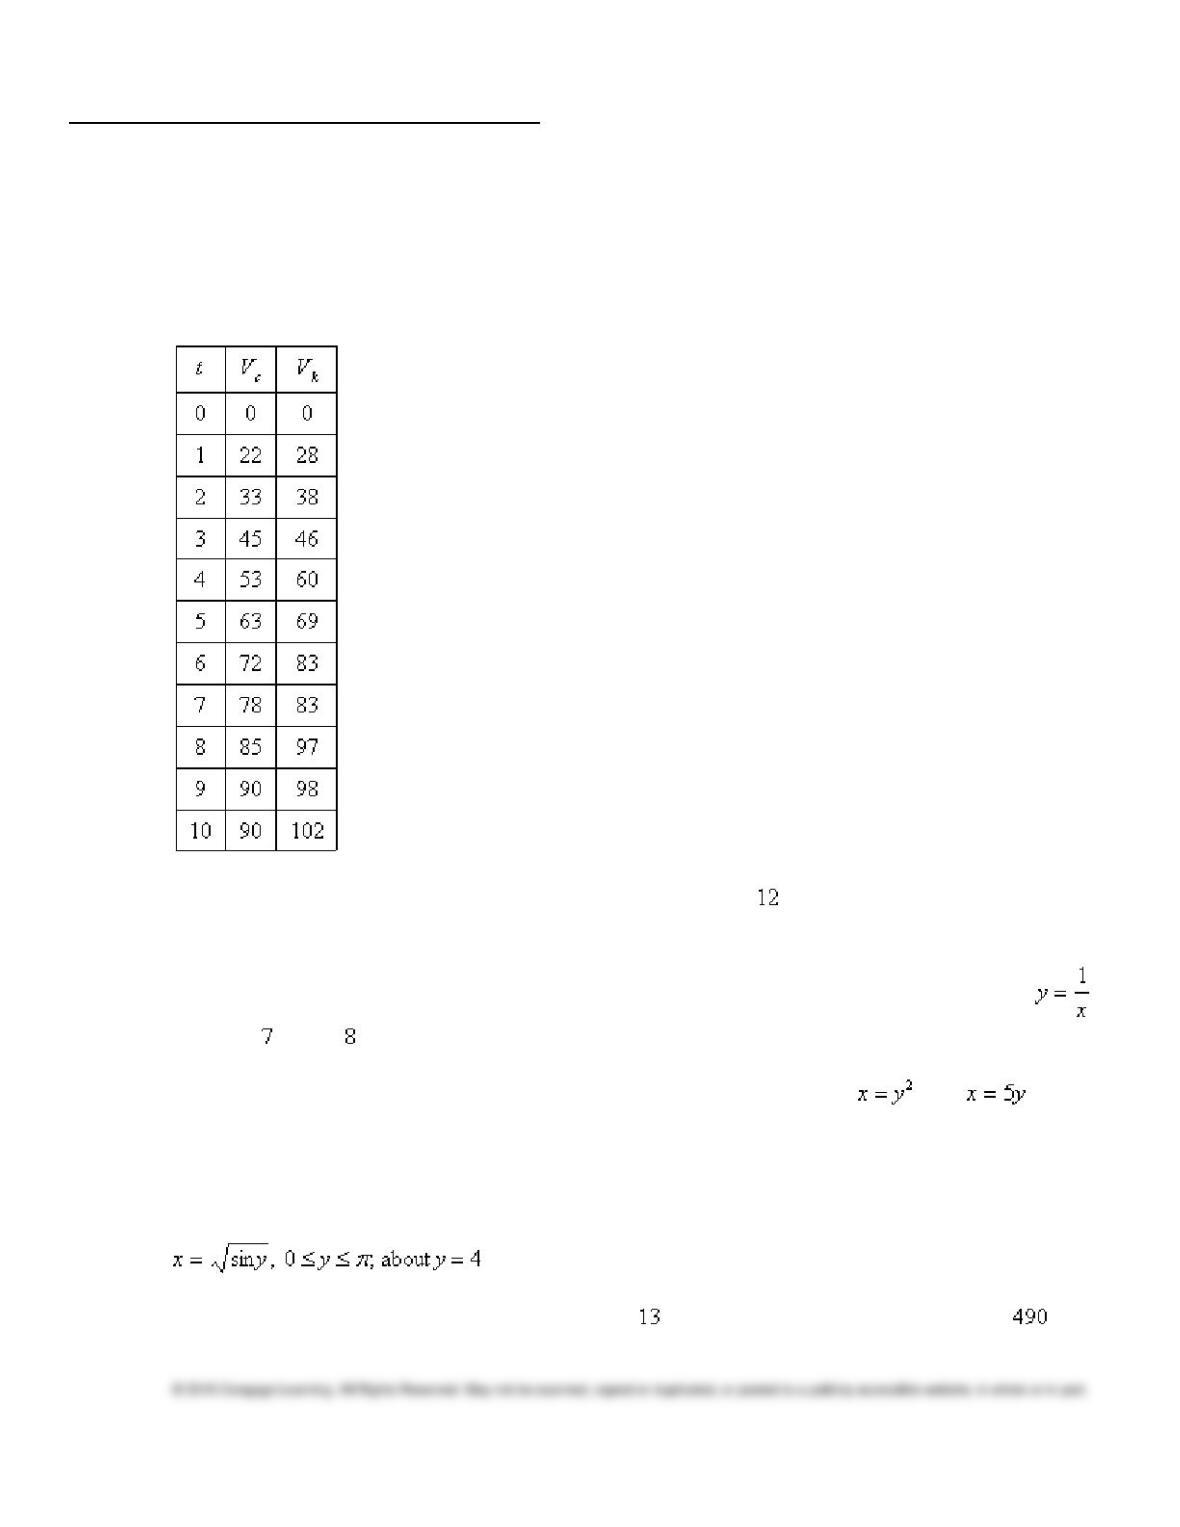
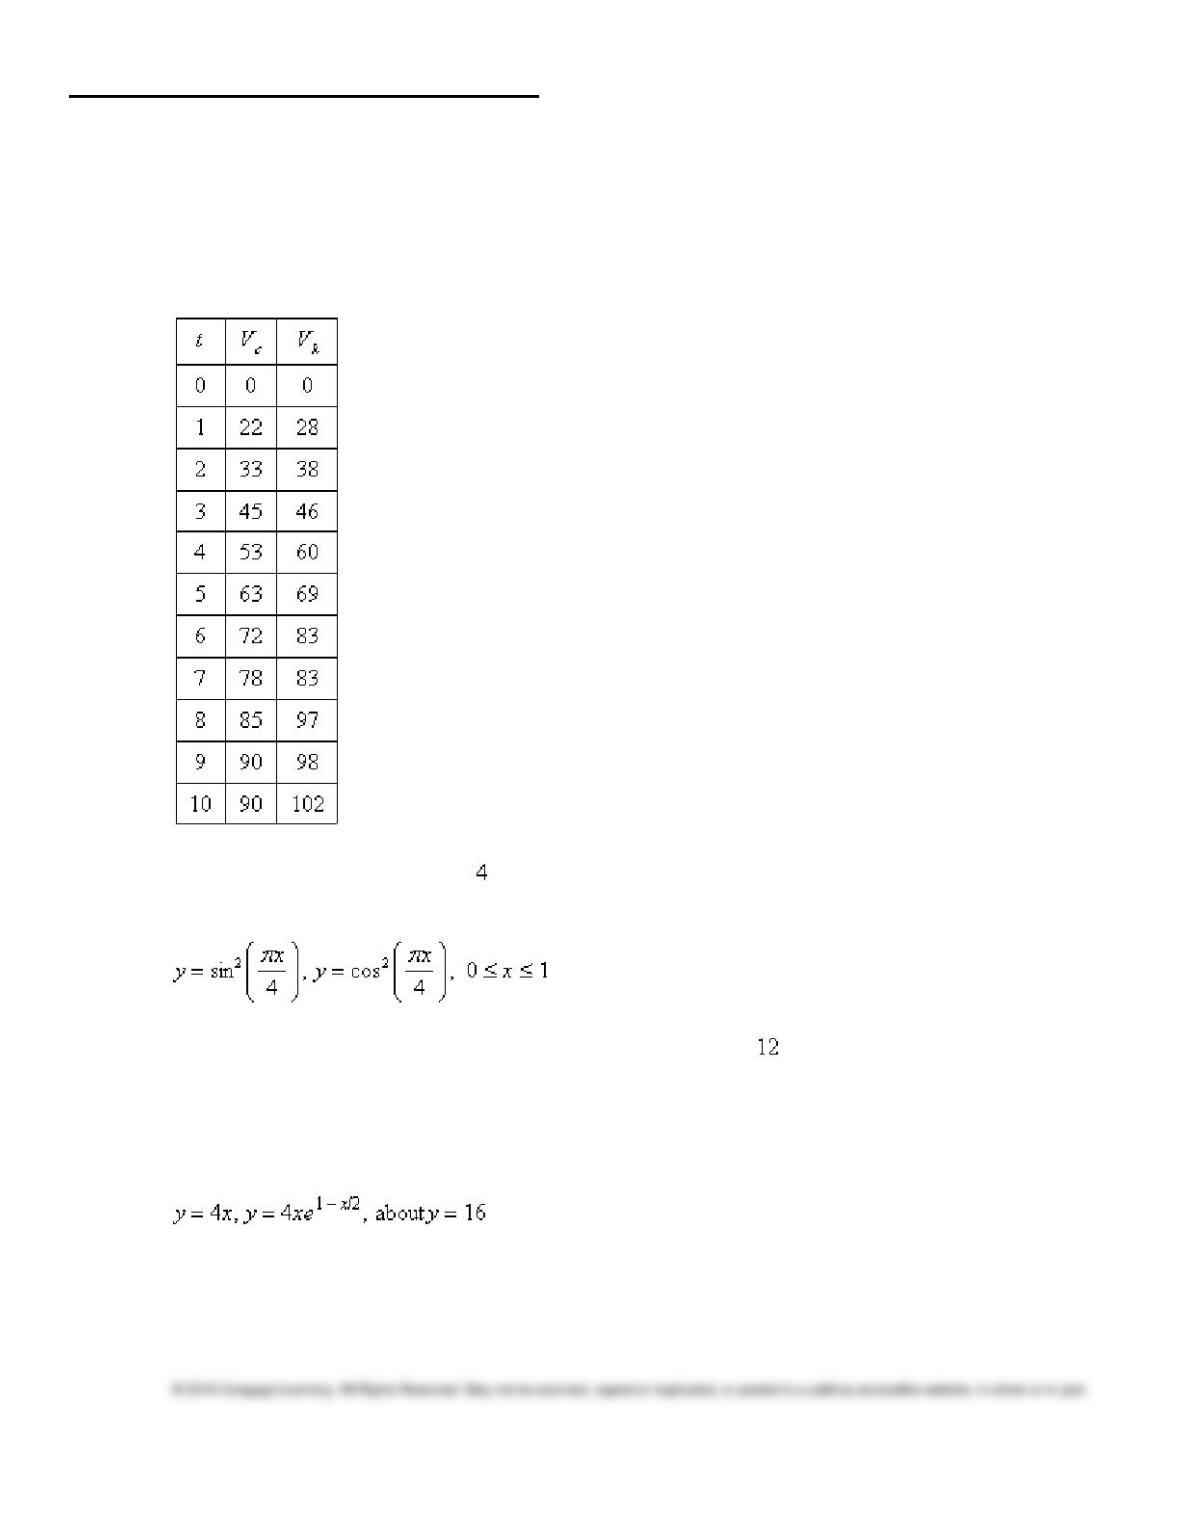
1. Racing cars driven by Chris and Kelly are side by side at the start of a race. The table shows the
velocities of each car (in miles per hour) during the first ten seconds of the race. Use the Midpoint
Rule to estimate how much farther Kelly travels than Chris does during the first ten seconds.
2. Find the volume common to two spheres, each with radius r = if the center of each sphere lies on
the surface of the other sphere.
3. Find the volume of the solid obtained by rotating about the x-axis the region under the curve
from x = to x = .
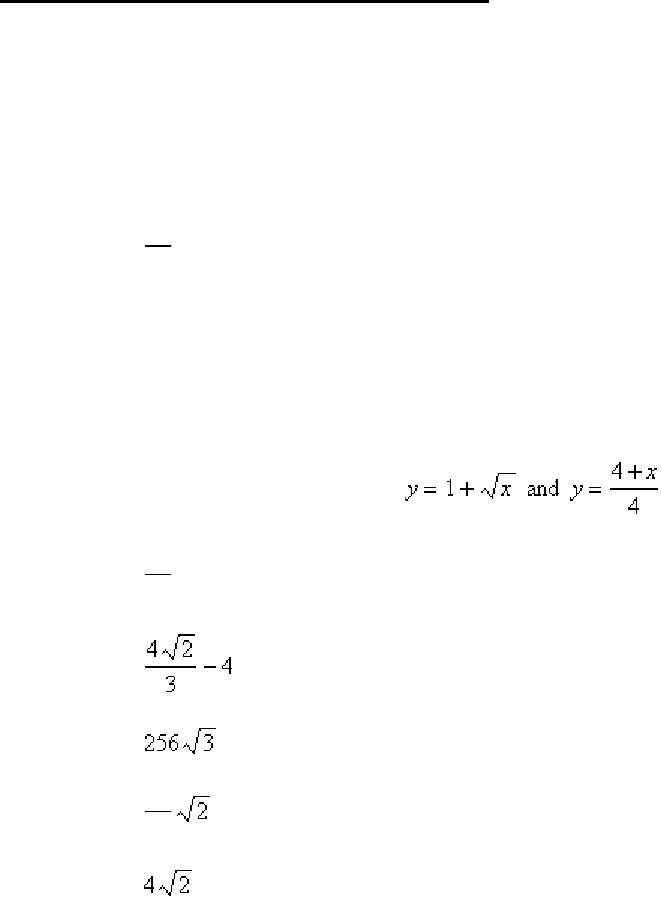
4. Find the volume of the solid obtained by rotating the region bounded by and about
the y-axis.
5. Set up, but do not evaluate, an integral for the volume of the solid obtained by rotating the region
bounded by the given curves about the specified axis.
6. Find the work done in pushing a car a distance of m while exerting a constant force of N.
Stewart – Calculus 8e ET Chapter 6 Form A
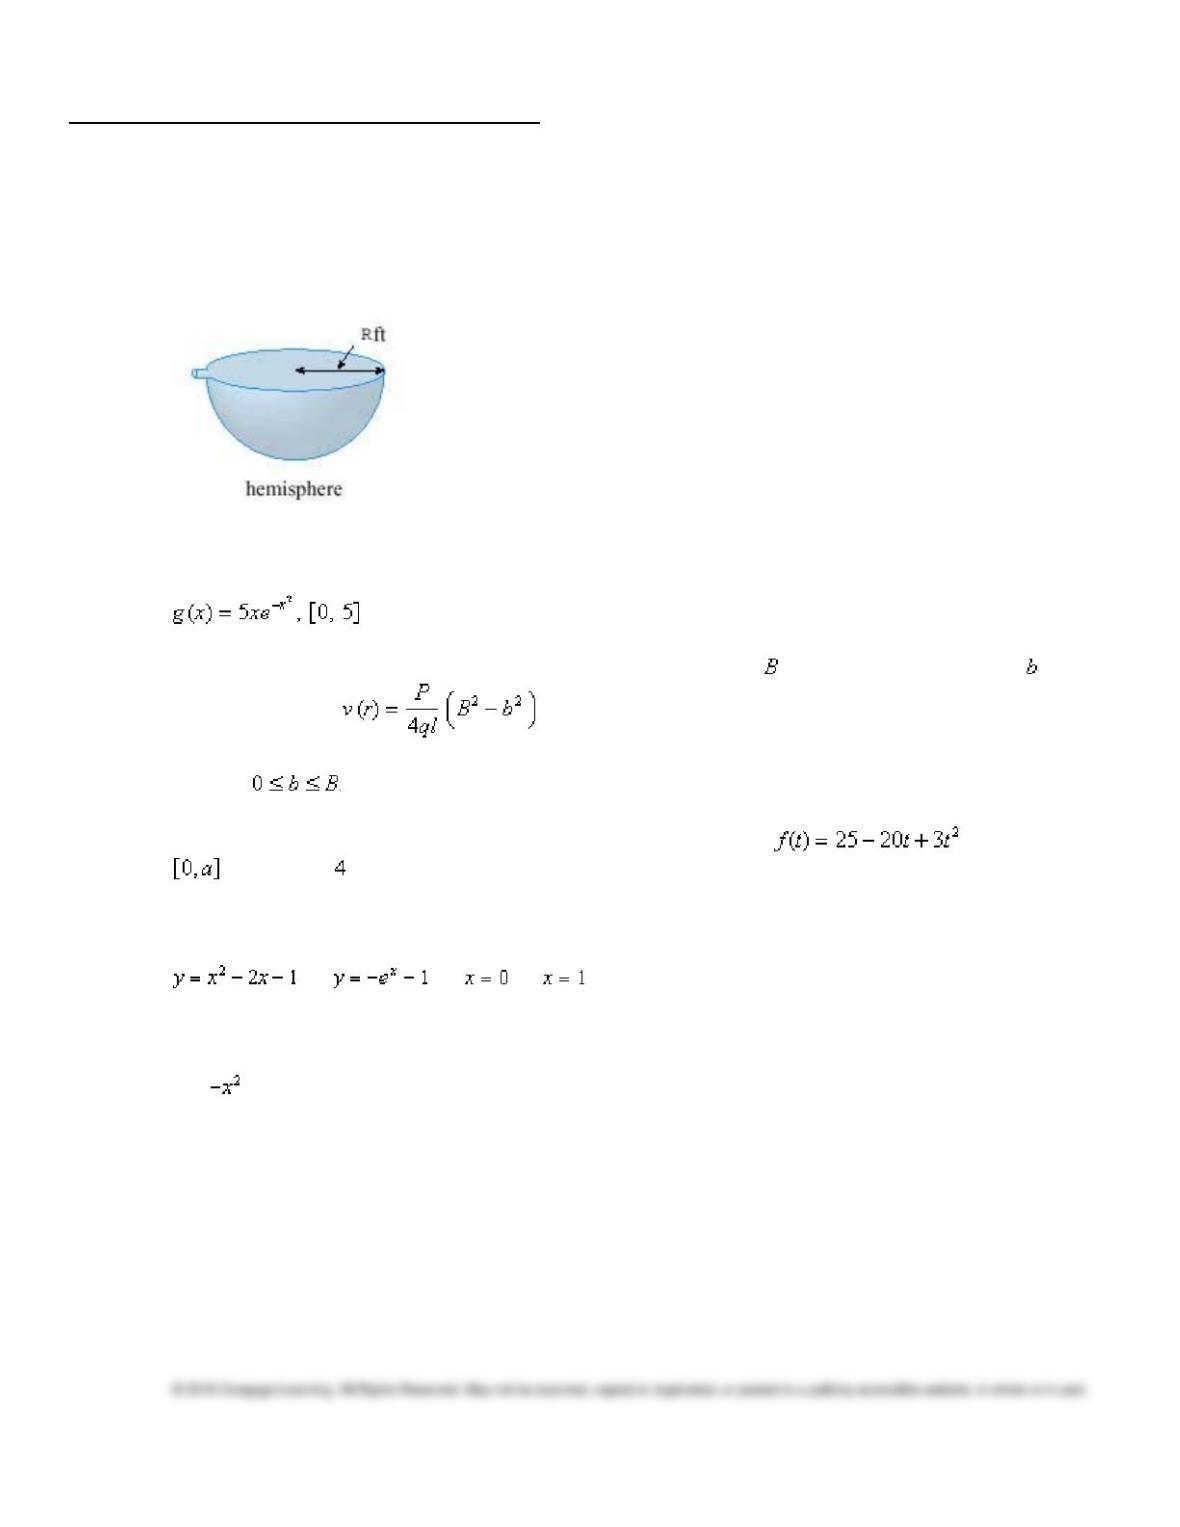
7. The tank shown is full of water. Given that water weighs 62.5 lb/ft and R = 5, find the work (in lb-ft)
required to pump the water out of the tank.
8. Find the average value of the function on the given interval.
9. The velocity v of blood that flows in a blood vessel with radius and length l at a distance from
the central axis is , where P is the pressure difference between the ends of the
vessel and q is the viscosity of the blood. Find the average velocity (with respect to r) over the
interval
10. Find the number(s) a such that the average value of the function on the interval
is equal to .
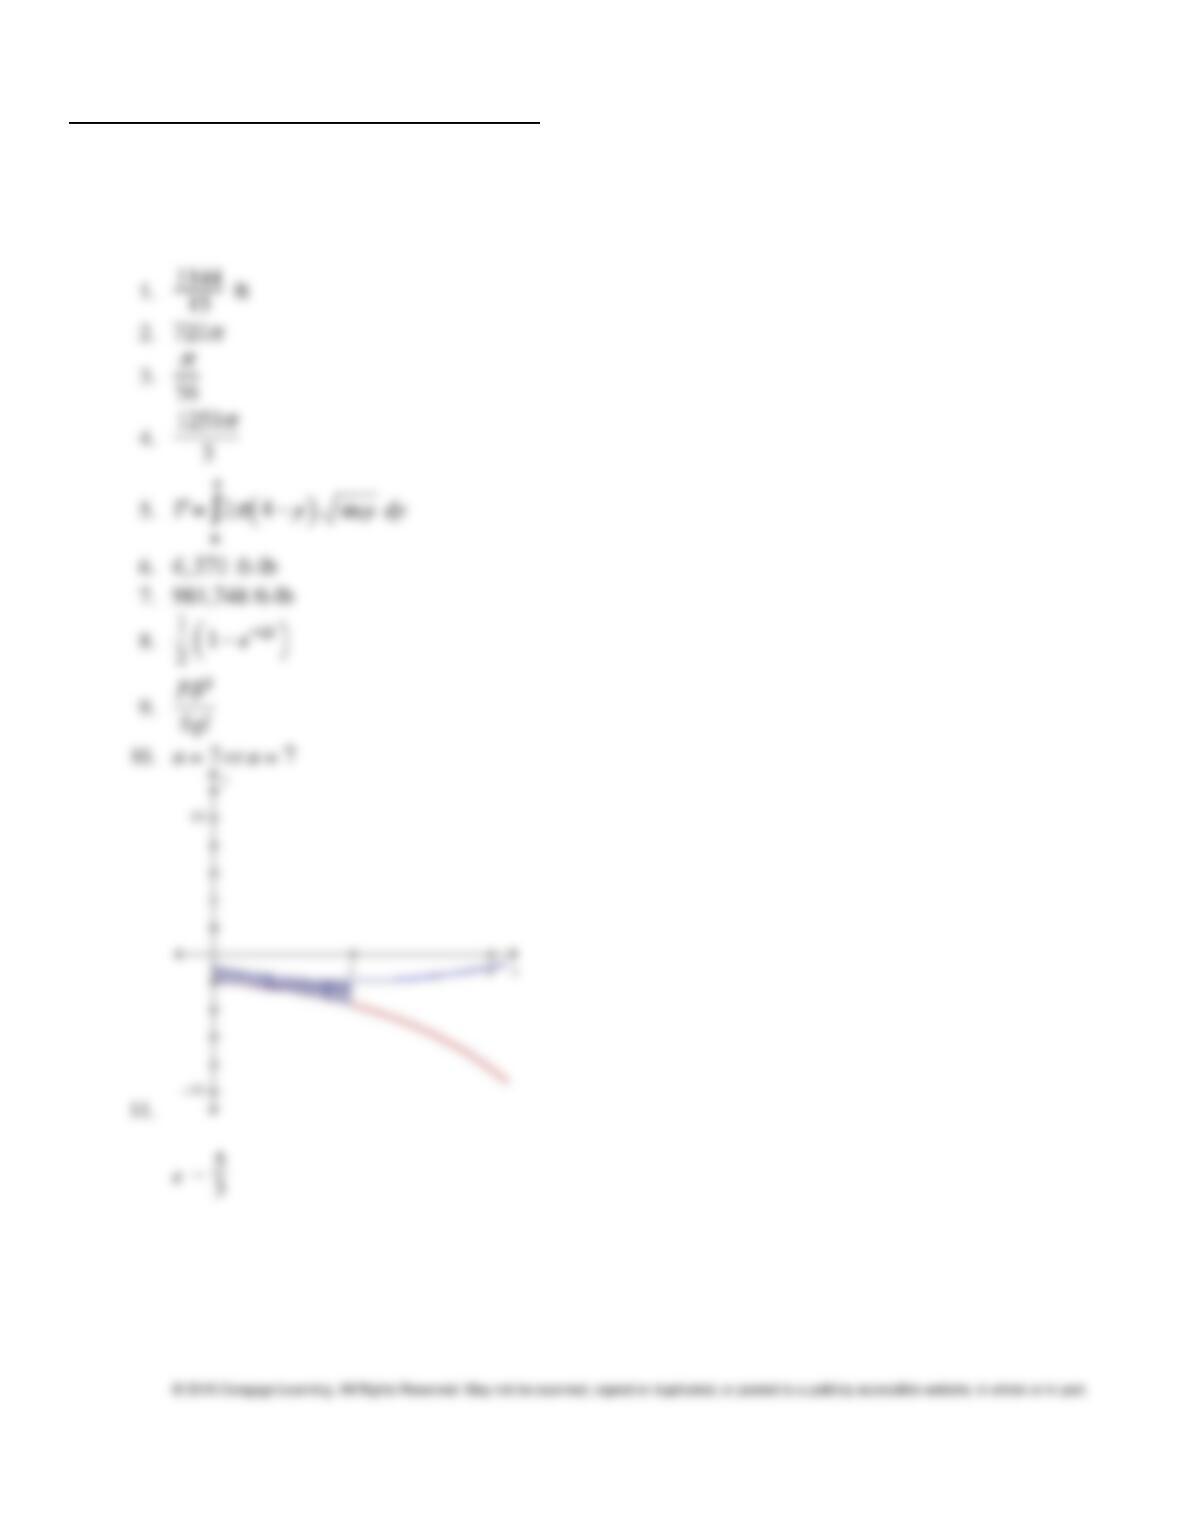
11. Sketch the region bounded by the graphs of the given equations and find the area of that region.
, , ,
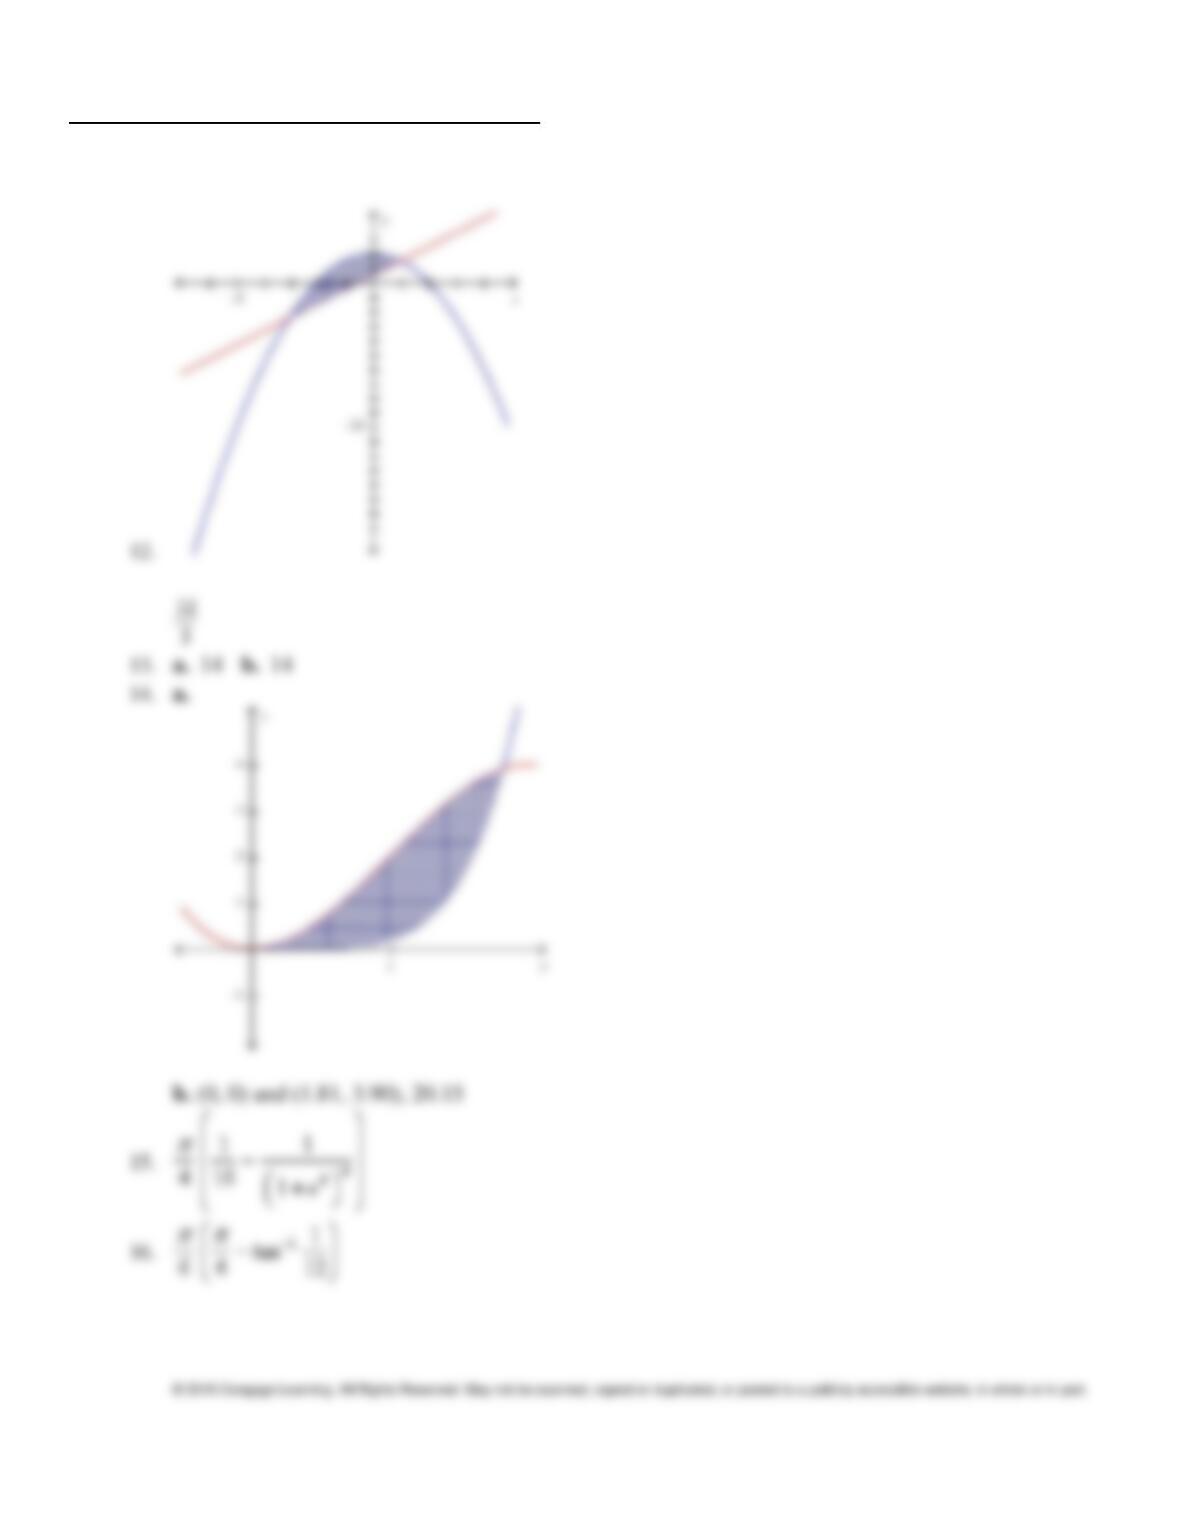
12. Sketch the region bounded by the graphs of the given equations and find the area of that region.
y = + 4, y = 2x + 1
13. Find the area of the region bounded by the given curves (a) using integration with respect to x and
(b) using integration with respect to y.
y = 2x3, y = 5x + 6, x = 0
Stewart – Calculus 8e ET Chapter 6 Form A
14. Use a graphing utility to (a) plot the graphs of the given functions and (b) find the approximate
x-coordinates of the points of intersection of the graphs. Then find an approximation of the volume
of the solid obtained by revolving the region bounded by the graphs of the functions about the x-axis.
Round answers to two decimal places.
y = x5, y = 3x2 – x3
15. Find the volume of the solid generated by revolving the region bounded by the graphs of the
equations about the indicated axis.
, , , ; the x-axis
16. Use the method of cylindrical shells to find the volume of the solid generated by revolving the
region bounded by the graphs of the equations about the indicated axis. Sketch the region and a
representative rectangle.
, y = 0, x = 1, x = 12; the y-axis
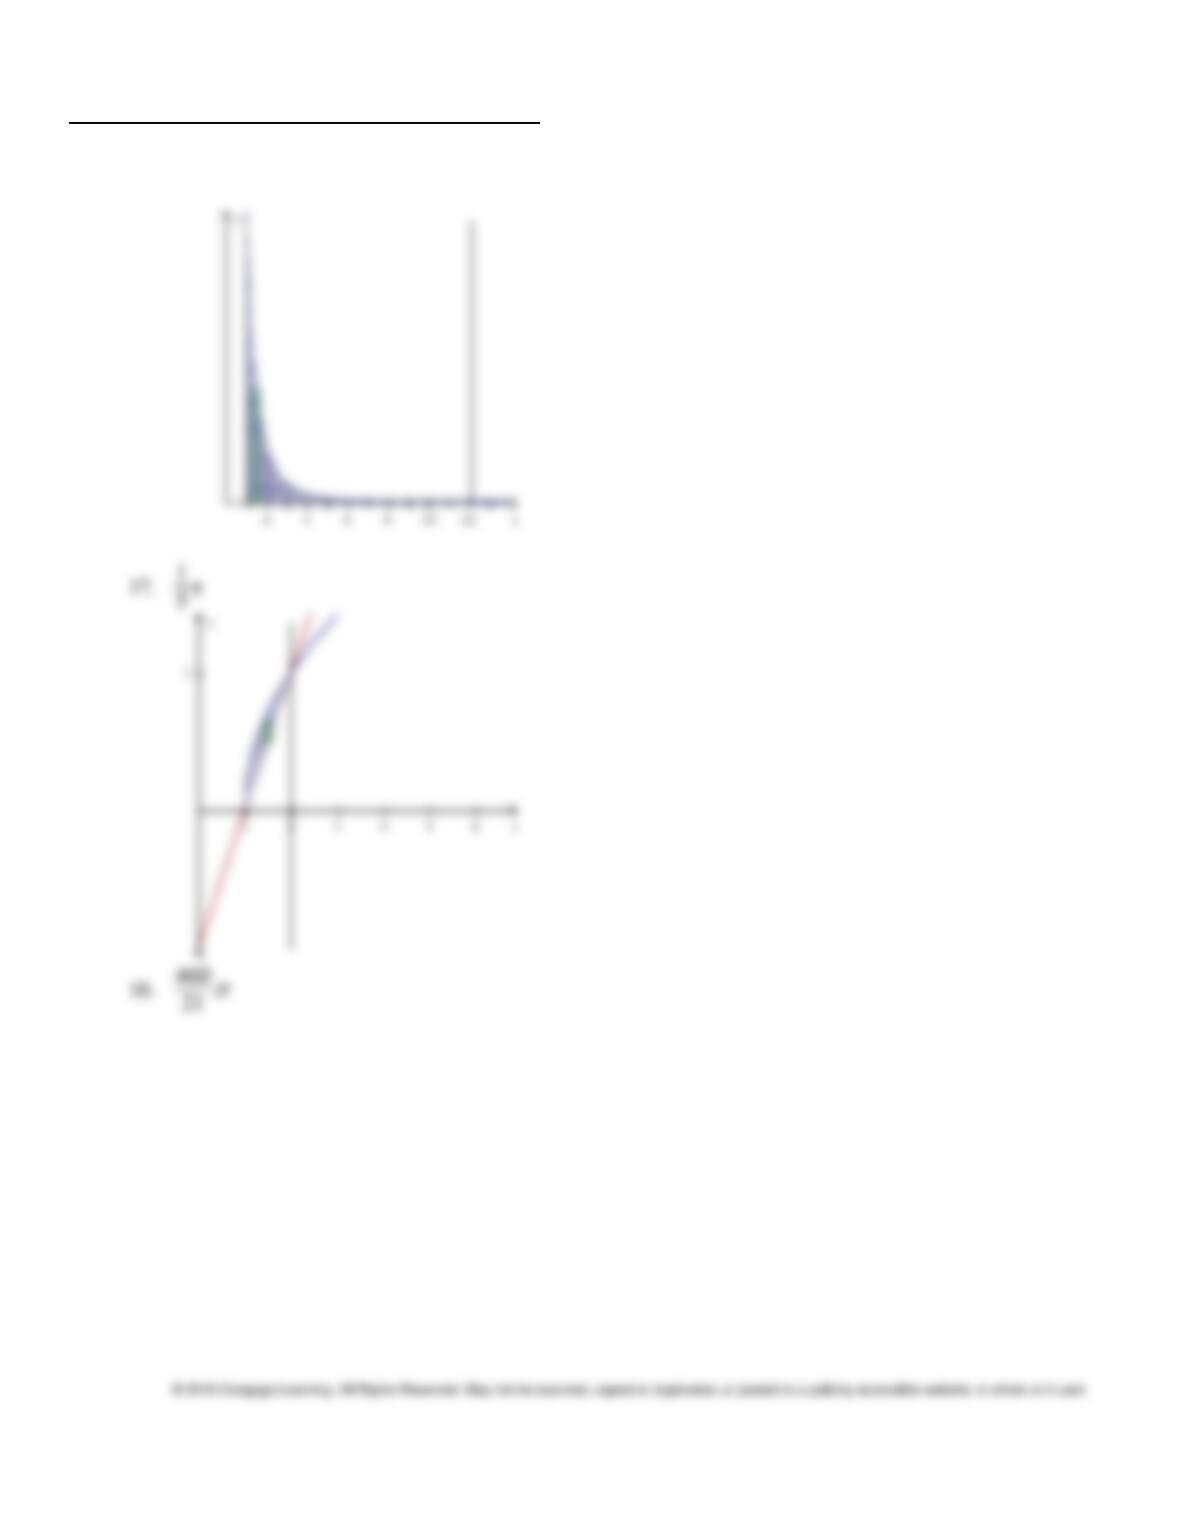
17. Find the volume of the solid generated by revolving the region bounded by the graphs of the
equations about the indicated line. Sketch the region and a representative rectangle.
y = , y = x – 1; the line x = 2
18. Find the volume of the solid obtained by revolving the region under the graph of on
[1, ) about the x-axis.
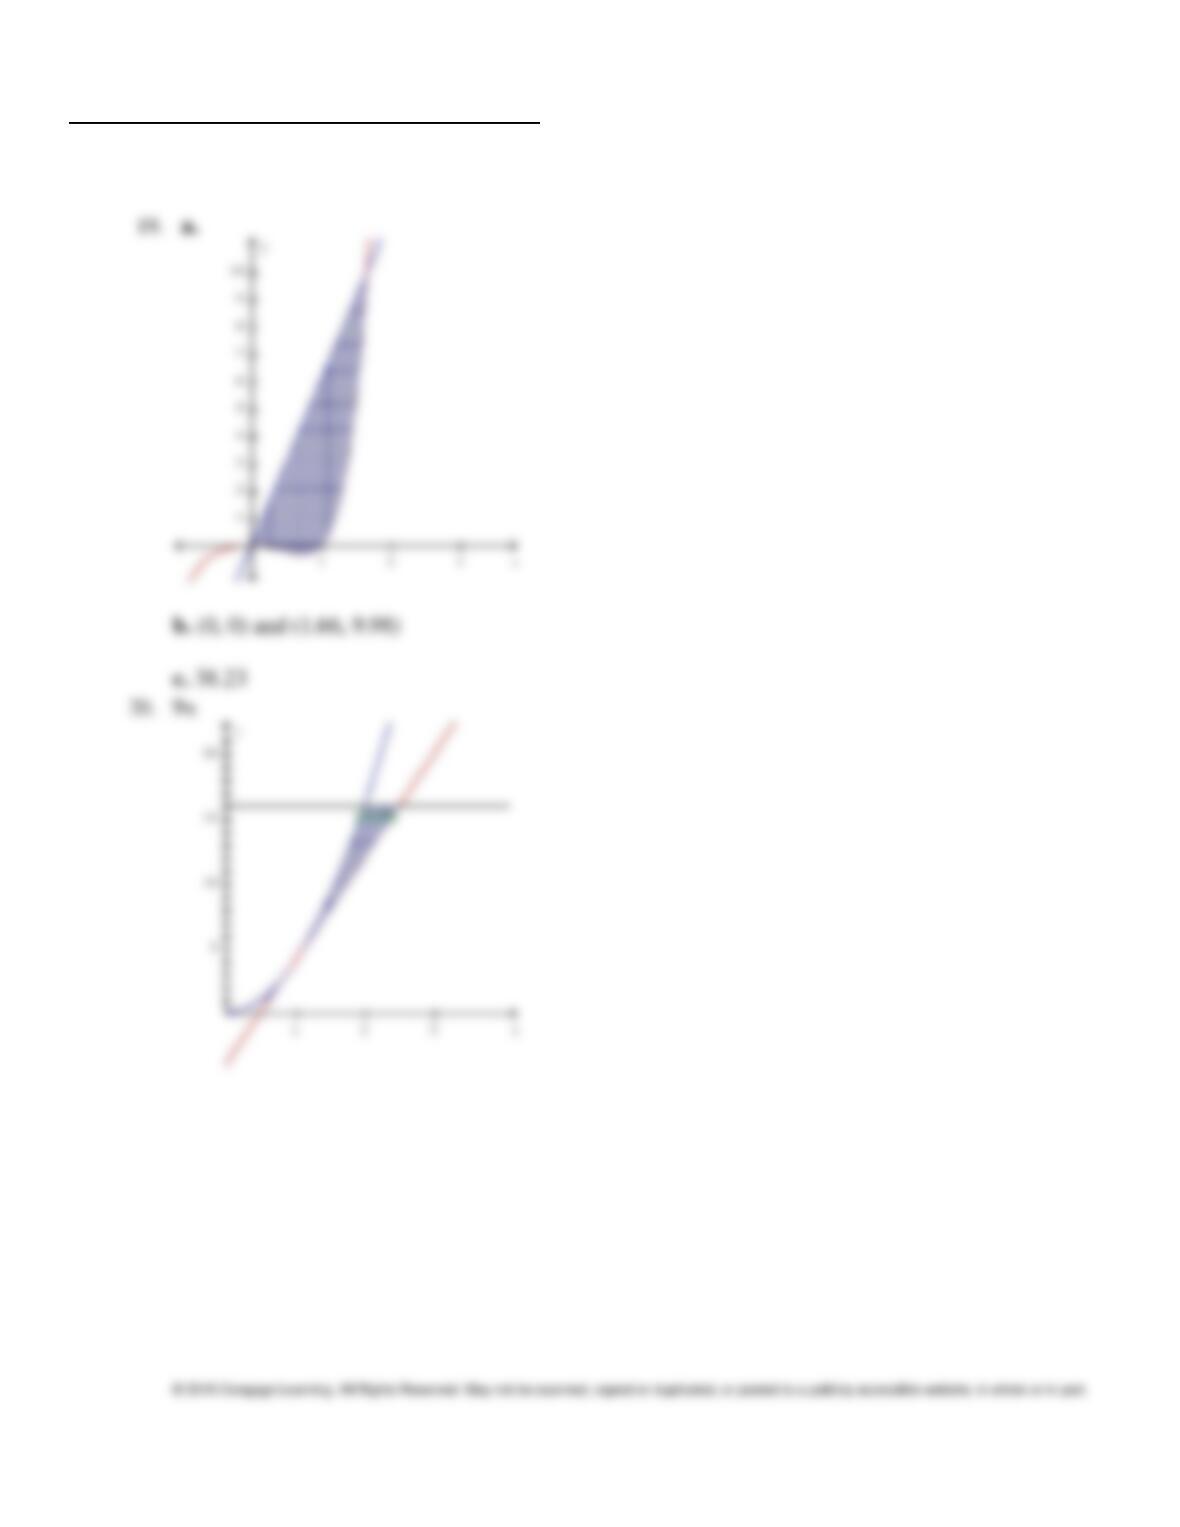
19. Use a graphing utility to (a) plot the graphs of the given functions, (b) find the approximate
x-coordinates of the points of intersection of the graphs, and (c) find an approximation of the volume
of the solid obtained by revolving the region bounded by the graphs of the functions about the y-axis.
Round answers to two decimal places.
y = 6x, y = – , x 0
Stewart – Calculus 8e ET Chapter 6 Form A
20. Use the method of disks or washers, or the method of cylindrical shells to find the volume of the
solid generated by revolving the region bounded by the graphs of the equations about the indicated
axis. Sketch the region and a representative rectangle.
y = 4 , y = 8x – 4, y = 16; the y-axis
Stewart – Calculus 8e ET Chapter 6 Form A
Answer Key
Stewart – Calculus 8e ET Chapter 6 Form A
Stewart – Calculus 8e ET Chapter 6 Form A
Stewart – Calculus 8e ET Chapter 6 Form A
Stewart – Calculus 8e ET Chapter 6 Form B
1.
Racing cars driven by Chris and Kelly are side by side at the start of a race. The table shows the
velocities of each car (in miles per hour) during the first ten seconds of the race. Use the Midpoint
Rule to estimate how much farther Kelly travels than Chris does during the first ten seconds.
2. Use the Midpoint Rule with n = to approximate the area of the region bounded by the given
curves.
3. Find the volume common to two spheres, each with radius r = if the center of each sphere lies on
the surface of the other sphere.
4. Use a computer algebra system to find the exact volume of the solid obtained by rotating the region
bounded by the given curves about the specified line.
Stewart – Calculus 8e ET Chapter 6 Form B
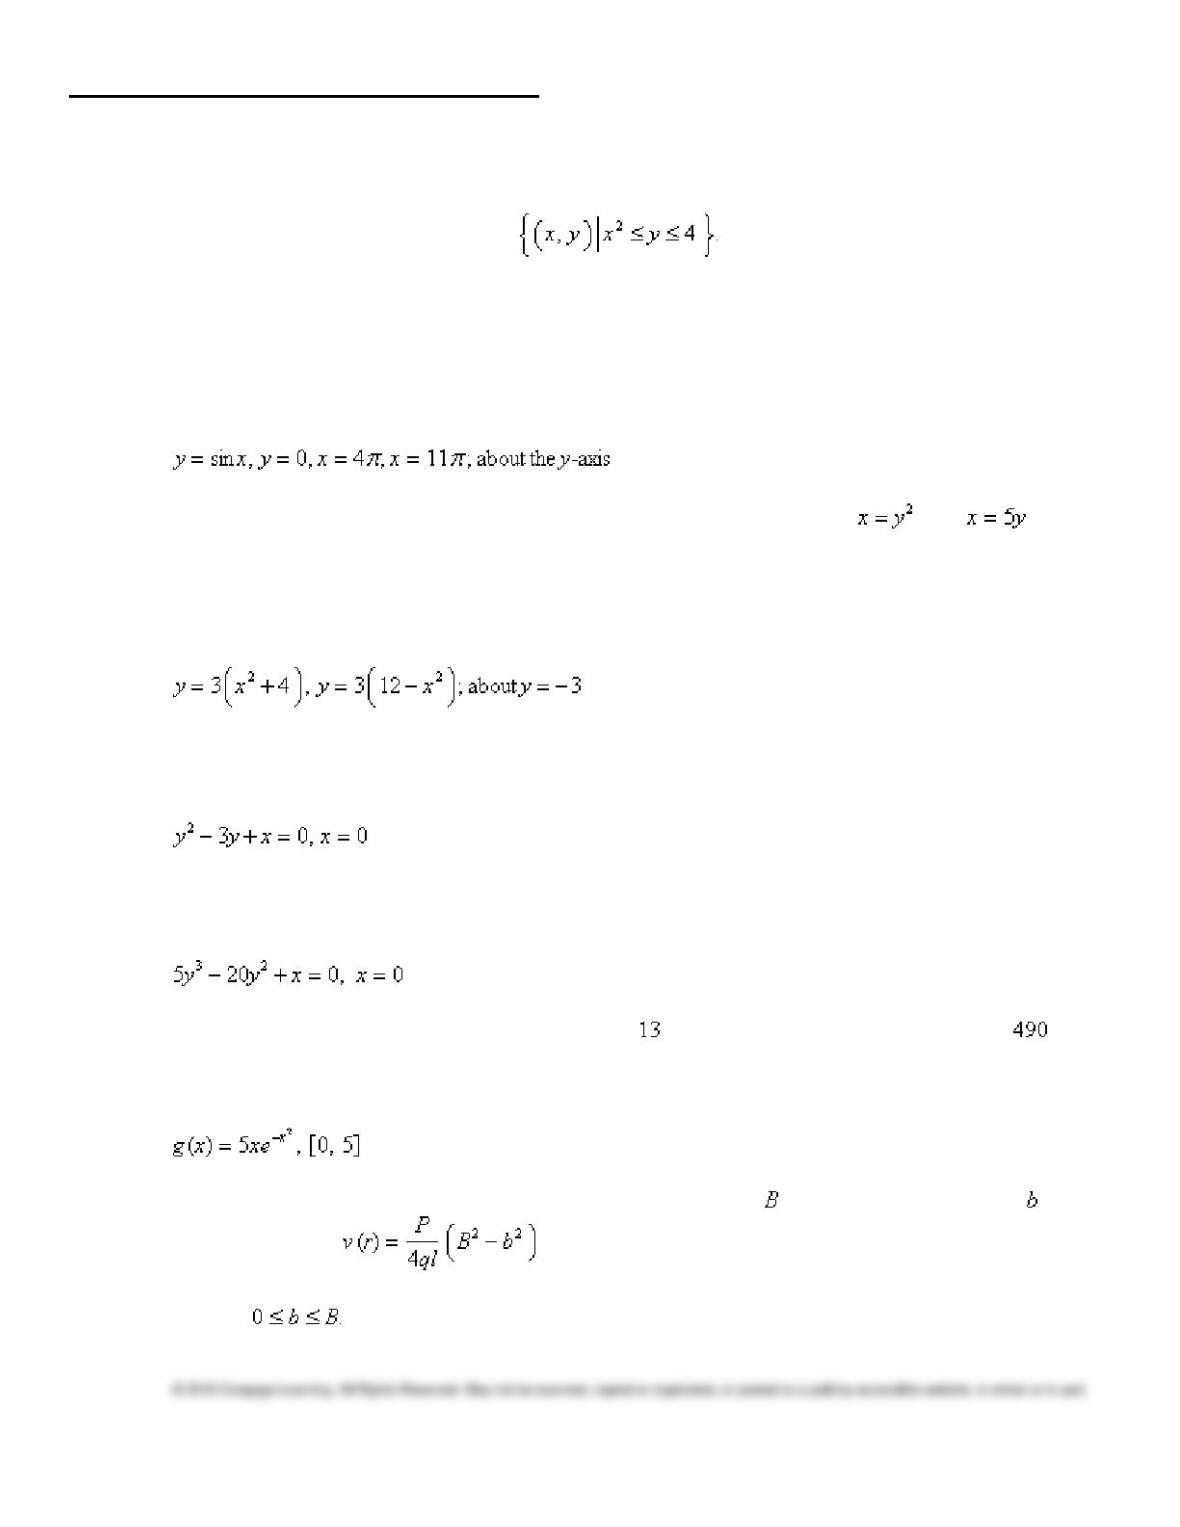
5. The base of S is the parabolic region Cross-sections perpendicular to the y
axis are squares.
Find the volume of S.
6. Set up, but do not evaluate, an integral for the volume of the solid obtained by rotating the region
bounded by the given curves about the specified axis.
7. Find the volume of the solid obtained by rotating the region bounded by and about
the y-axis.
8. Find the volume of the solid obtained by rotating the region bounded by the given curves about the
specified axis.
9. Use the method of cylindrical shells to find the volume of solid obtained by rotating the region
bounded by the given curves about the x-axis.
10. Use the method of cylindrical shells to find the volume of solid obtained by rotating the region
bounded by the given curves about the x axis.
11. Find the work done in pushing a car a distance of m while exerting a constant force of N.
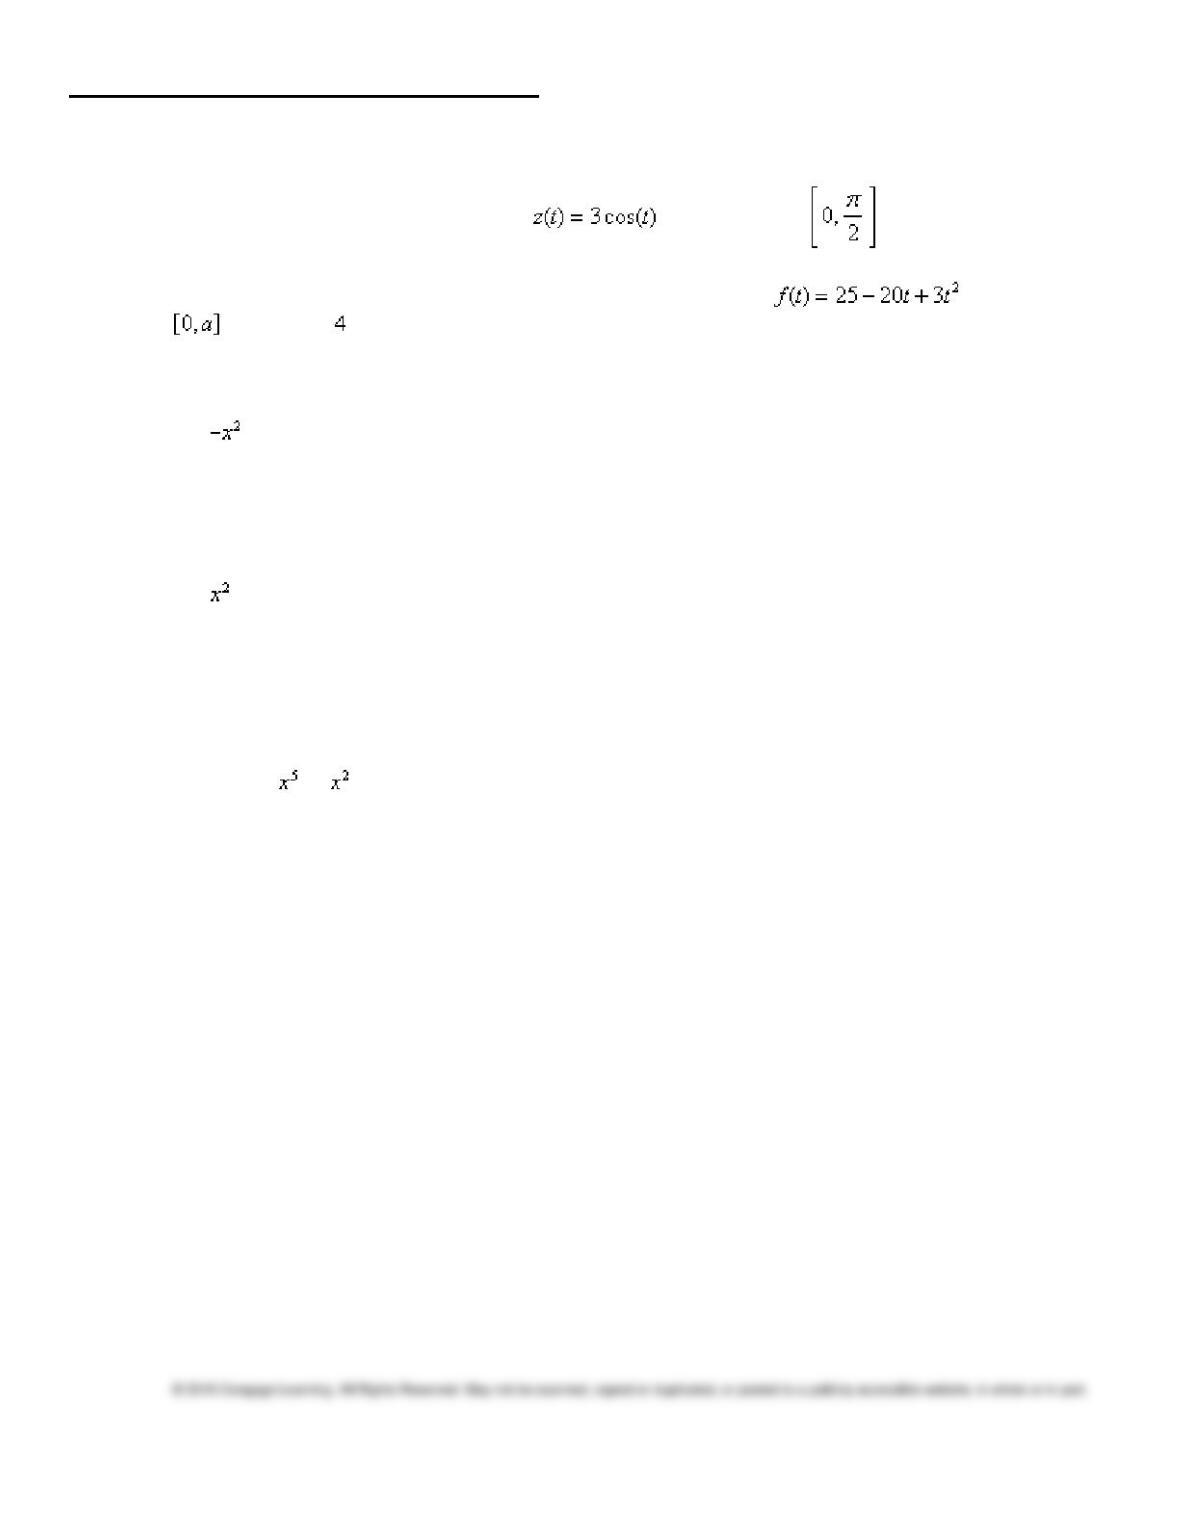
12. Find the average value of the function on the given interval.
13. The velocity v of blood that flows in a blood vessel with radius and length l at a distance from
the central axis is , where P is the pressure difference between the ends of the
vessel and q is the viscosity of the blood. Find the average velocity (with respect to r) over the
interval
Stewart – Calculus 8e ET Chapter 6 Form B
14. Find the average value of the function on the interval .
15. Find the number(s) a such that the average value of the function on the interval
is equal to .
16. Sketch the region bounded by the graphs of the given equations and find the area of that region.
y = + 4, y = 2x + 1
17. Use the method of cylindrical shells to find the volume of the solid generated by revolving the
region bounded by the graphs of the equations about the indicated axis. Sketch the region and a
representative rectangle.
y = , y = 0, x = 3; the y-axis
18. Use a graphing utility to (a) plot the graphs of the given functions, (b) find the approximate
x-coordinates of the points of intersection of the graphs, and (c) find an approximation of the volume
of the solid obtained by revolving the region bounded by the graphs of the functions about the y-axis.
Round answers to two decimal places.
y = 6x, y = – , x 0
19. A chain weighing 4 lb/ft hangs vertically from a winch located 11 ft above the ground, and the free
end of the chain is just touching the ground. Find the work done by the winch in pulling in the
whole chain.
20. A tank has the shape of an inverted right circular cone with a base radius of 4 m and a height of 9 m.
If the tank is filled to a height of 1 m, find the work required (to the nearest joule) to empty the tank
by pumping the water over the top of the tank. (The mass of water is 1000 kg/m3 and the force of
gravity is 9.8 m/sec2.)
Stewart – Calculus 8e ET Chapter 6 Form B
Answer Key
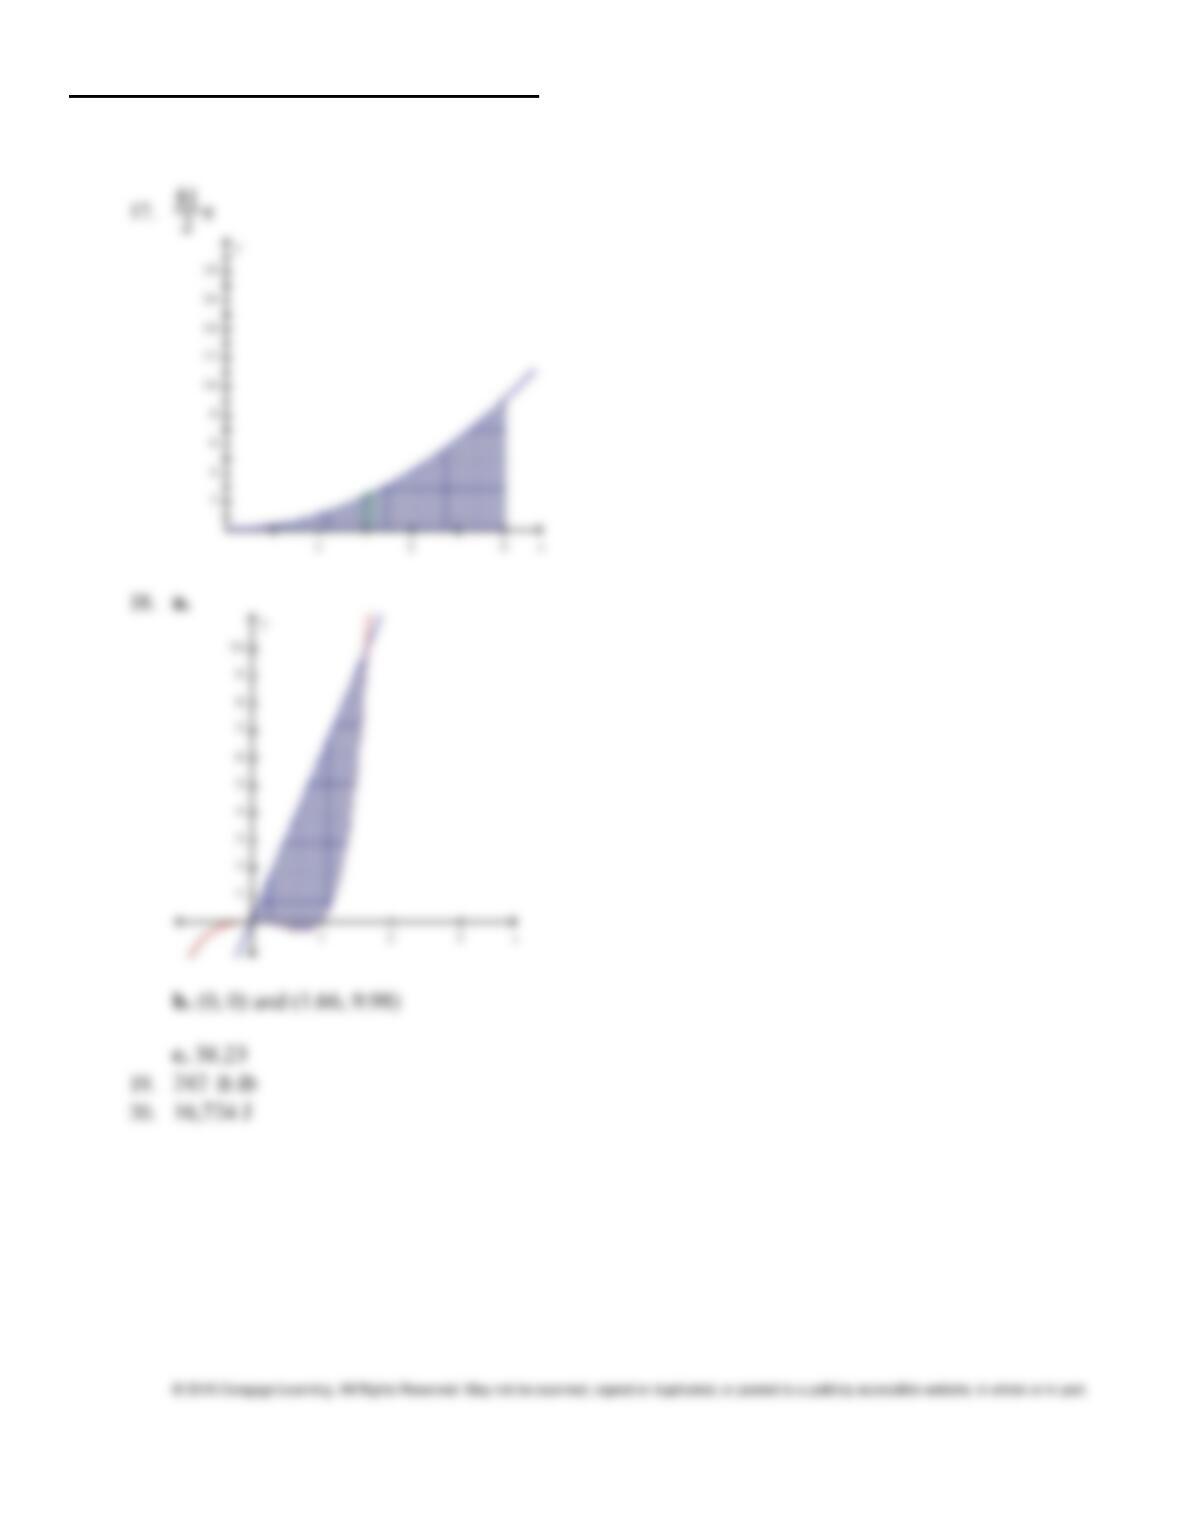
Stewart – Calculus 8e ET Chapter 6 Form B
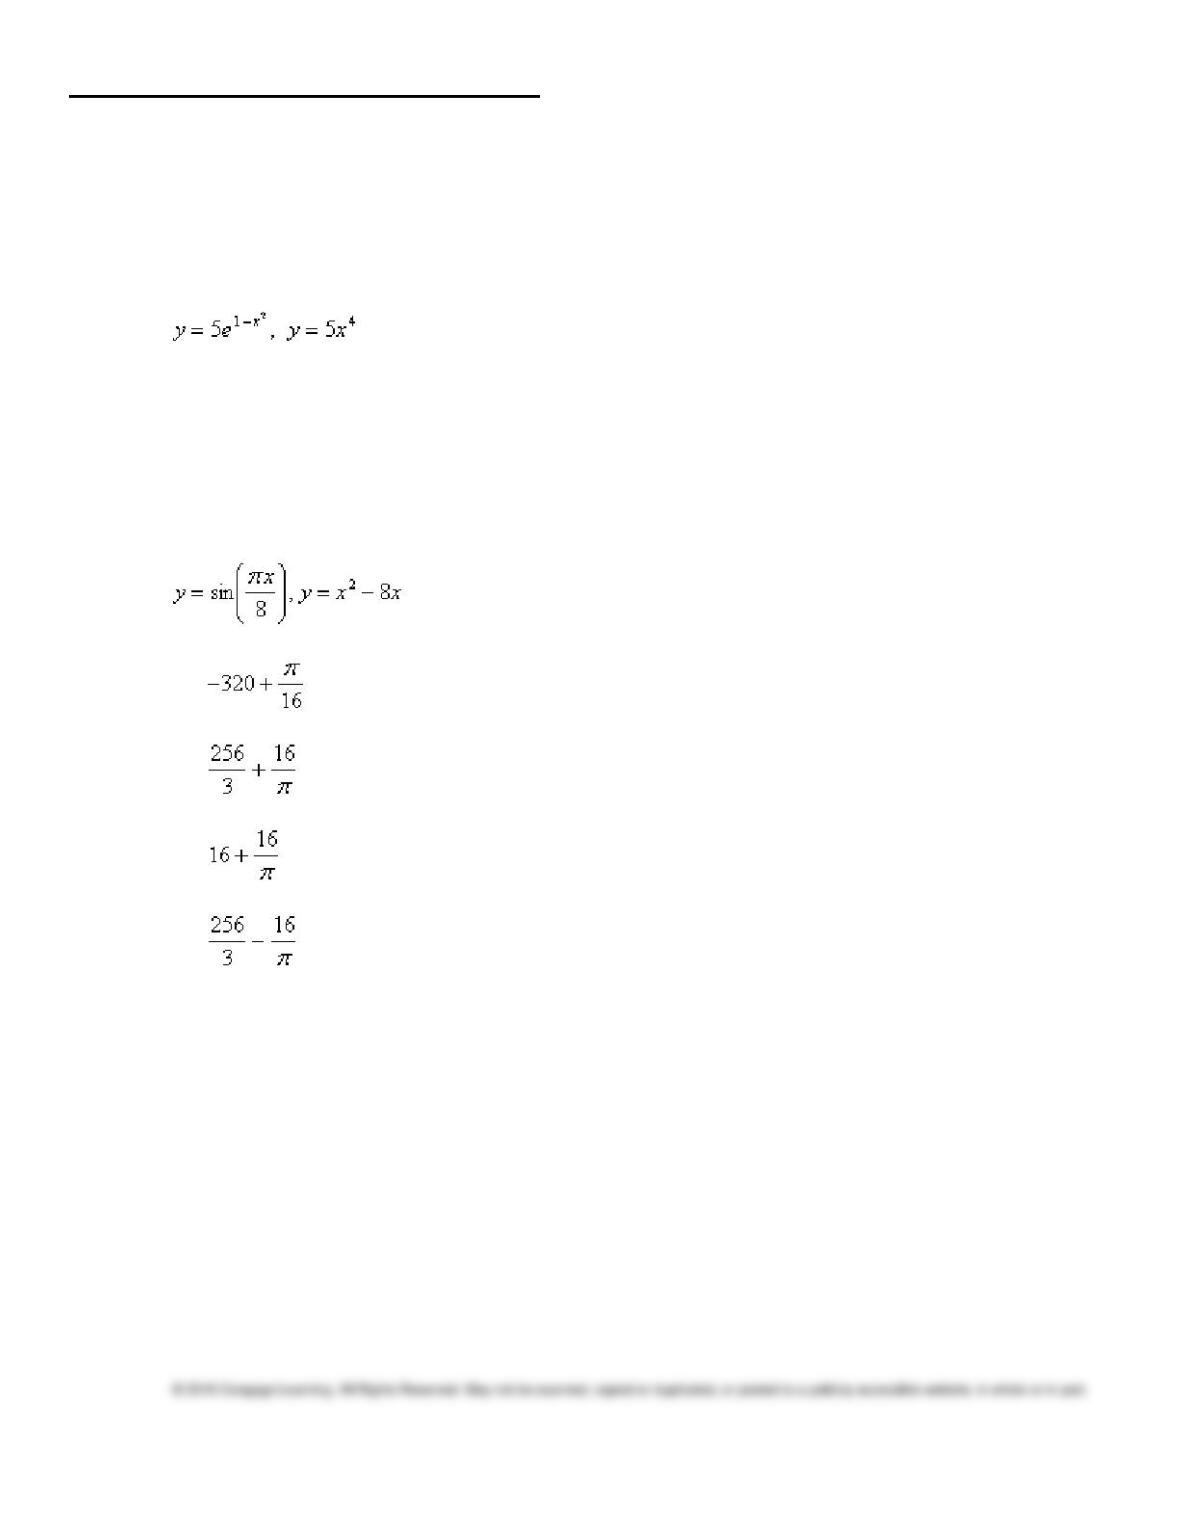
Stewart – Calculus 8e ET Chapter 6 Form C
Select the correct answer for each question.
____ 1. Graph the region between the curves and use your calculator to compute the area correct to five decimal
places.
a. 12.08127
b. 91.504
c. 3.141257
d. 3.66016
e. 18.3008
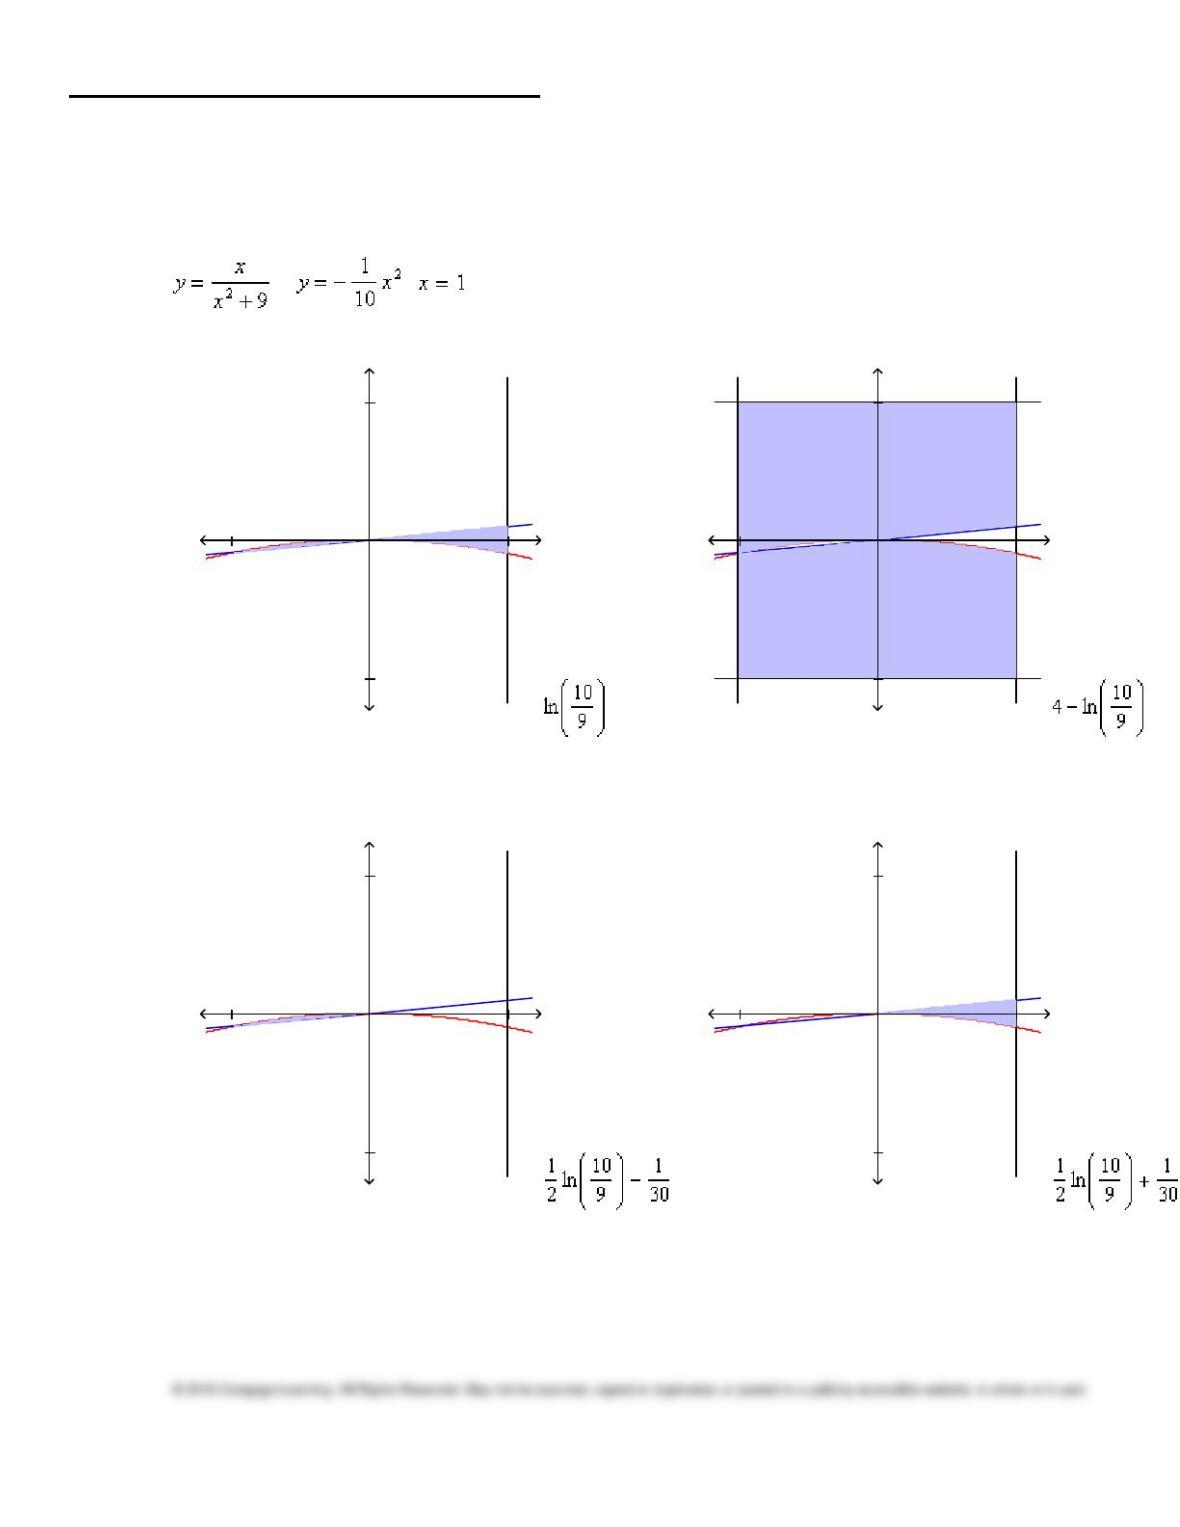
____ 2. Find the area of the region bounded by the given curves.
a.
b.
c.
d.
e. None of these
Stewart – Calculus 8e ET Chapter 6 Form C
____ 3. Sketch the region bounded by the graphs of the given equations and find the area of their region.
, ,
a.
1–1 x
1
–1
y
c.
1–1 x
1
–1
y
b.
1–1 x
1
–1
y
d.
1–1 x
1
–1
y
Stewart – Calculus 8e ET Chapter 6 Form C
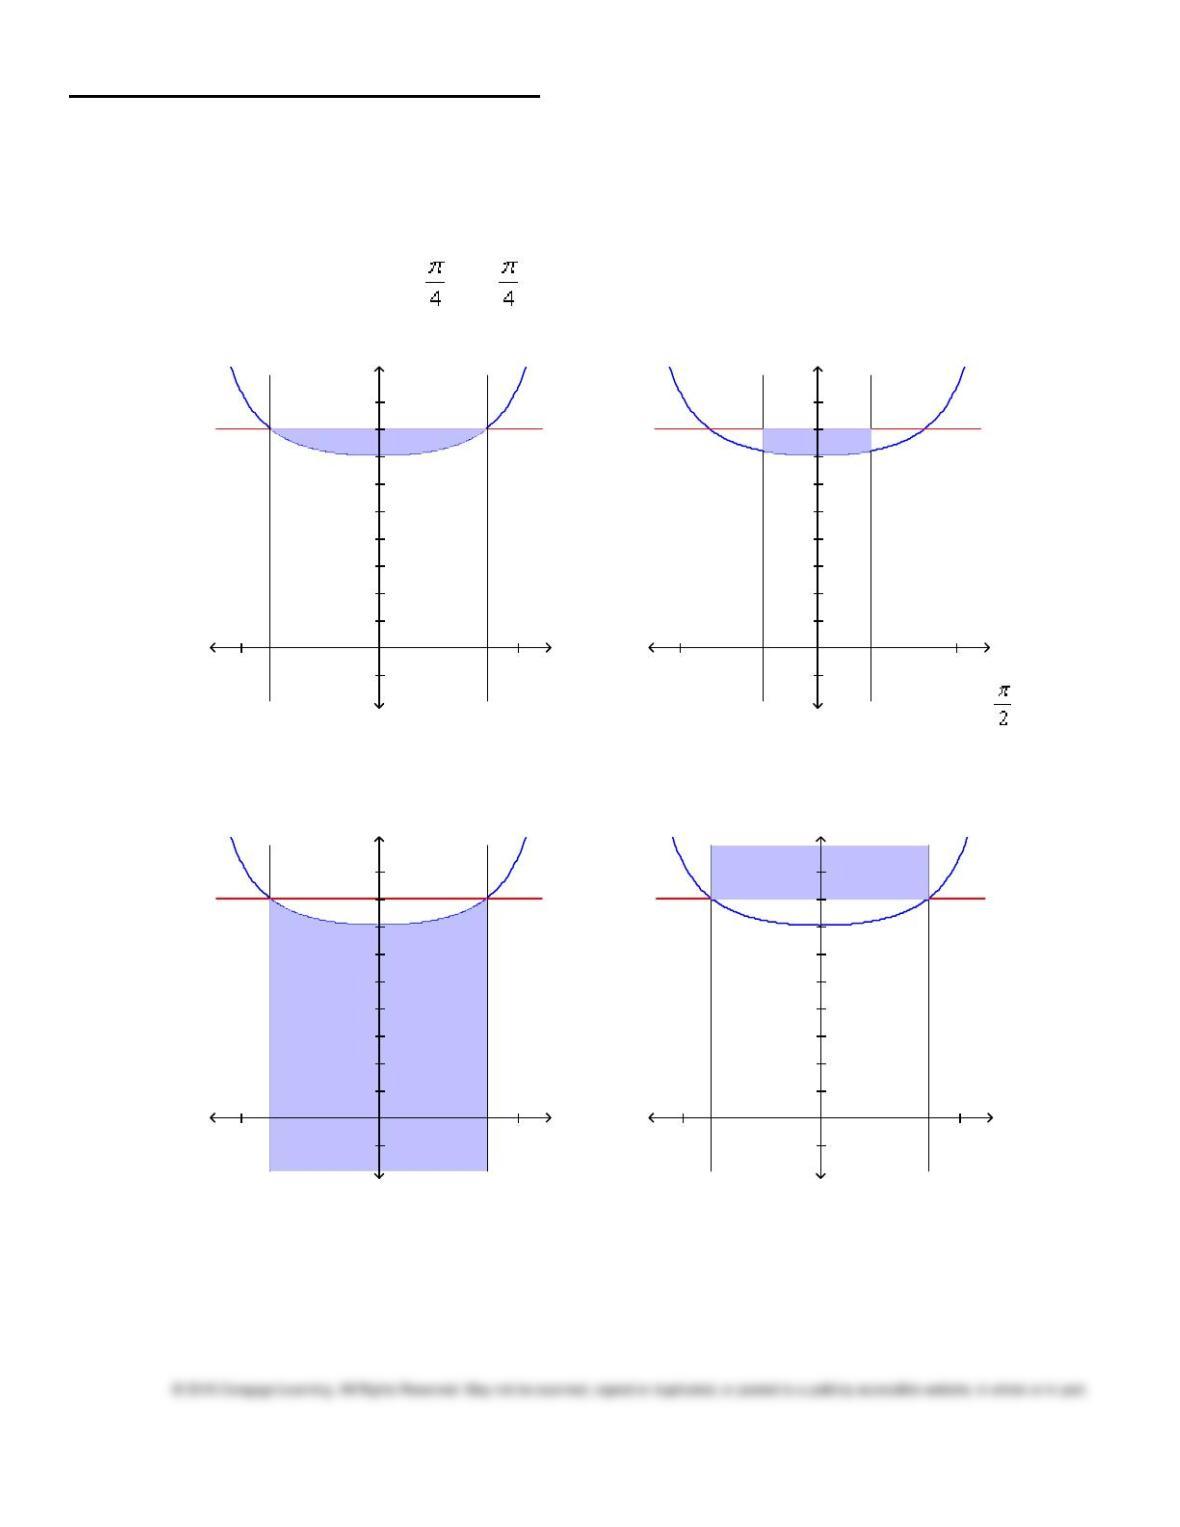
____ 4. Sketch the region bounded by the graphs of the given equations and find the area of that region.
y = sec2 x + 6, y = 8, x = – , x =
a.
1–1 x
2
4
6
8
y
– 2
c.
1–1 x
2
4
6
8
y
–
1
b.
1–1 x
2
4
6
8
y
8
d.
1–1 x
2
4
6
8
y
–
Stewart – Calculus 8e ET Chapter 6 Form C
© 2016 Cengage Learning. All Rights Reserved. May not be scanned, copied or duplicated, or posted to a publicly accessible website, in whole or in part.
____ 5. Use integration to find the area of the triangle with the given vertices.
(0, 0), (1, 7), (4, 2)
a.
13
2
b. 26
c. 28
d.
13
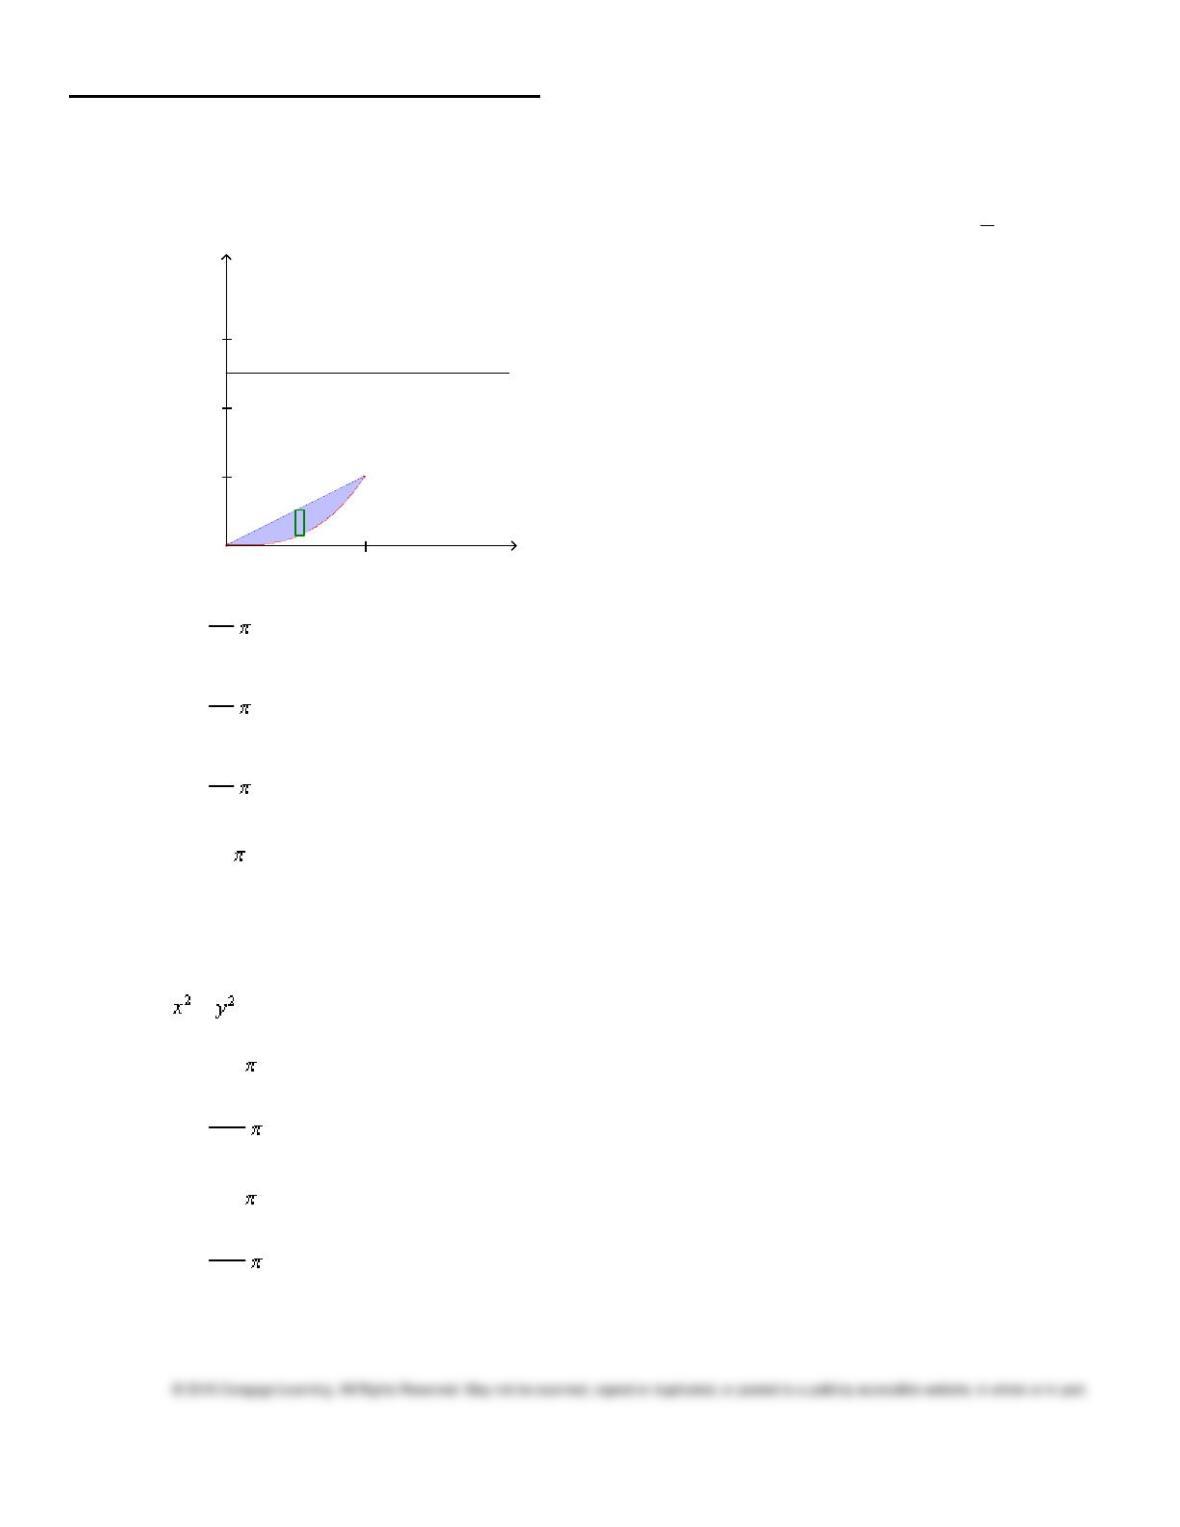
____ 6. Sketch the region enclosed by . Find the area of the region.
a.
32
3
b.
c.
d.
32
3
e.
Stewart – Calculus 8e ET Chapter 6 Form C
____ 7. Find the volume of the solid that is obtained by revolving the region about the line y =
5
2
.
y =5/2
y = x
y = x3
1x
1
2
3
y
a.
89
42
b.
89
14
c.
89
84
d. 89
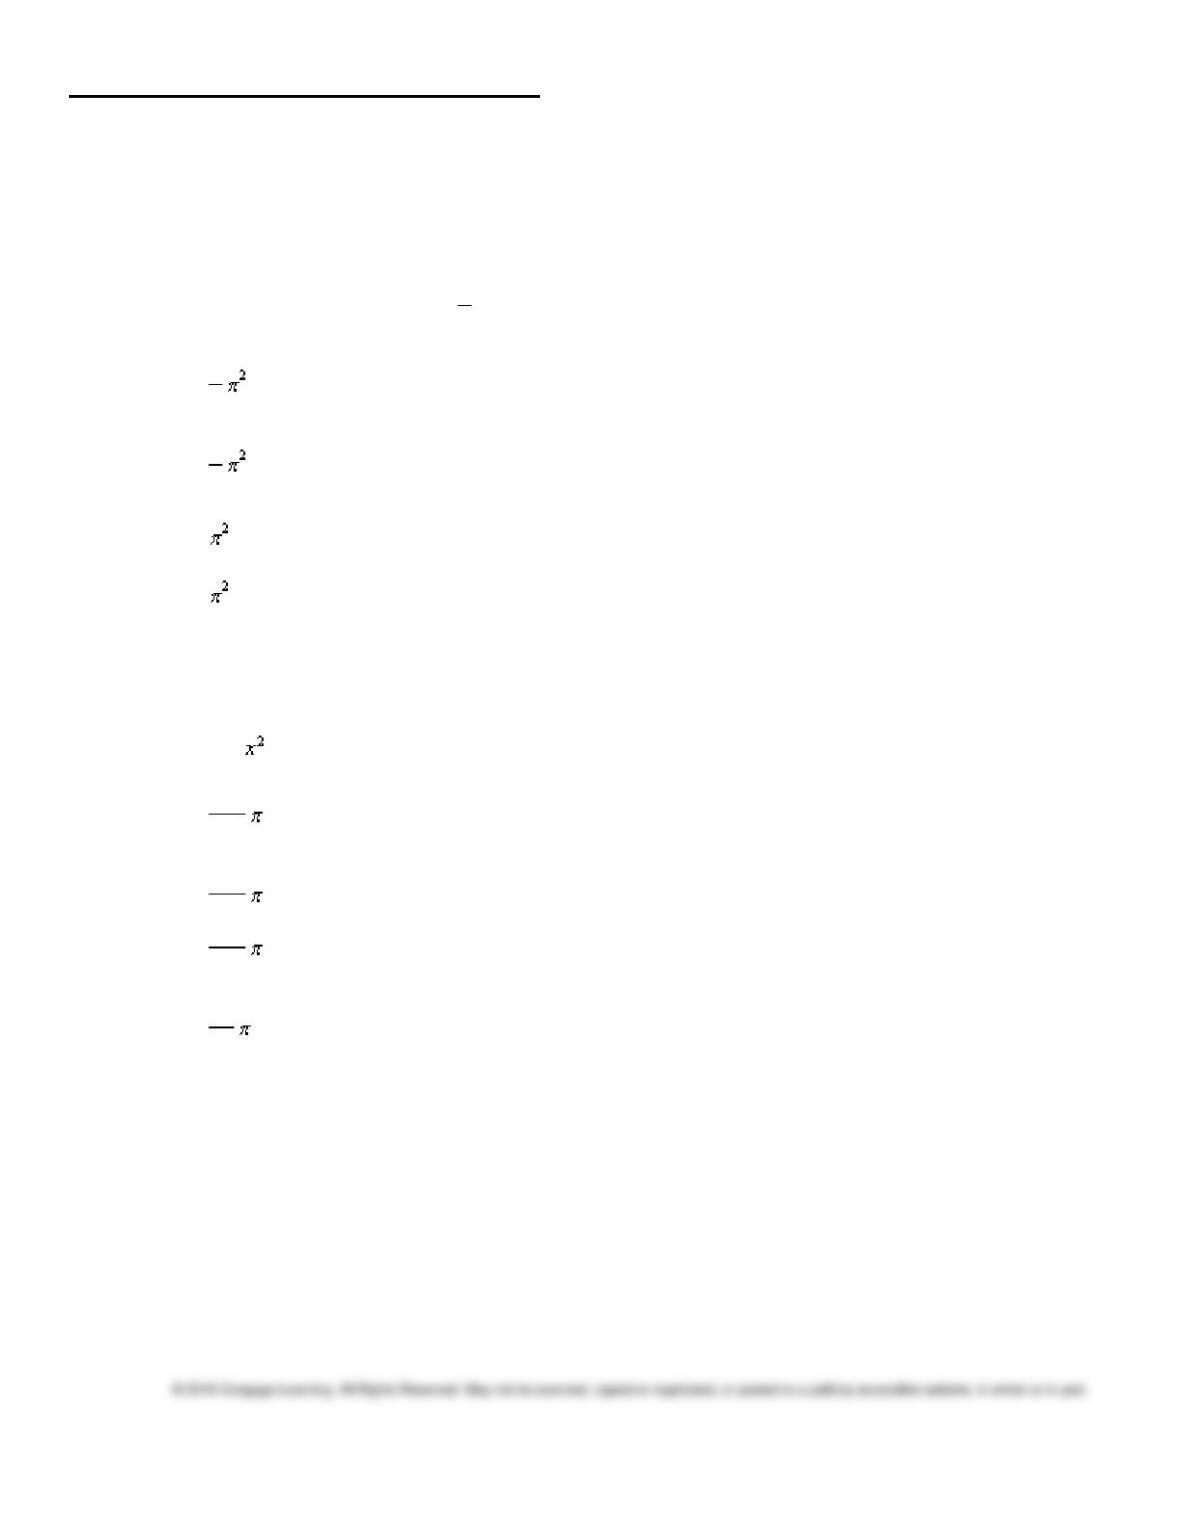
____ 8. Find the volume of the solid generated by revolving the region bounded by the graphs of the
equations and inequalities about the y-axis.
– = 16, x 0, y = – 4, y = 4
a.
256
b.
512
3
c.
128
d.
256
3
Stewart – Calculus 8e ET Chapter 6 Form C
____ 9. Find the volume of the solid generated by revolving the region bounded by the graphs of the
equations about the x-axis.
y = cos x + 1, x = 0, y = 0, x =
1
2
a.
3
4
b.
3
4
c.
d.
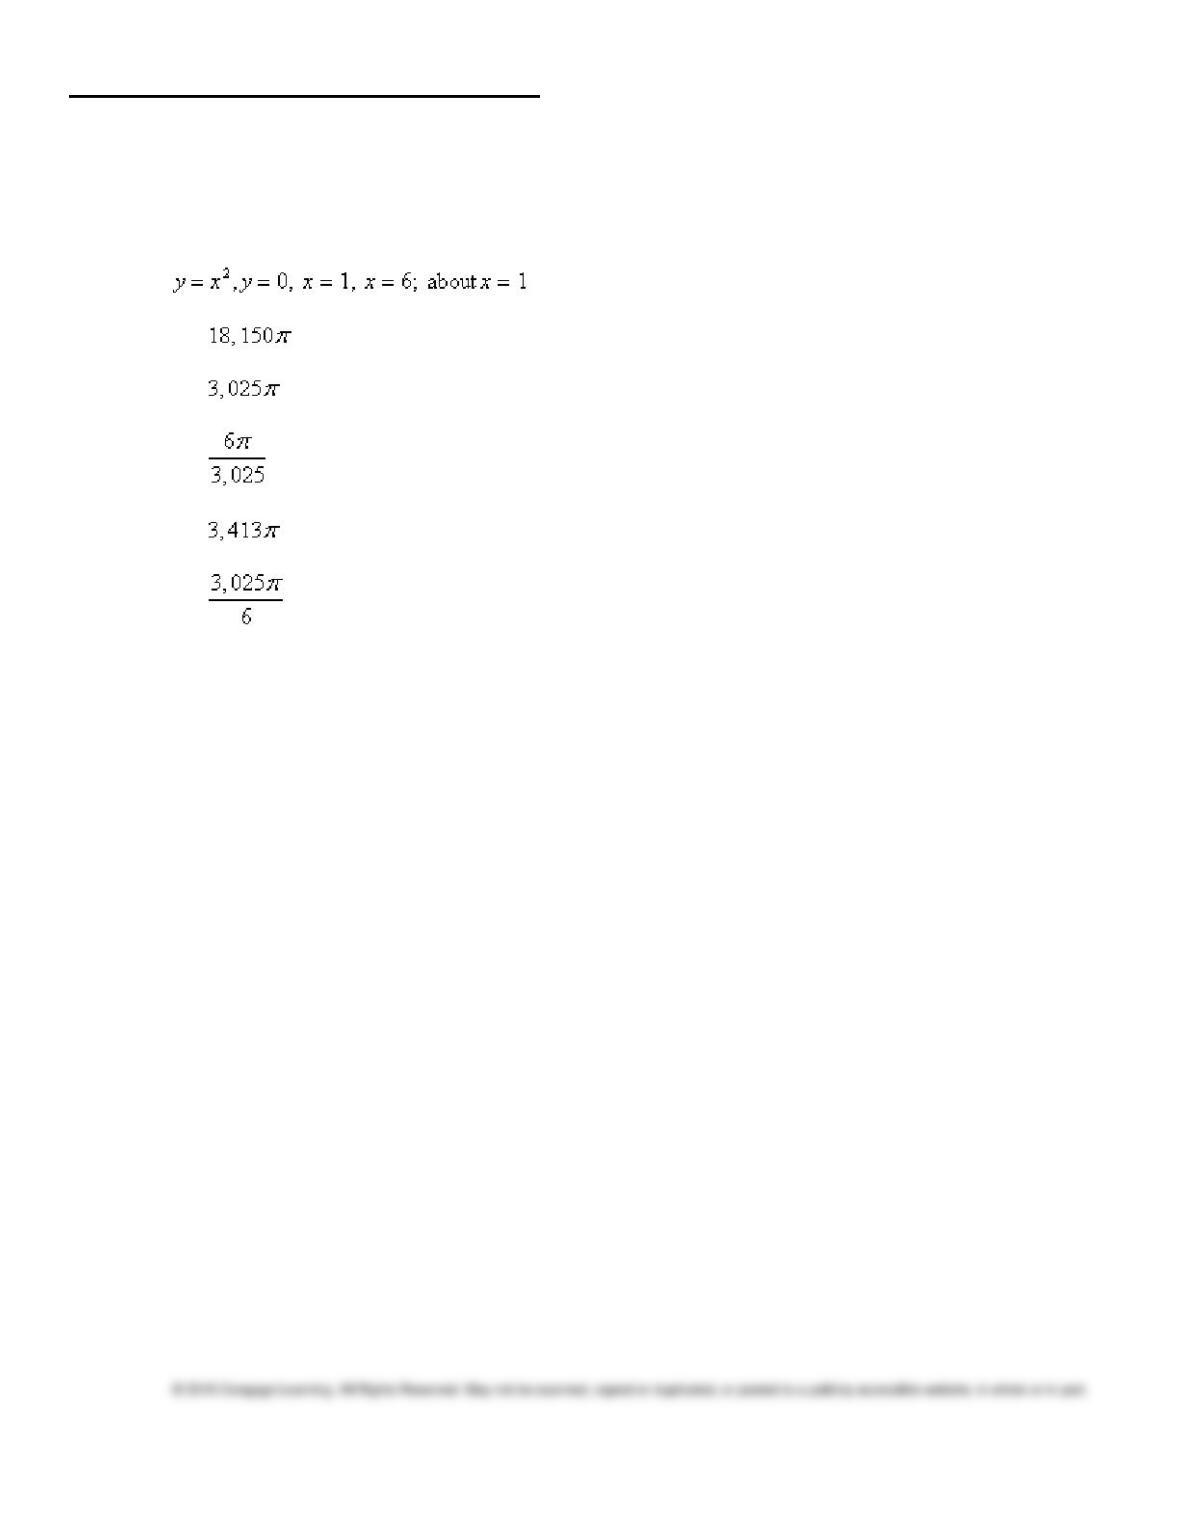
____ 10. Find the volume of the solid generated by revolving the region bounded by the graphs of the
equations about the indicated line.
y = 1 – , y = 0; the line y = 5
a.
368
15
b.
184
5
c.
184
15
d.
92
15
Stewart – Calculus 8e ET Chapter 6 Form C
____ 11. Use the method of cylindrical shells to find the volume of solid obtained by rotating the region
bounded by the given curves about the specified axis.
a.
b.
c.
d.
e.