1. If Juan has scored a 53 on a test, what can we say about how he has done?
a. Probably very little, because we don’t know his relative position in his norm group.
b. Probably very little, because we don’t know the range of scores.
c. Probably very little, because we don’t know the measures of variability.
d. He likely has done poorly.
e. All but one of these.
2. Jerome has scored a 10 on a test. How has he done?
a. On some tests, this might be indicative of a very good score.
b. On some tests, this might be indicative of a very poor score.
c. On some tests, this might be indicative of a moderate score.
d. We should ask Jerome how he thinks he has done. His thoughts about his score are part of what determines
how he has done.
e. All of these.
3. The results of a norm group comparison test can do all of the following EXCEPT:
a. tell you the relative position, within the norm group, of a person’s score.
b. allow you to compare the results of test takers who took the same test but are in different norm groups.
c. allow you to compare the results of the test to other norm-referenced tests taken by the same individuals.
d. allow you to assess whether or not a particular individual has improved in a specific area being tested using
only the results of the one test.
4. Which of the following is the best method for determining the percentile rank regarding a group of scores?
a. Frequency distribution
b. Histogram
c. Frequency polygon
d. Cumulative distribution (ogive curve)
Chapter6—StatisticalConcepts:MakingMeaningOutofRawScores
5. On a negatively skewed curve, which of the following is true?
a. The mean is lower than the mode, which is lower than the median.
b. The mean is lower than the median, which is lower than the mode.
c. The mode is lower than the mean, which is lower than the median.
d. The median is lower than the mode, which is lower than the mean.
e. The mean, median, and mode is the same.
6. On a positively skewed curve, which is true?
a. The mode is lower than the mean, which is lower than the median.
b. The median is lower than the mode, which is lower than the mean.
c. The mean is lower than the median, which is lower than the mode.
d. The mode is lower than the median, which is lower than the mean.
e. The mean, median, and mode is the same.
7. On a normally distributed curve, which is true?
a. The mode is lower than the mean, which is lower than the median.
b. The median is lower than the mode, which is lower than the mean.
c. The mean is lower than the median, which is lower than the mode.
d. The mode is lower than the median, which is lower than the mean.
e. The mean, median, and mode are the same.
8. What is the mean of the following group of scores: 4, 7, 8, 8, 9, 10, 12, and 14?
a. 8
b. 8.5
c. 9
d. 9.5
e. None of these
9. What is the median of the following groups of scores: 4, 7, 8, 8, 9, 10, 12, and 14?
a. 8
b. 8.5
c. 9
d. 9.5
e. None of these
10. What is the mode of the following groups of scores: 4, 7, 8, 8, 9, 10, 12, and 14?
a. 8
b. 8.5
c. 9
d. 9.5
e. None of these
11. What is the range of the following groups of scores: 4, 7, 8, 8, 9, 10, 12, and 14?
a. 8
b. 8.5
c. 9
d. 10
e. 11
12. What is the interquartile range of the following groups of scores?
4788
14 12 10 9
8874
910 12 14
a. 6.5 – 9.5
b. 7.0 – 10.0
c. 7.5 – 10.5
d. 8.0 – 10.5
e. 1.5 – 3.0
13. What is the standard deviation of the following groups of scores?
4788
14 12 10 9
8874
910 12 14
a. 2.87
b. 3.0
c. 5.66
d. 10.58
e. None of these
14. Histograms and frequency polygons are visual representations of frequency distributions.
a. True
b. False
15. A histogram is the preferred method over the cumulative distribution for conveying information about the percentile
rank.
a. True
b. False
16. On negatively skewed curves, the mean is lower than the median, which is lower than the mode.
a. True
b. False
17. Measures of central tendency tell you something about the middle of a series of numbers but hardly anything about
the variability of a set of numbers.
a. True
b. False
18. If an individual takes a test, and if you know an individual’s raw score, the mean of the group of individuals who took
the test, and the standard deviation of the group, you can tell the relative position of the individual within his or her
group.
a. True
b. False
19. Approximately 84 percent of people do higher than 1 standard deviation below the mean.
a. True
b. False
20. Approximately 2 percent of people do lower than 3 standard deviations below the mean.
a. True
b. False
21. On all normally distributed curves, the mean, median, and mode are the same.
a. True
b. False
22. A group of graduate students studying psychology take a national comprehensive exam. On the test, their mean
score is about 0.5 standard deviation above the mean as compared to the national score. The variability of their
scores is less than the national mean. If passing is 1 standard deviation below the mean, it is likely that many have
failed.
a. True
b. False
Exhibit 6-1
18 13 10 16 14
13 17 15 13 11
14 14 11 10 12
12 11 13 15 9
12 13 16 815
23. Refer to Exhibit 6-1. Create a frequency distribution from the set of scores.
24. Using the numbers in Exhibit 6-1, if you want to end up with four bars on your histogram, how many numbers should
be in each interval?
25. Using the numbers in Exhibit 6-1, draw a frequency distribution using class intervals of 3.
Chapter6—StatisticalConcepts:MakingMeaningOutofRawScores
26. Using the numbers in Exhibit 6-1, draw a histogram using class intervals of 3.
27. Using the numbers in Exhibit 6-1, draw a frequency polygon using class intervals of 3.
28. Using the numbers in Exhibit 6-1, draw a cumulative distribution (ogive curve) using class intervals of 3.
29. Using the numbers in Exhibit 6-1, determine the mean.
30. Using the numbers in Exhibit 6-1, determine the median.
31. Using the numbers in Exhibit 6-1, determine the mode.
32. Using the numbers in Exhibit 6-1, determine the range.
33. Using the numbers in Exhibit 6-1, determine the interquartile range.
34. Using the numbers in Exhibit 6-1, determine the standard deviation.
Exhibit 6-2
In order to evaluate a graduate program in counseling, a decision is made to compare the scores of the recent
graduates on the National Counseling Exam (NCC) to the national norms. Therefore, the program decides to
compare its current graduates with the all graduates nationally who took the exam. Their scores of the current
graduates are as follows:
20 25 21 22 23 22
22 29 18 23 26 12
24 27 27 26 16 29
18 32 22 17 33 31
35. Refer to Exhibit 6-2. Find the mean.
36. Refer to Exhibit 6-2. Find the median.
37. Refer to Exhibit 6-2. Find the mode.
38. Refer to Exhibit 6-2. Find the range.
39. Refer to Exhibit 6-2. Find the interquartile range.
40. Refer to Exhibit 6-2. Find the standard deviation.
Chapter6—StatisticalConcepts:MakingMeaningOutofRawScores
41. Refer to Exhibit 6-2. Draw a frequency distribution.
42. Using the information in Exhibit 6-2, if you want to end up with six bars on your histogram, how many numbers
should be in each interval?
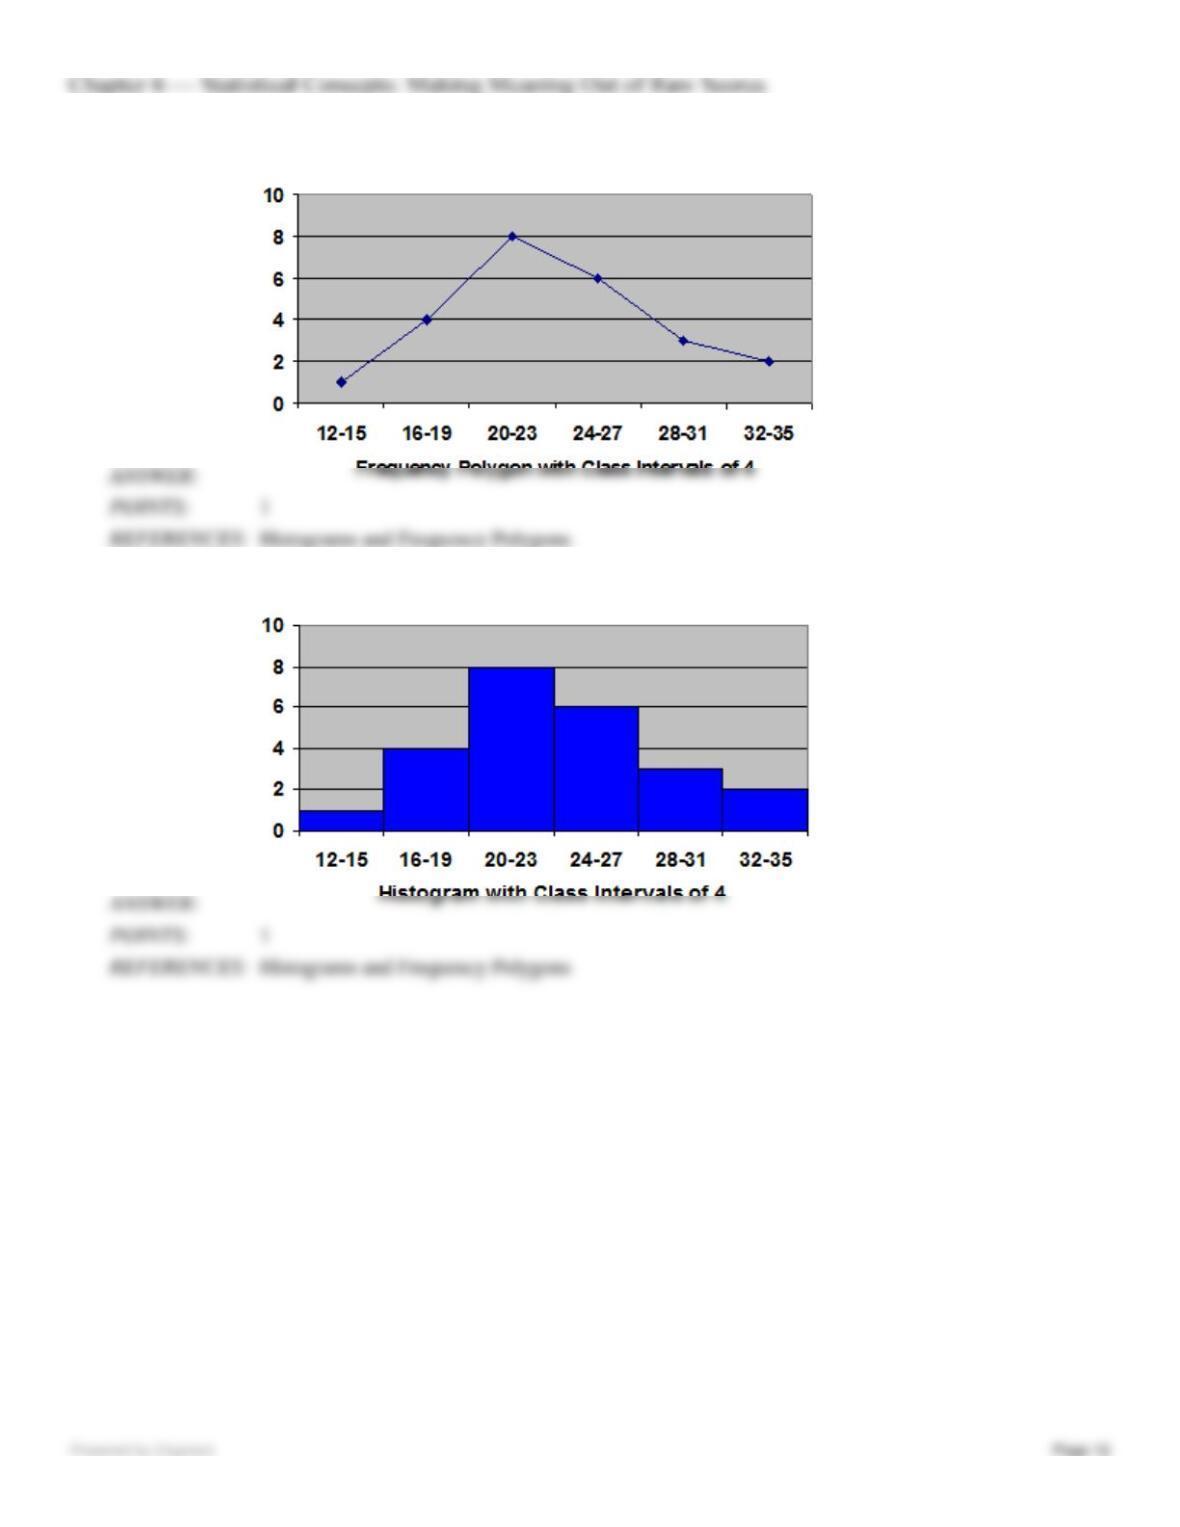
43. Refer to Exhibit 6-2. Draw a frequency polygon using class intervals of 4.
44. Refer to Exhibit 6-2. Draw a histogram using your class interval frequency distribution of 4.
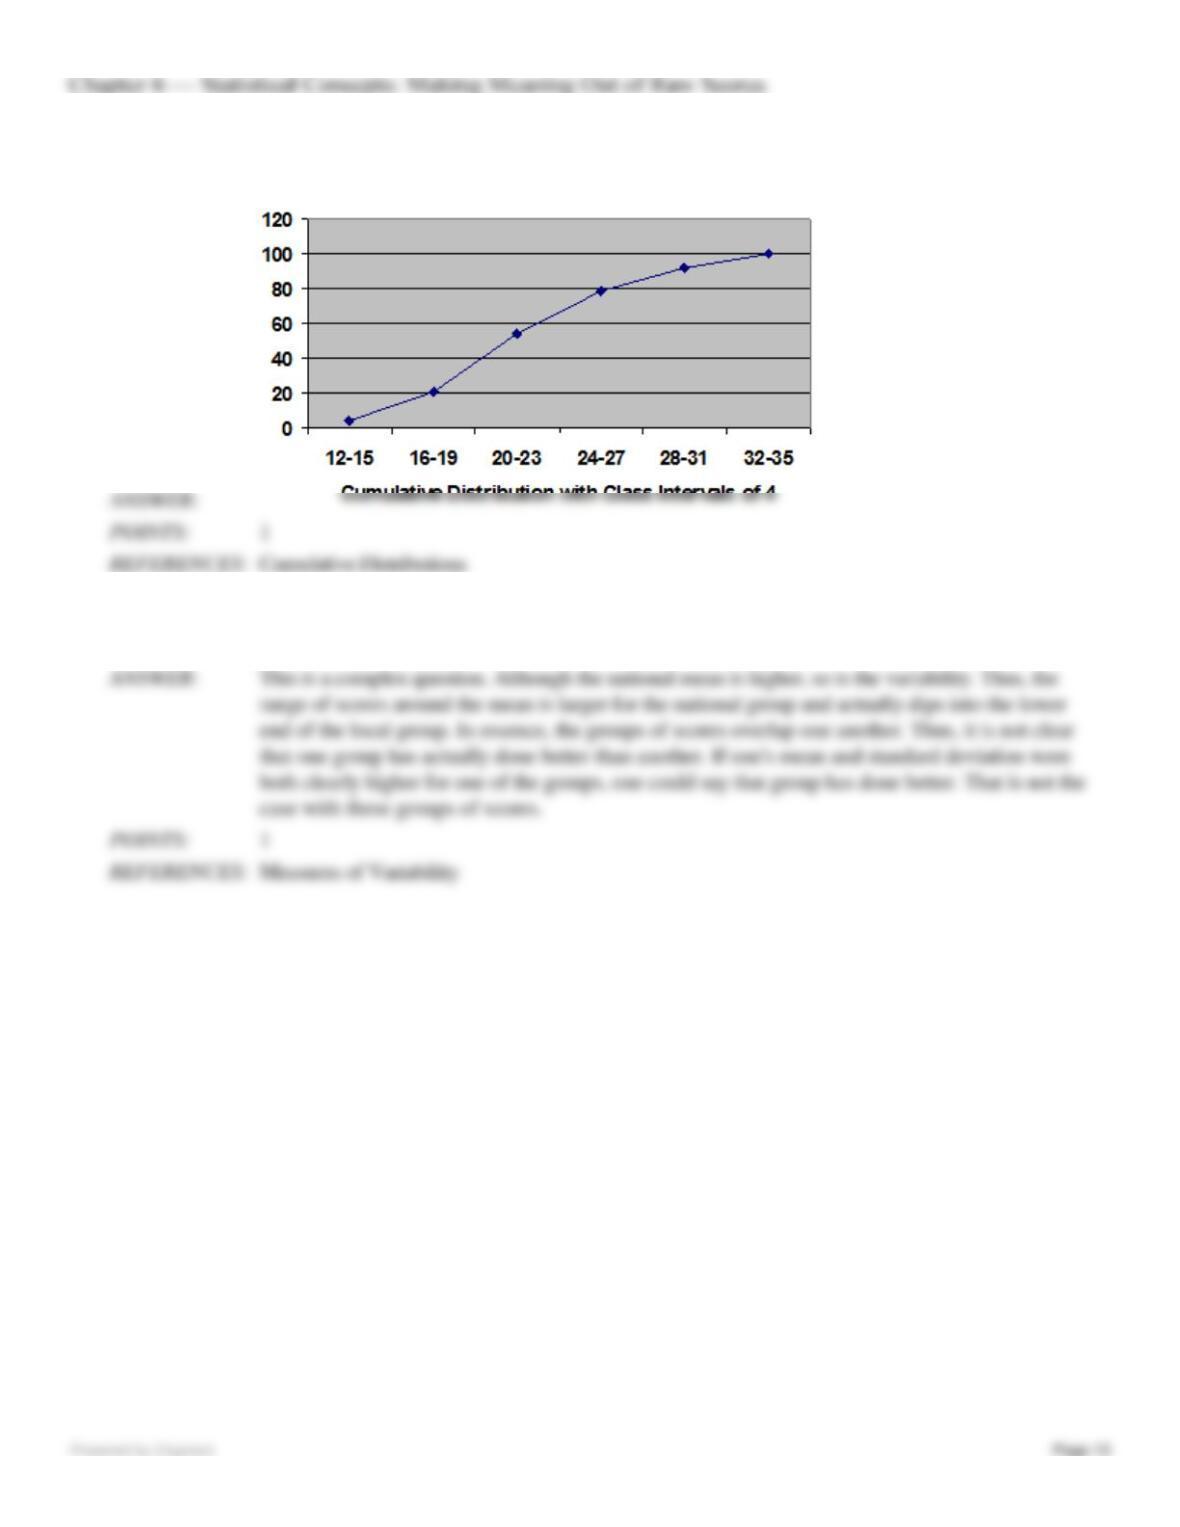
45. Refer to Exhibit 6-2. Draw a cumulative distribution (ogive curve) using your class interval frequency distribution of
4.
46. Use the data from Exhibit 6-2. If the national mean is 25, and the standard deviation is 8, who has done better: the
graduate program or the national group?