148. On the basis of the following data, determine the value of the inventory at the lower of cost or market.
Apply lower of cost or market to each inventory item. Show your work.
Item
Inventory Quantity
Unit Cost Price
Unit Market Price
Product C
420
$6
$5
Product D
370
12
14
149. On the basis of the following data, determine the value of the inventory at the lower of cost or market.
Apply lower of cost or market to each inventory item. Show your work.
Item
Inventory Quantity
Unit Cost Price
Unit Market Price
Gear X
100
$33
$29
Gear Y
75
27
28
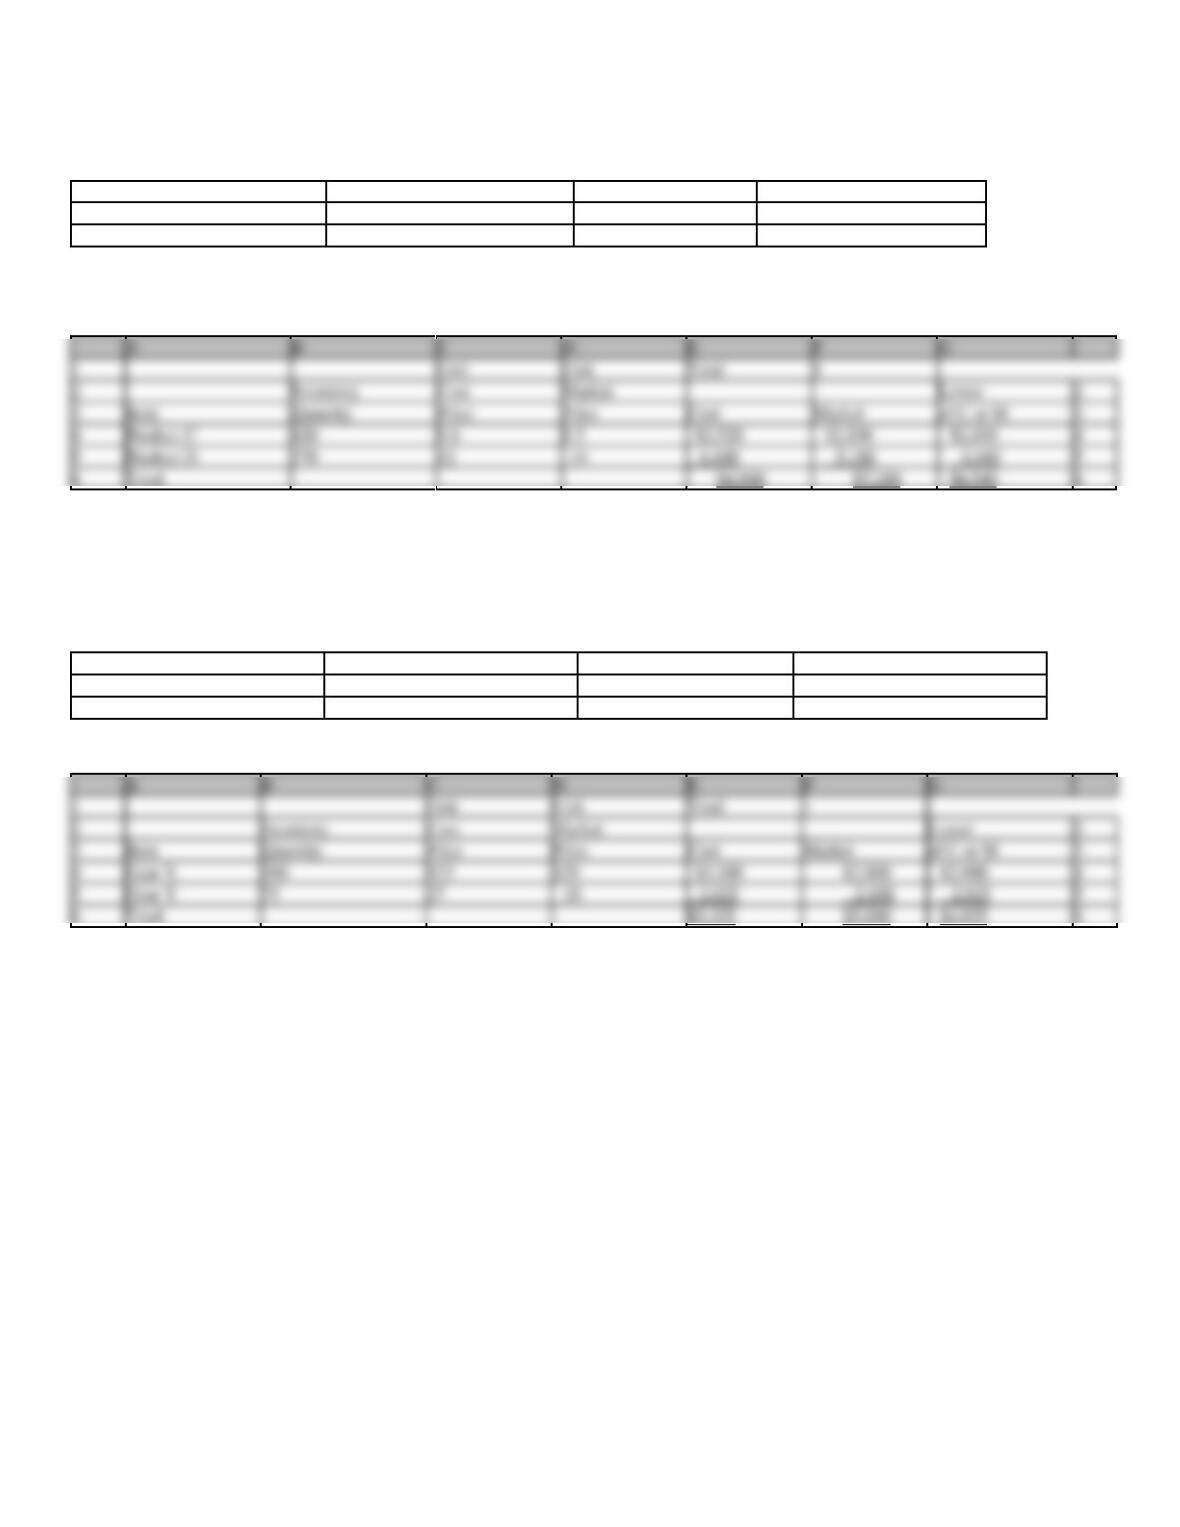
A
B
C
D
E
F
G
1
Unit
Unit
Total
1
2
Inventory
Cost
Market
Lower
2
3
Item
Quantity
Price
Price
Cost
Market
of C or M
3
4
Gear X
100
$33
$29
$3,300
$2,900
$2,900
4
5
Gear Y
75
27
28
2,025
2,100
2,025
5
6
Total
$5,325
$5,000
$4,925
6
A
B
C
D
E
F
G
1
Unit
Unit
Total
1
2
Inventory
Cost
Market
Lower
2
3
Item
Quantity
Price
Price
Cost
Market
of C or M
3
4
Product C
420
$ 6
$ 5
$2,520
$2,100
$2,100
4
5
Product D
370
12
4,440
5,180
4,440
5
150. The following data were taken from the annual reports of Jong Inc., a manufacturer of fireworks, and
Hobson Inc., a manufacturer of computers.
Jong, Inc.
Hobson, Inc.
Cost of Goods Sold
$830,000
$11,540,000
Inventory, end of year
$185,000
315,000
Inventory, beginning of year
$235,000
155,000
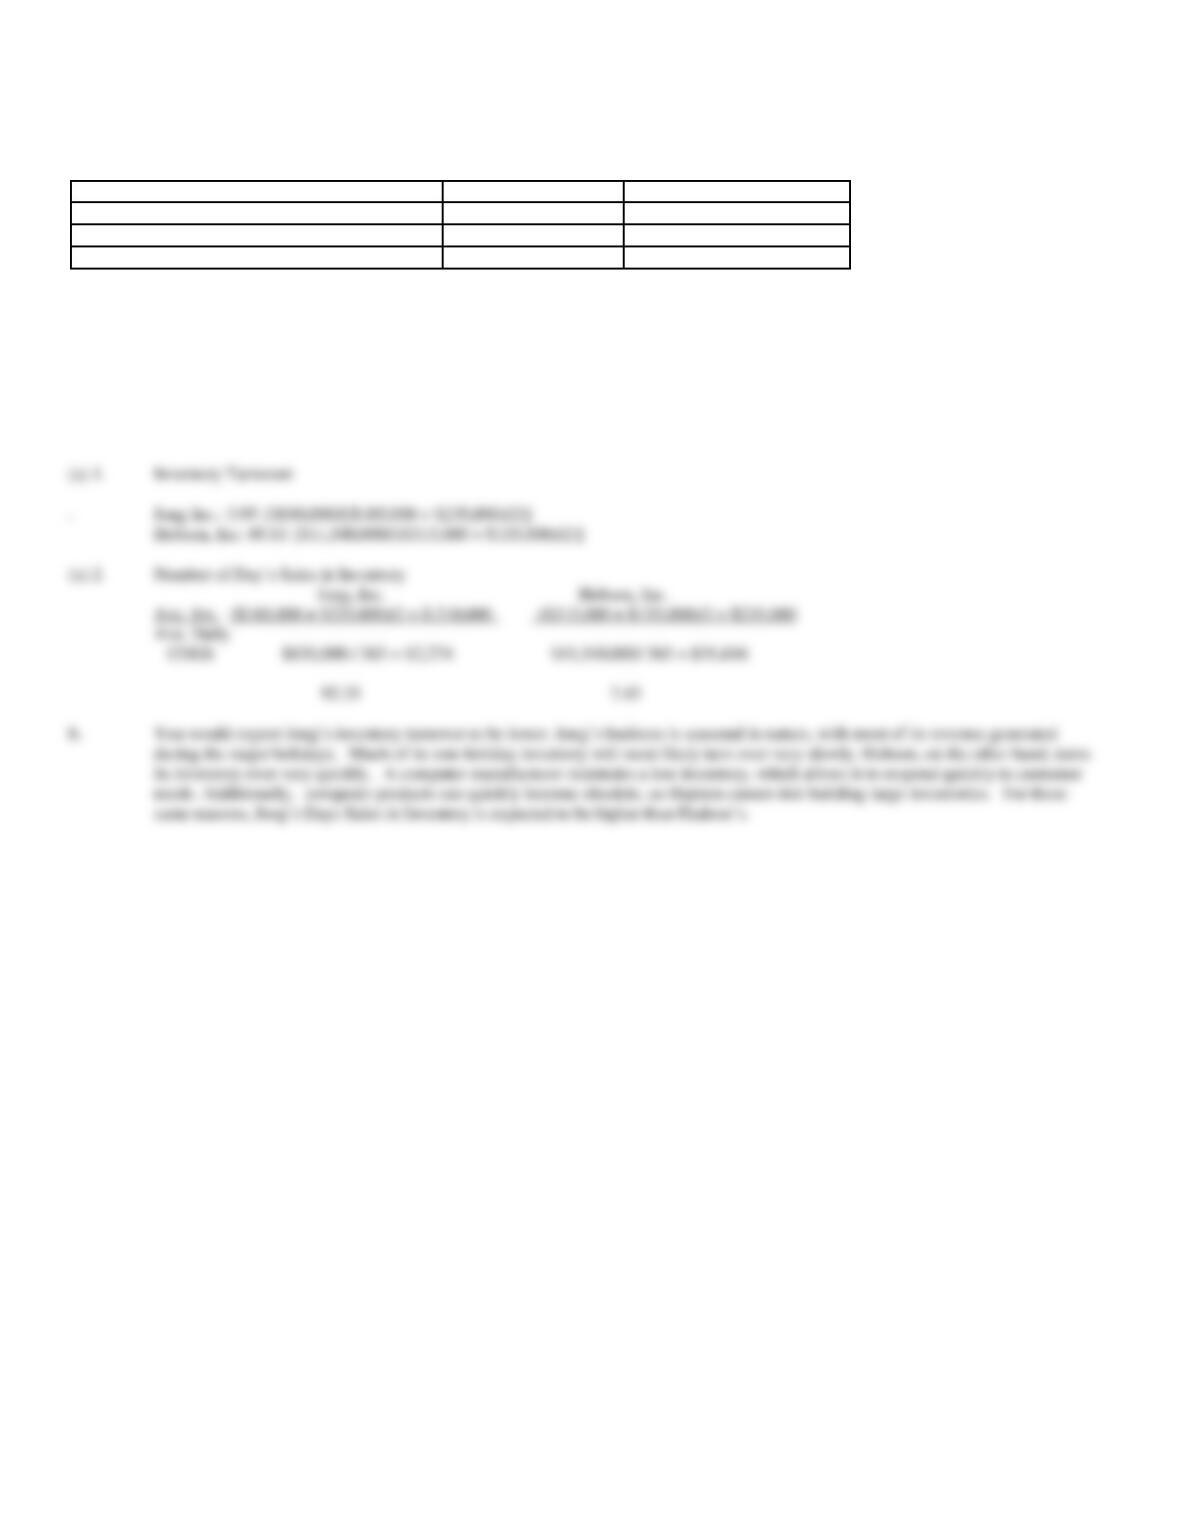
(a) Determine the (1) inventory turnover and (2) number of day’s sales in inventory for Jong and Hobson. Round your answer to two decimal places.
(b) How would you expect these measures to compare between the companies? Why?
(a) 1.
Inventory Turnover:
.
Jong Inc.: 3.95 {$830,000/[($185,000 + $235,000)/2]}
Hobson, Inc: 49.11 {$11,540,000/[($315,000 + $155,000)/2]}
(a) 2.
Number of Day’s Sales in Inventory
Jong, Inc. Hobson, Inc.
Ave. Inv. ($185,000 + $235,000)/2 = $ 210,000 ($315,000 + $155,000)/2 = $235,000
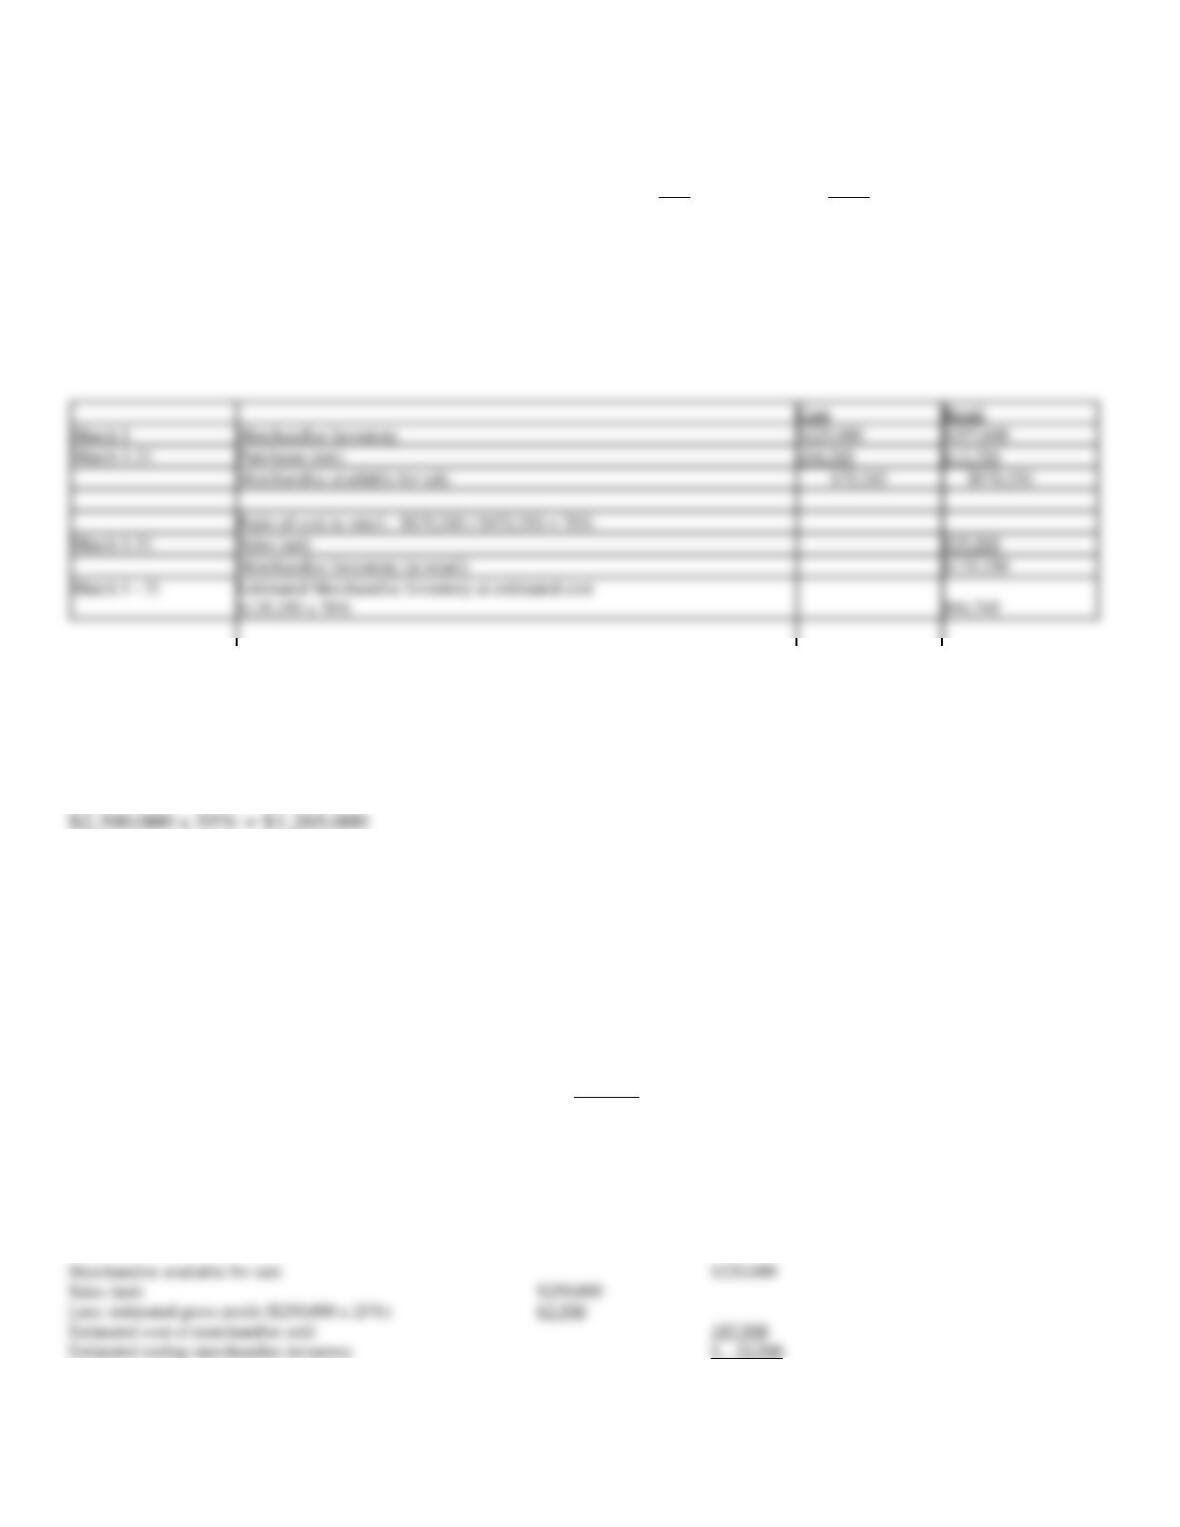
151. Based on the following data, calculate the estimated cost of the merchandise inventory on March 31 using
the retail method.
Cost
Retail
March 1
Merchandise Inventory
$225,000
$357,600
March 1-31
Purchases (net)
454,245
612,750
March 1-31
Sales (net)
835,000
152. A business using the retail method of inventory costing determines that merchandise inventory at retail is
$2,300,000. If the ratio of cost to retail price is 55%, what is the amount of inventory to be reported on the
financial statements?
153. Based upon the following data estimate the cost of ending merchandise inventory:
Sales (net)
$250,000
Estimated gross profit rate
25%
Beginning merchandise inventory
$9,000
Purchases (net)
$211,000
Merchandise available for sale
$220,000
Merchandise available for sale
$220,000
Sales (net)
$250,000
Less: estimated gross profit ($250,000 x 25%)
62,500
Cost
Retail
March 1
Merchandise Inventory
$225,000
$357,600
March 1-31
Purchases (net)
454,245
612,750
Ratio of cost to retail: $679,245 / $970,350 = 70%
March 1-31
Sales (net)
835,000
Merchandise Inventory (at retail)
$135,350
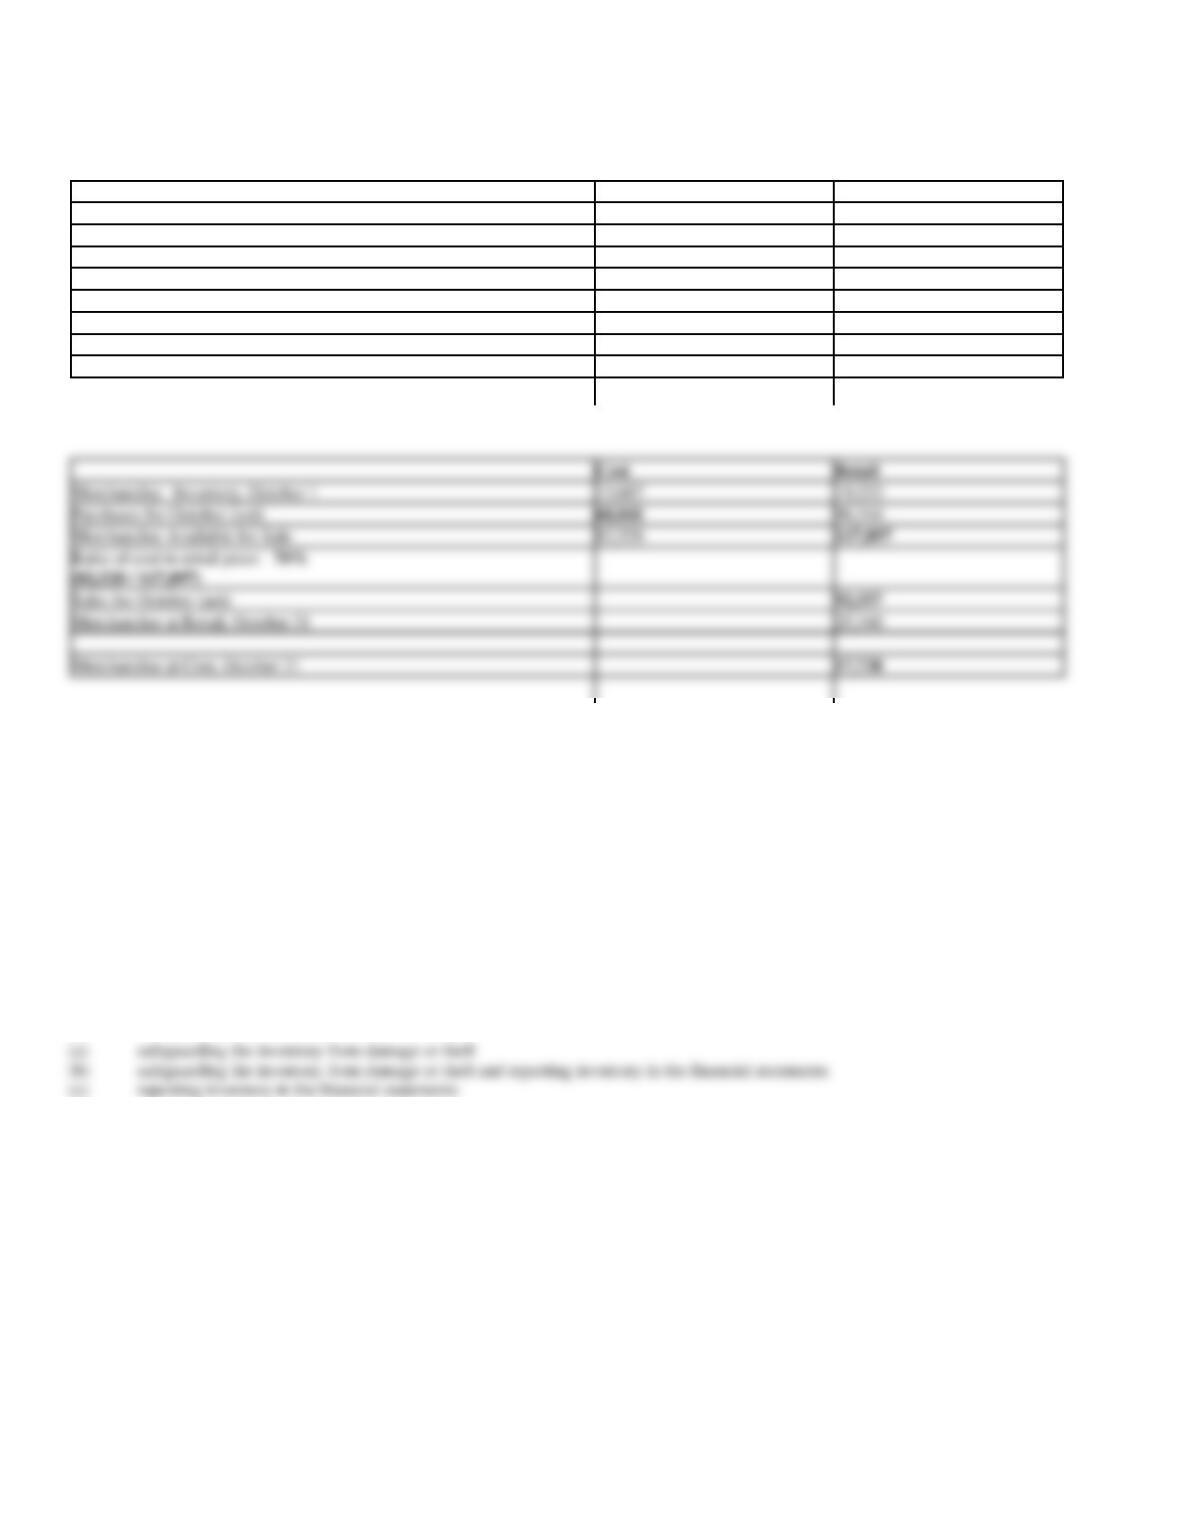
154. Fill in the missing amounts from the chart below regarding the calculation of Bean Corporation’s estimated
inventory using the retail method of estimation.
Cost
Retail
Merchandise Inventory, October 1
13,687
19,553
Purchases for October (net)
?
98,344
Merchandise Available for Sale
82,528
?
Ratio of cost to retail price: ?
Sales for October (net)
?
Merchandise at Retail, October 31
25,340
Merchandise at Cost, October 31
?
155. List the internal control objectives illustrated by the following:
(a)
keeping the inventory storeroom locked
(b)
counting the inventory at the end of the accounting period and comparing it with the inventory ledger clerk’s records
(c)
using subsidiary ledgers and a perpetual inventory system
(a)
safeguarding the inventory from damage or theft
(b)
safeguarding the inventory from damage or theft and reporting inventory in the financial statements
(c)
reporting inventory in the financial statements
Cost
Retail
Merchandise Inventory, October 1
13,687
19,553
Purchases for October (net)
68,841
98,344
Merchandise Available for Sale
82,528
117,897
Sales for October (net)
92,557
Merchandise at Retail, October 31
25,340
Merchandise at Cost, October 31
17,738
156. Describe three inventory cost flow assumptions and how they impact the financial statements.
157. The following data regarding purchases and sales of a commodity were taken from the related perpetual
inventory account:
June 1
Balance
25 units at $60
6
Sale
20 units
8
Purchase
20 units at $61
16
Sale
10 units
20
Purchase
20 units at $62
23
Sale
25 units
30
Purchase
15 units at $63
Calculate the cost of the ending inventory at June 30, using (1) the first-in, first-out (FIFO) method and (2) the last-in, first-out (LIFO)
method. Identify the quantity, unit price, and total cost of each lot in the inventory.
(1)
June 20
10 units at $62
$ 620
30
15 units at $63
945
Total
$1,565
(2)
June 1
5 units at $60
$ 300
8
5 units at $61
30
15 units at $63
945
Total
$1,550
158. Beginning inventory, purchases and sales data for hammers are as follows:
Mar 3
Inventory
12 units
@
$15
11
Purchase
13 units
@
$17
14
Sale
18 units
21
Purchase
9 units
@
$20
25
Sale
10 units
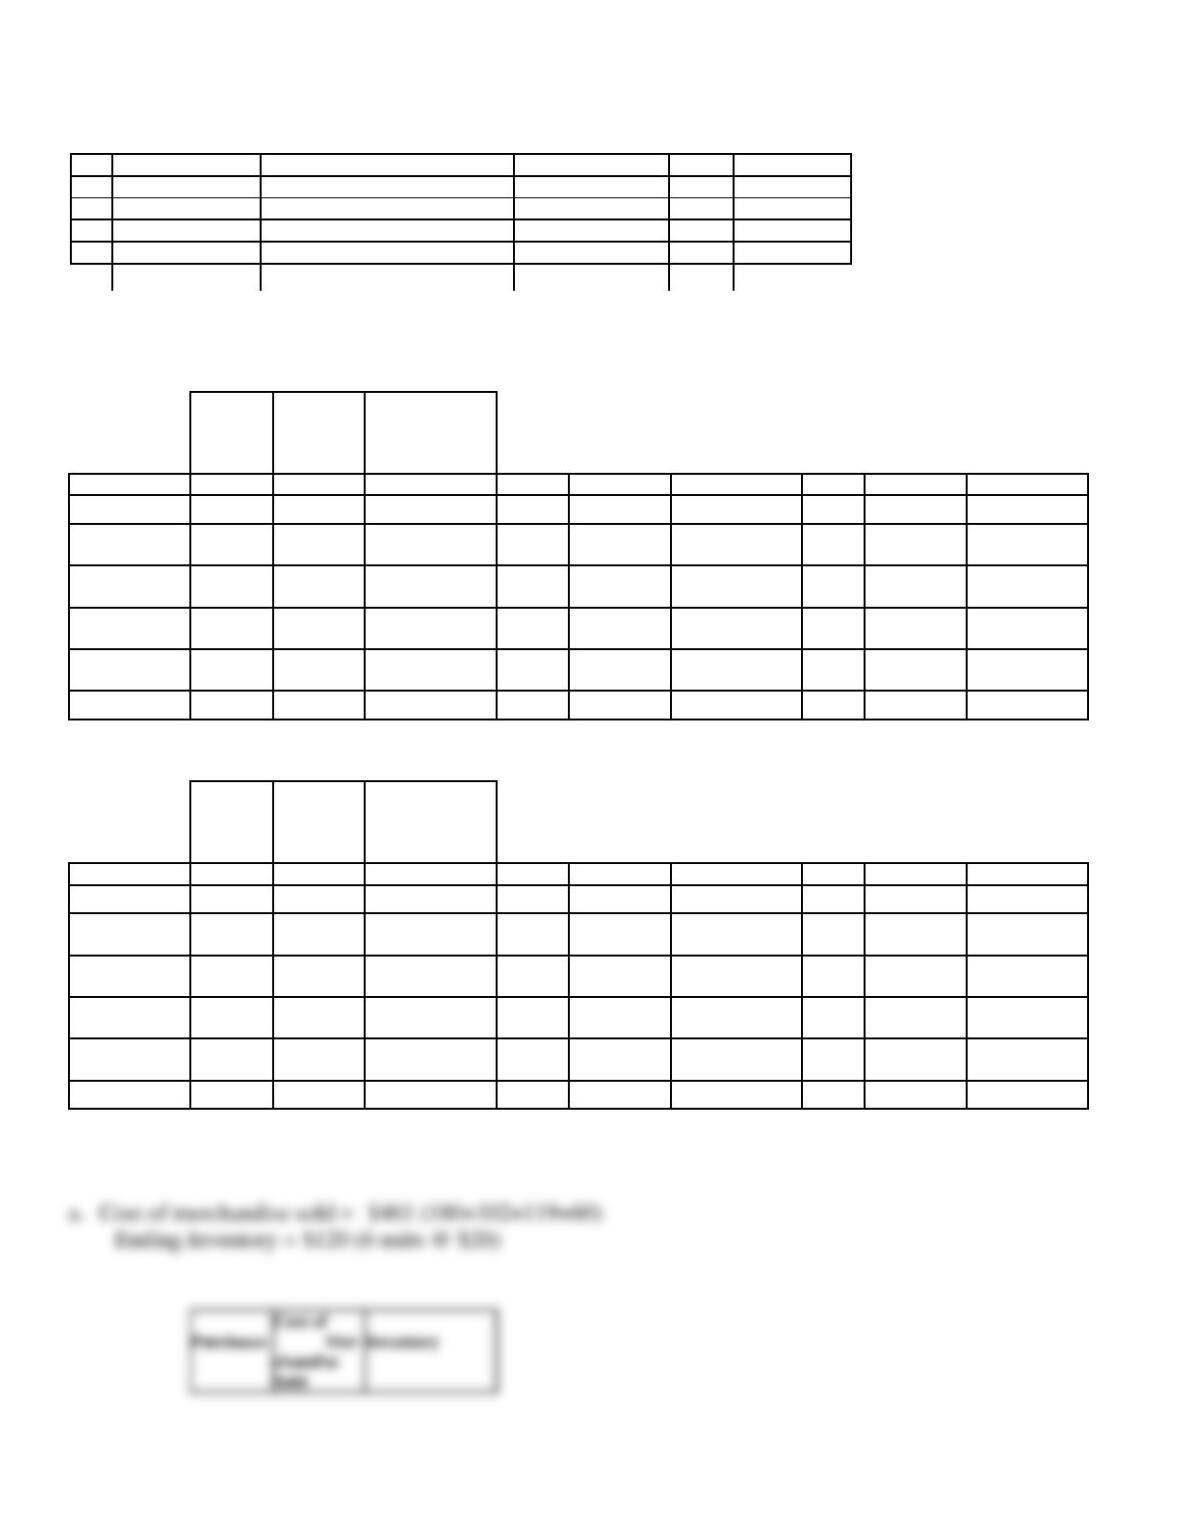
Assuming the business maintains a perpetual inventory system, complete the inventory cards and calculate the cost of merchandise sold and ending
inventory under the following assumptions:
a. First-in, first-out
Purchases
Cost of
Merc
handise
Sold
Inventory
Date
Qty
Unit Cost
Total Cost
Qty
Unit Cost
Total Cost
Qty
Unit Cost
Total Cost
Mar 3
Mar 11
Mar 14
Mar 21
Mar 25
Balances
b. Last-in, first-out
Purchases
Cost of
Mer
chandise
Sold
Inventory
Date
Qty
Unit Cost
Total Cost
Qty
Unit Cost
Total Cost
Qty
Unit Cost
Total Cost
Mar 3
Mar 11
Mar 14
Mar 21
Mar 25
Balances
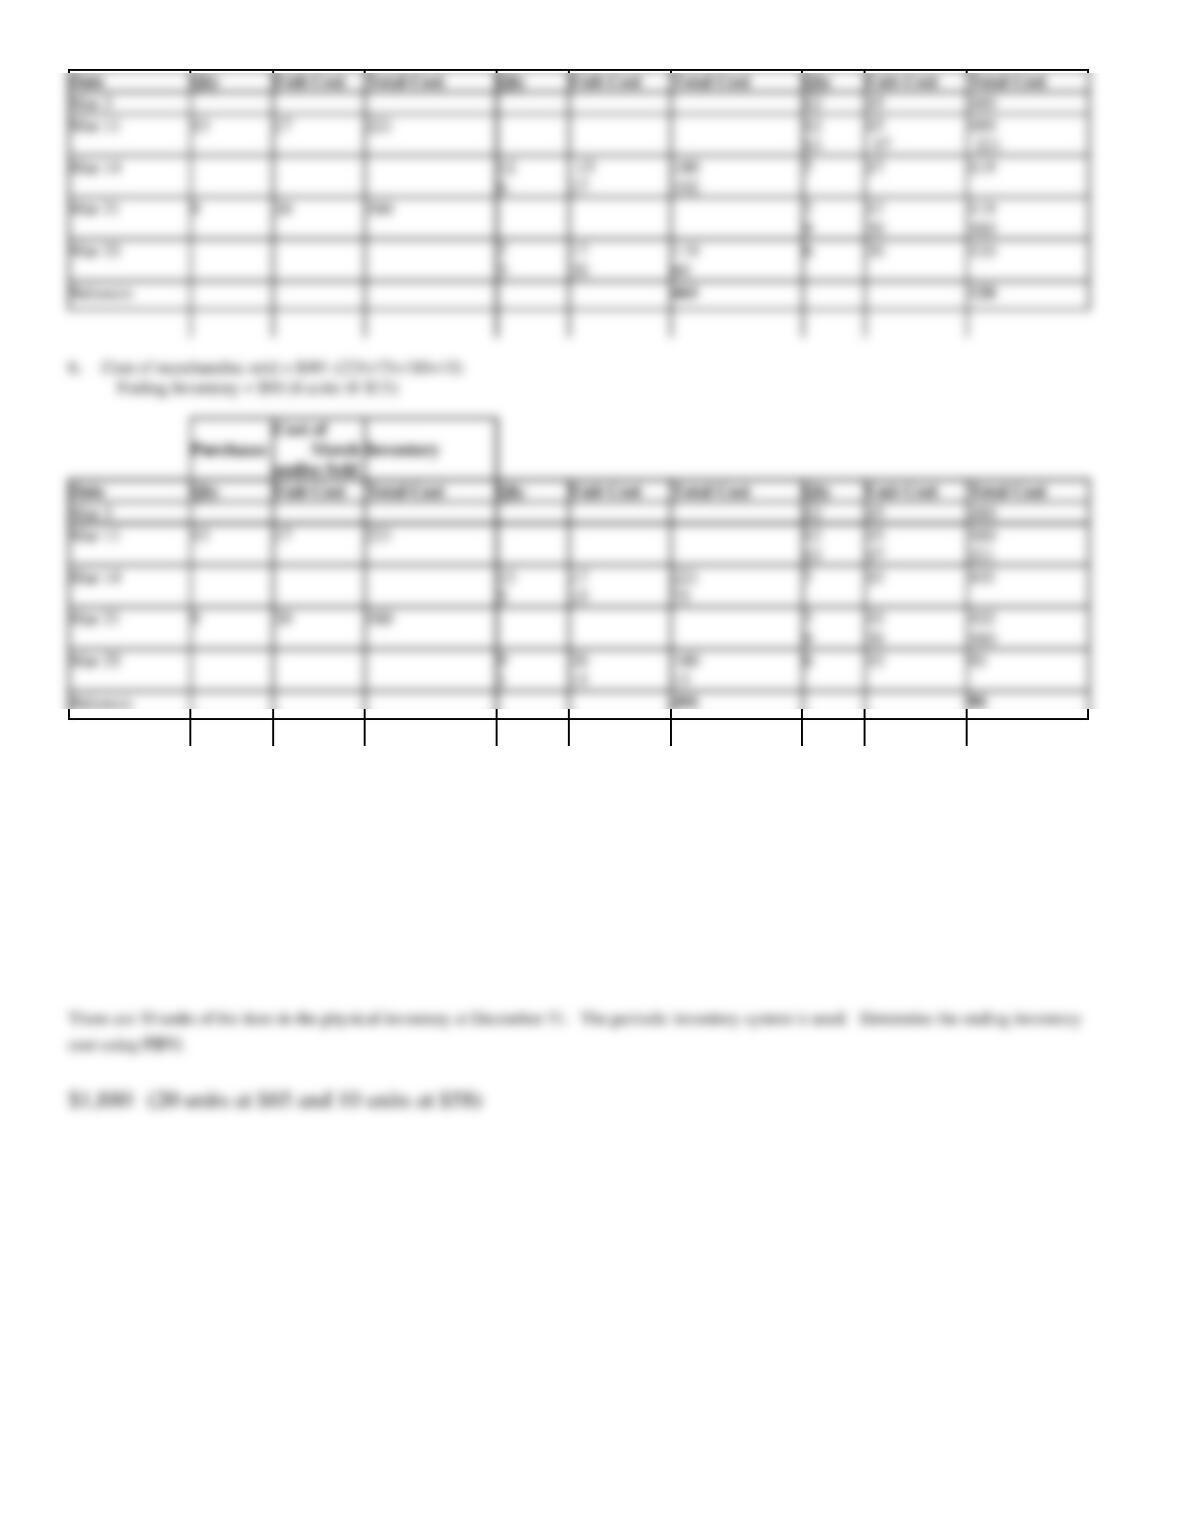
159. The units of an item available for sale during the year were as follows:
Jan. 1
Inventory
25 units at $45
Mar. 4
Purchase
15 units at $50
June 7
Purchase
35 units at $58
Nov. 15
Purchase
20 units at $65
Mar 3
Mar 3
160. The units of an item available for sale during the year were as follows:
Jan. 1
Inventory
10 units at $25
Apr. 4
Purchase
15 units at $24
May. 20
Purchase
20 units at $28
Oct. 30
Purchase
18 units at $30
161. The beginning inventory and purchases of an item for the period were as follows:
Beginning inventory
6 units at $70 each
First purchase
10 units at $75 each
Second purchase
18 units at $80 each
Third purchase
10 units at $85 each
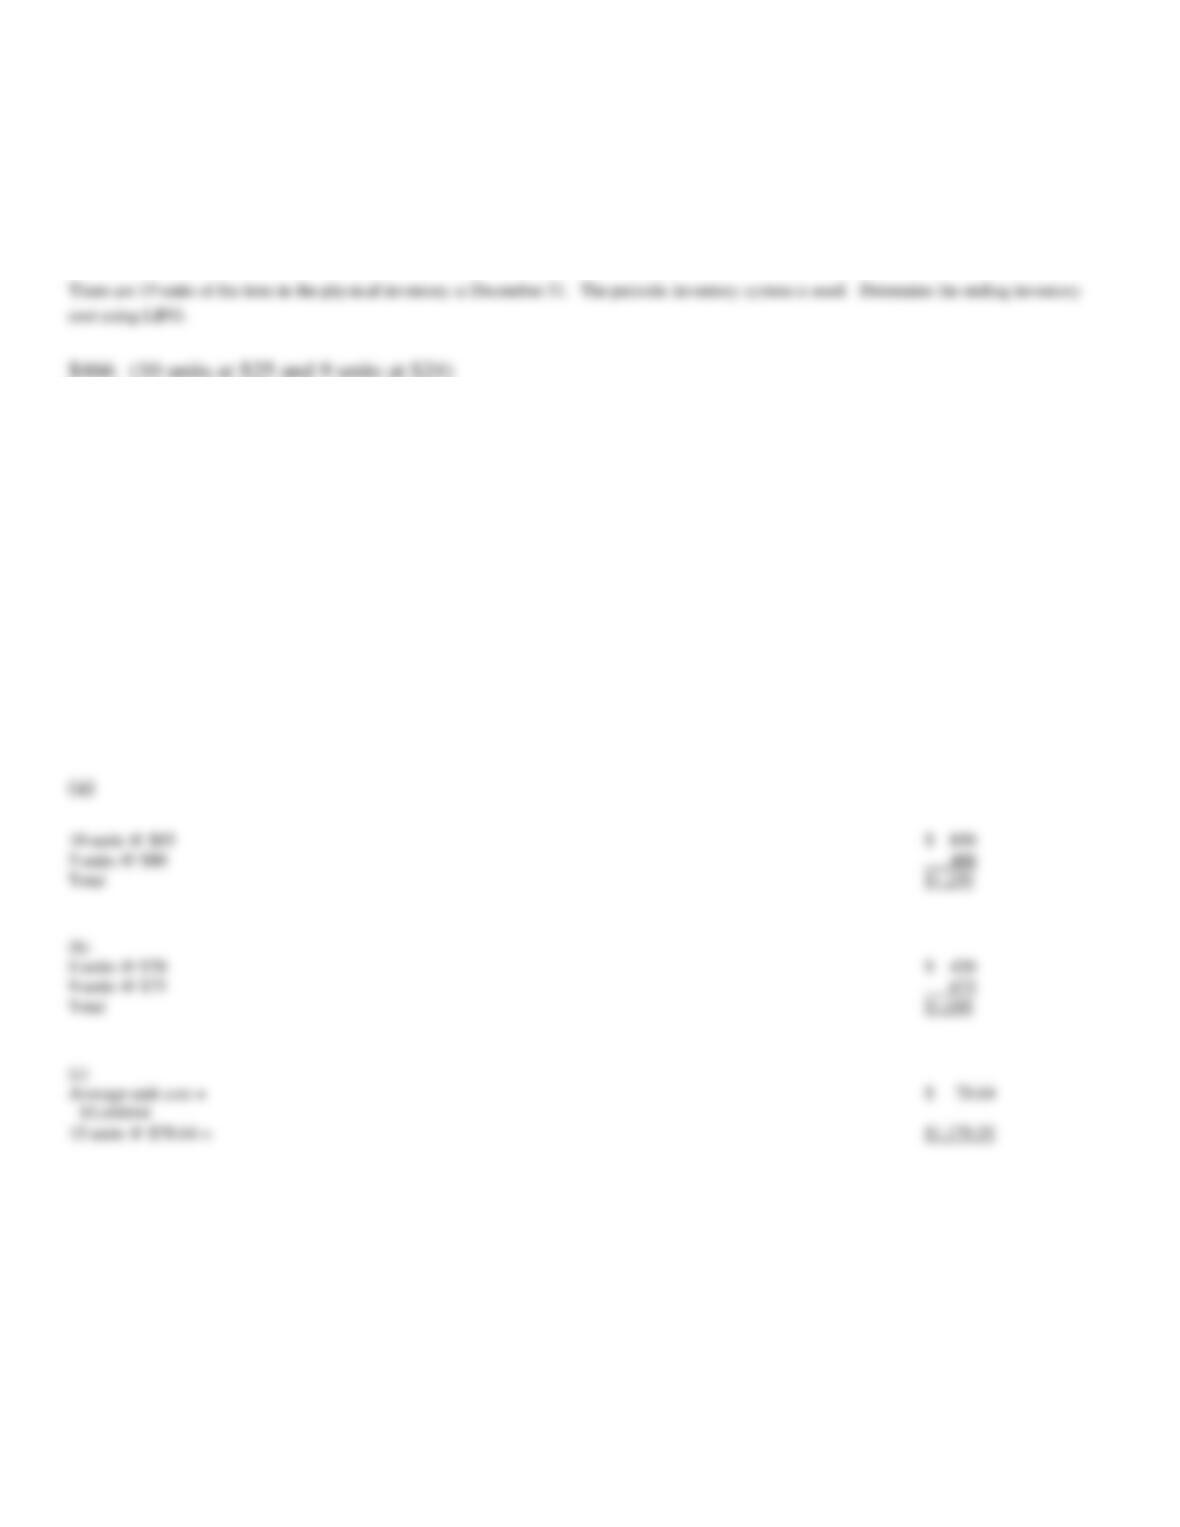
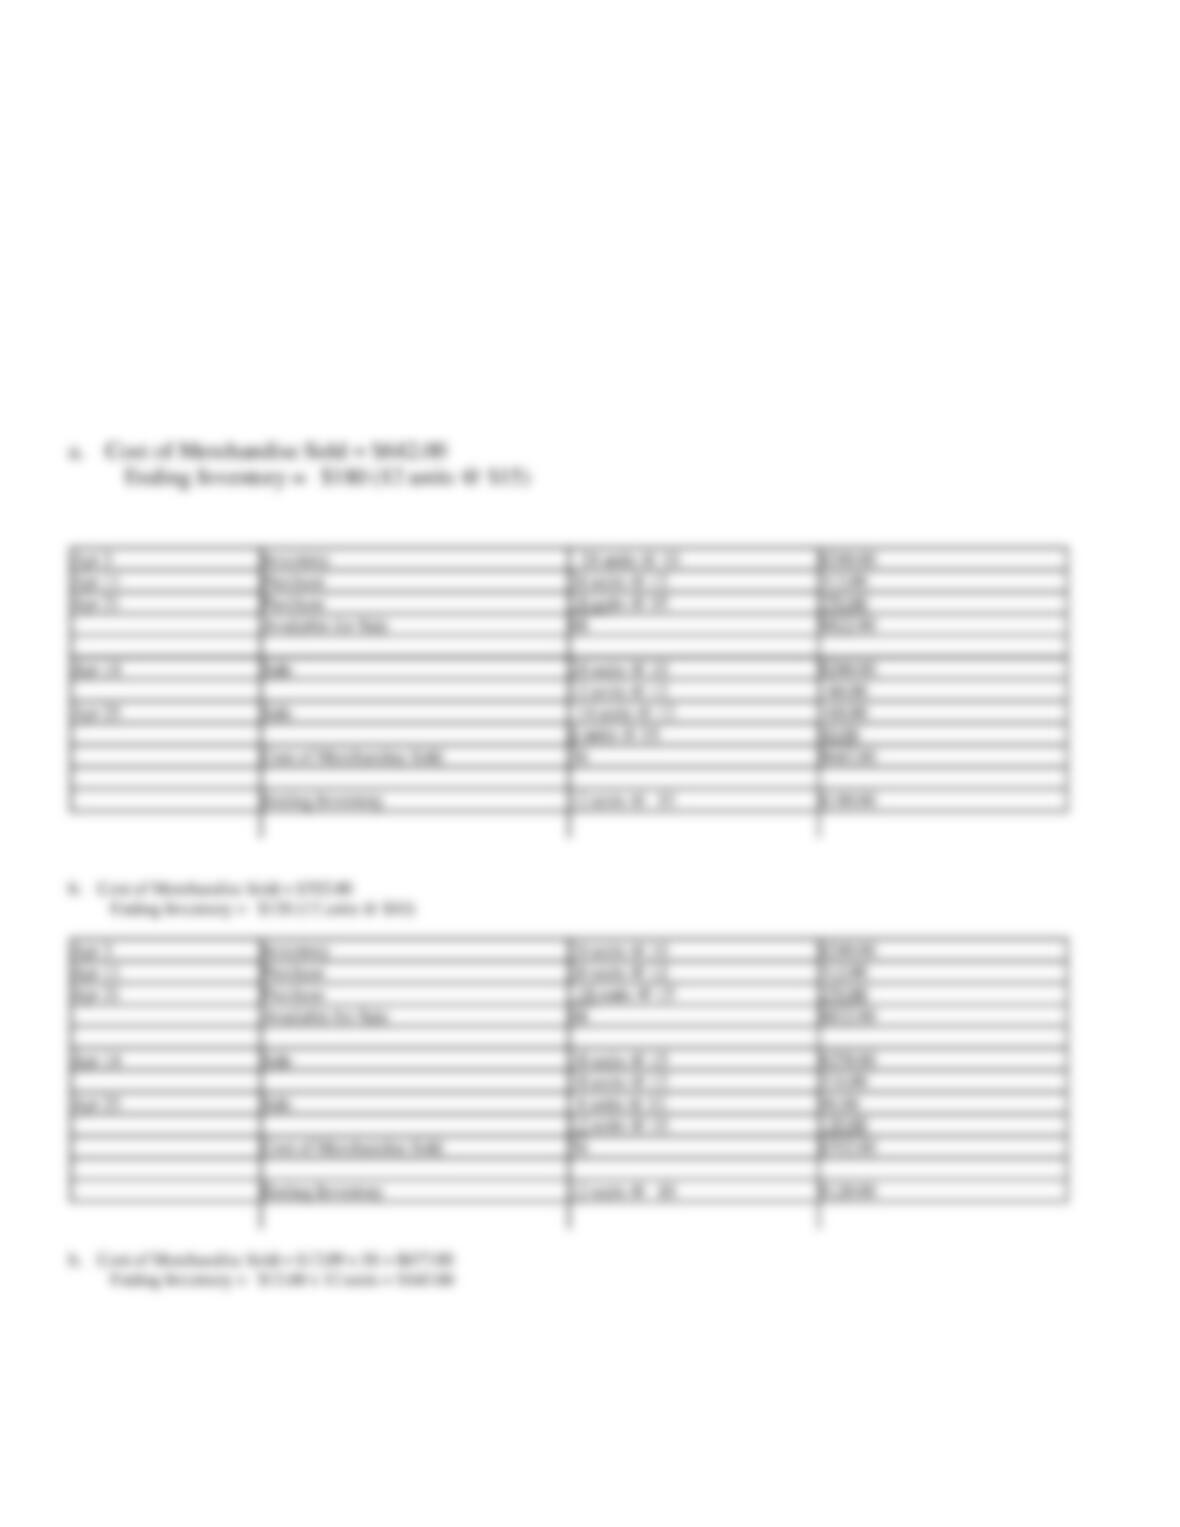
The company uses the periodic system, and there were 15 units in the inventory at the end of the period. Determine the cost of the 15 units in the
inventory by each of the following methods, presenting details of your computations: (a) first-in, first-out; (b) last-in, first-out; (c) average cost. Do
not round your intermediate calculations. Round your final answer to two decimal places.
10 units @ $85
$ 850
5 units @ $80
400
Total
$1,250
6 units @ $70
$ 420
9 units @ $75
675
Total
$1,095
Average unit cost =
$ 78.64
$3,460/44
15 units @ $78.64 =
$1,179.55
162. Beginning inventory, purchases and sales data for T-shirts are as follows:
Apr 3
Inventory
24 units
@
$10
11
Purchase
26 units
@
$12
14
Sale
36 units
21
Purchase
18 units
@
$15
25
Sale
20 units
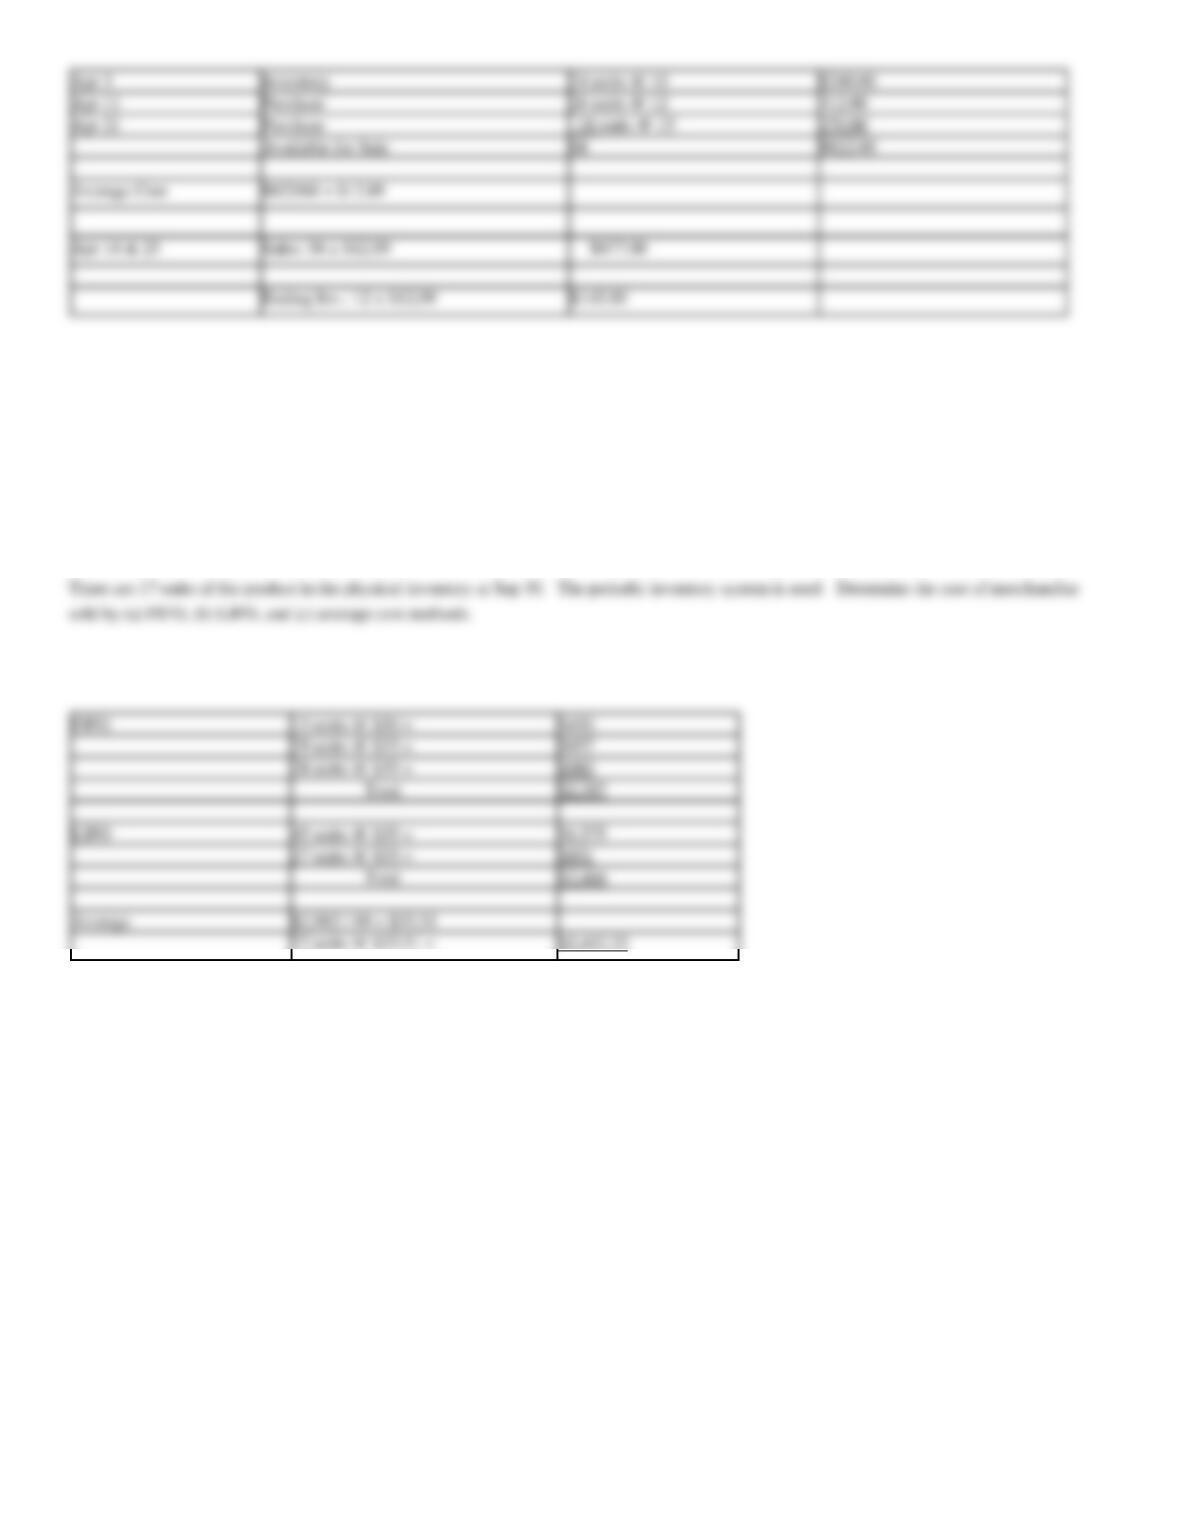
Assuming the business maintains a periodic inventory system, calculate the cost of merchandise sold and ending inventory under the following
assumptions:
a. FIFO
b. LIFO
c. Average cost (round cost of merchandise sold and ending inventory to the nearest dollar)
Apr 3
Inventory
24 units @ 10
$240.00
Apr 11
Purchase
26 units @ 12
312.00
Apr 21
Purchase
18 units @ 15
270.00
Available for Sale
68
$822.00
Apr 14
Sale
24 units @ 10
$240.00
12 units @ 12
144.00
Apr 25
Sale
14 units @ 12
168.00
6 units @ 15
90.00
Cost of Merchandise Sold
56
$642.00
Apr 3
Inventory
24 units @ 10
$240.00
Apr 11
Purchase
26 units @ 12
312.00
Apr 21
Purchase
270.00
Available for Sale
68
$822.00
Apr 14
Sale
18 units @ 15
$270.00
18 units @ 12
216.00
Apr 25
Sale
8 units @ 12
96.00
Cost of Merchandise Sold
56
$702.00
Ending Inventory
12 units @ 10
$120.00
163. The units of Product Green-2 available for sale during the year were as follows:
Apr 1
Inventory
15 units
@
$30
Jun 16
Purchase
29 units
@
$33
Sep 28
Purchase
45 units
@
$35
FIFO
15 units @ $30 =
$450
29 units @ $33 =
$957
28 units @ $35 =
$980
Total
$2,387
LIFO
45 units @ $35 =
$1,575
27 units @ $33 =
$891
Total
$2,466
Average
$2,982 / 89 = $33.51
Apr 3
Inventory
24 units @ 10
$240.00
Apr 11
Purchase
26 units @ 12
312.00
Apr 21
Purchase
270.00
Available for Sale
68
$822.00
164. Brutus Corporation, a newly formed corporation, has the following transactions during May, 2011, it’s first
month of operation.
May 1
Purchased 500 units @ $25.00 each
May 4
Purchased 300 units @ $24.00 each
May 6
Sold 400 units @ $38.00 each
May 8
Purchased 700 units @ $23.00 each
May 13
Sold 450 units @ $37.50 each
May 20
Purchased 250 units @ $25.25 each
May 22
Sold 275 units @ $36.00 each
May 27
Sold 300 units @ $37.00 each
May 28
Purchased 550 units @ $26.00 each
May 30
Sold 100 units @ $39.00 each
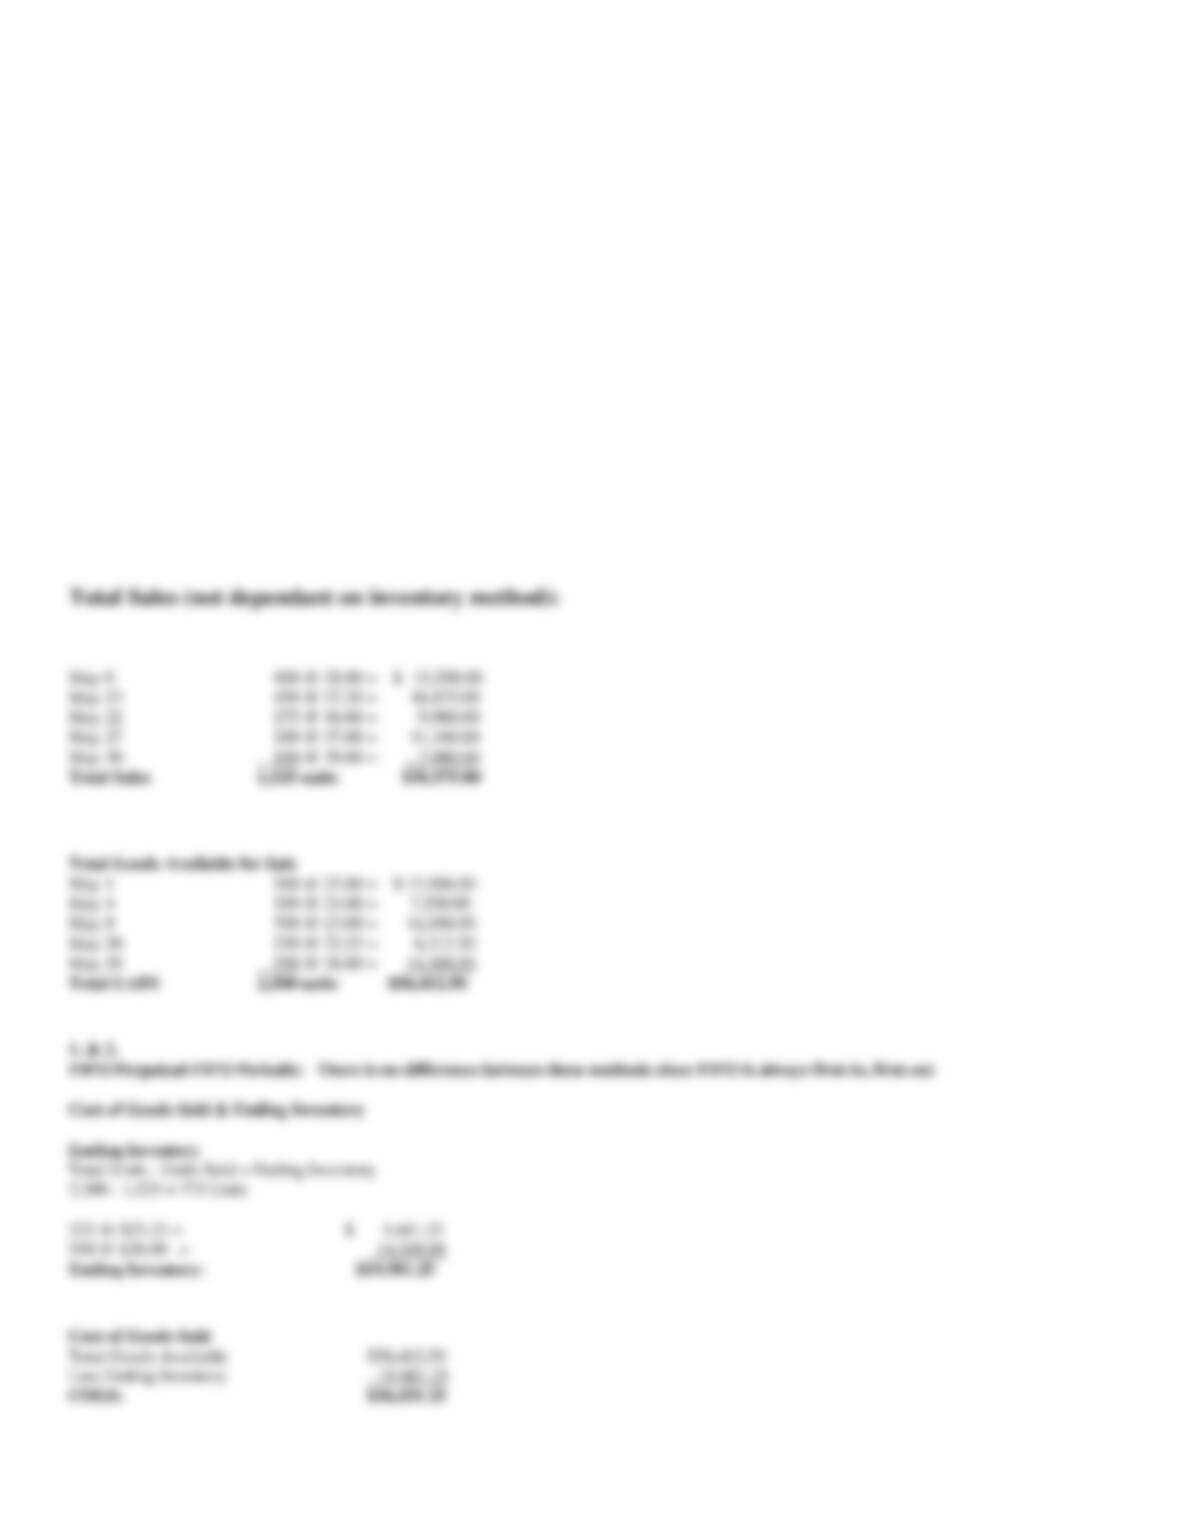
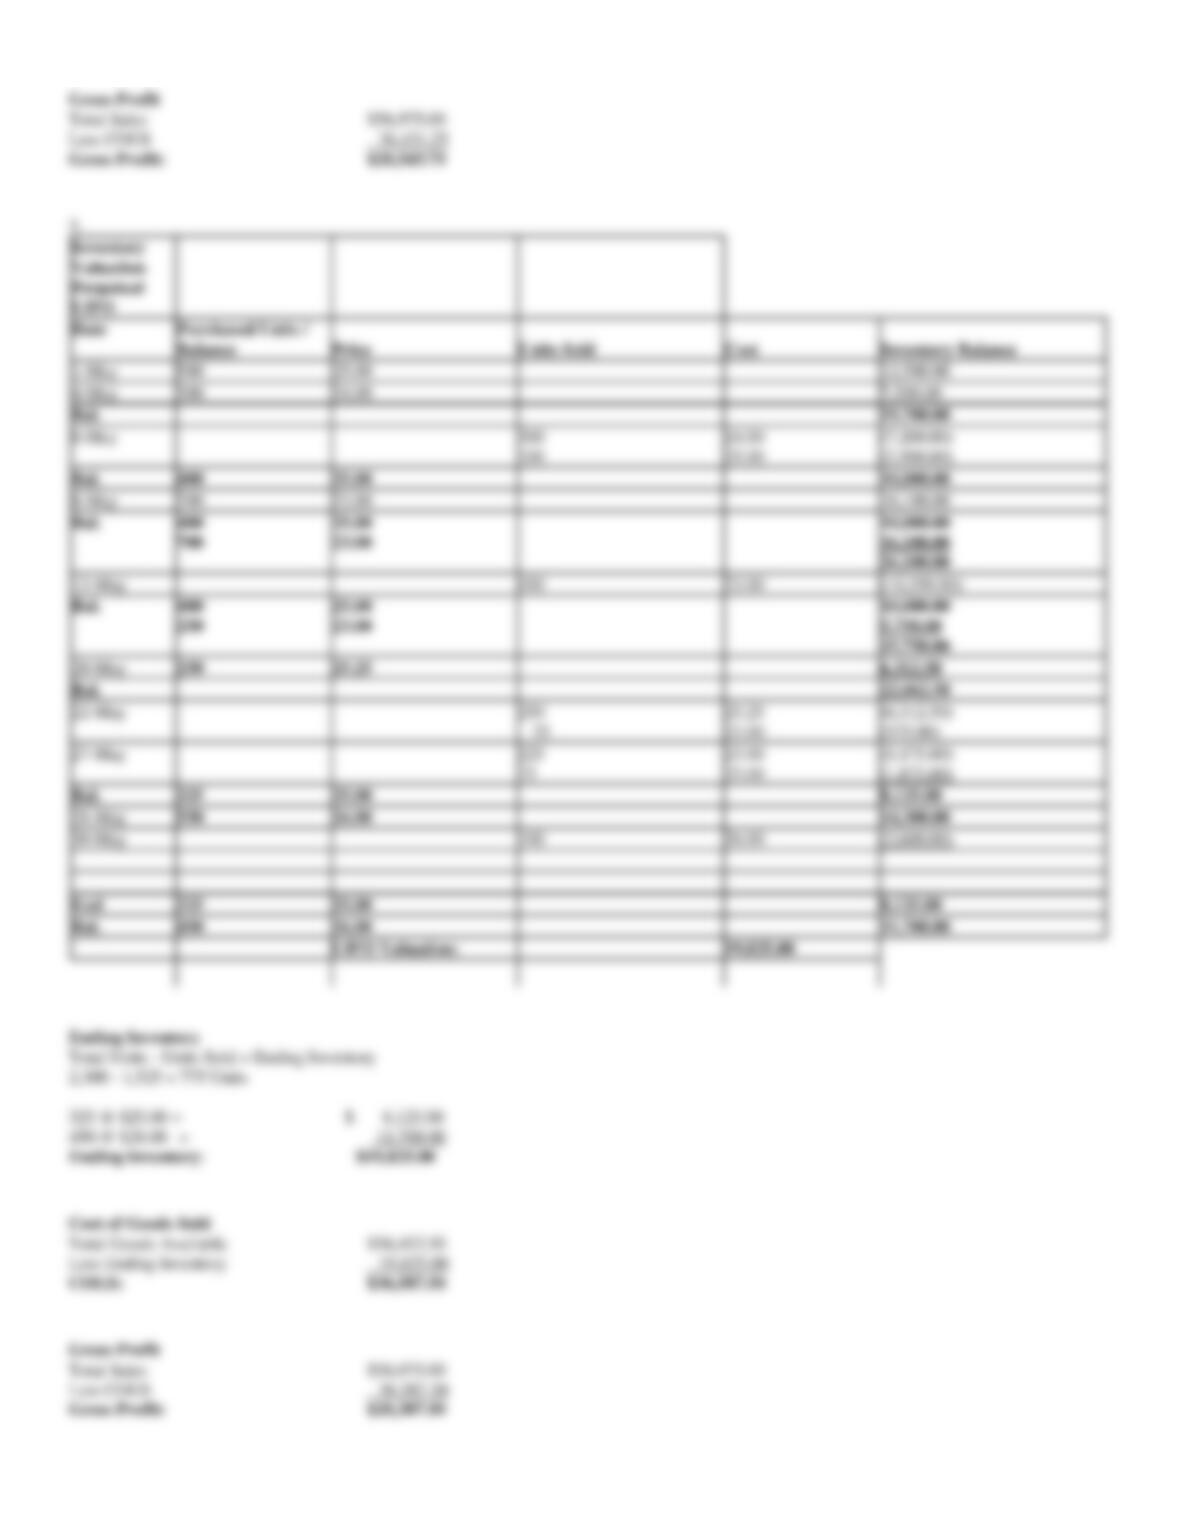
Calculate total sales, cost of goods sold, gross profit and ending inventory using each of the following inventory methods:
1. FIFO Perpetual
2. FIFO Periodic
3. LIFO Perpetual
4. LIFO Periodic
5. Average Cost Periodic (round average to nearest cent)
May 6
400 @ 38.00 = $ 15,200.00
May 13
450 @ 37.50 = 16,875.00
May 22
275 @ 36.00 = 9,900.00
May 27
300 @ 37.00 = 11,100.00
May 30
100 @ 39.00 = _ 3,900.00
May 1
500 @ 25.00 = $ 12,500.00
May 4
300 @ 24.00 = 7,200.00
May 8
700 @ 23.00 = 16,100.00
May 20
250 @ 25.25 = 6,312.50
May 28
550 @ 26.00 = 14,300.00
225 @ $25.25 =
$ 5,681.25
550 @ $26.00 =
14,300.00
Less Ending Inventory
19,981.25
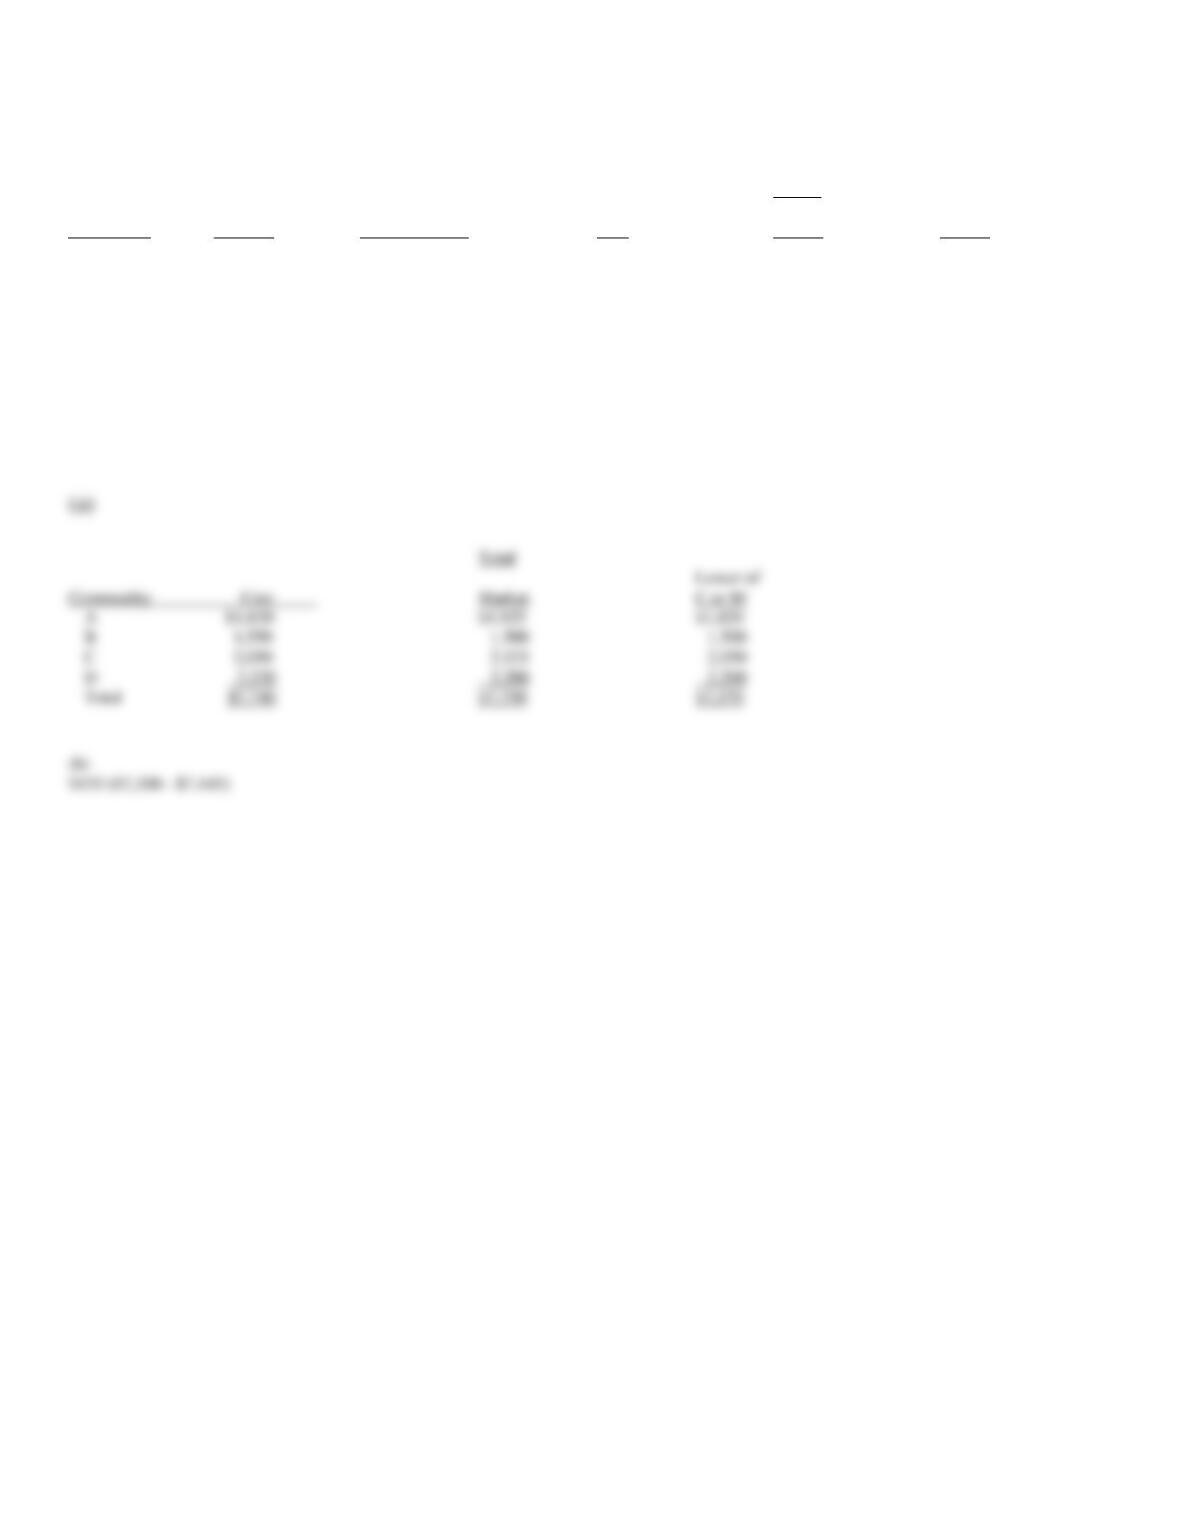
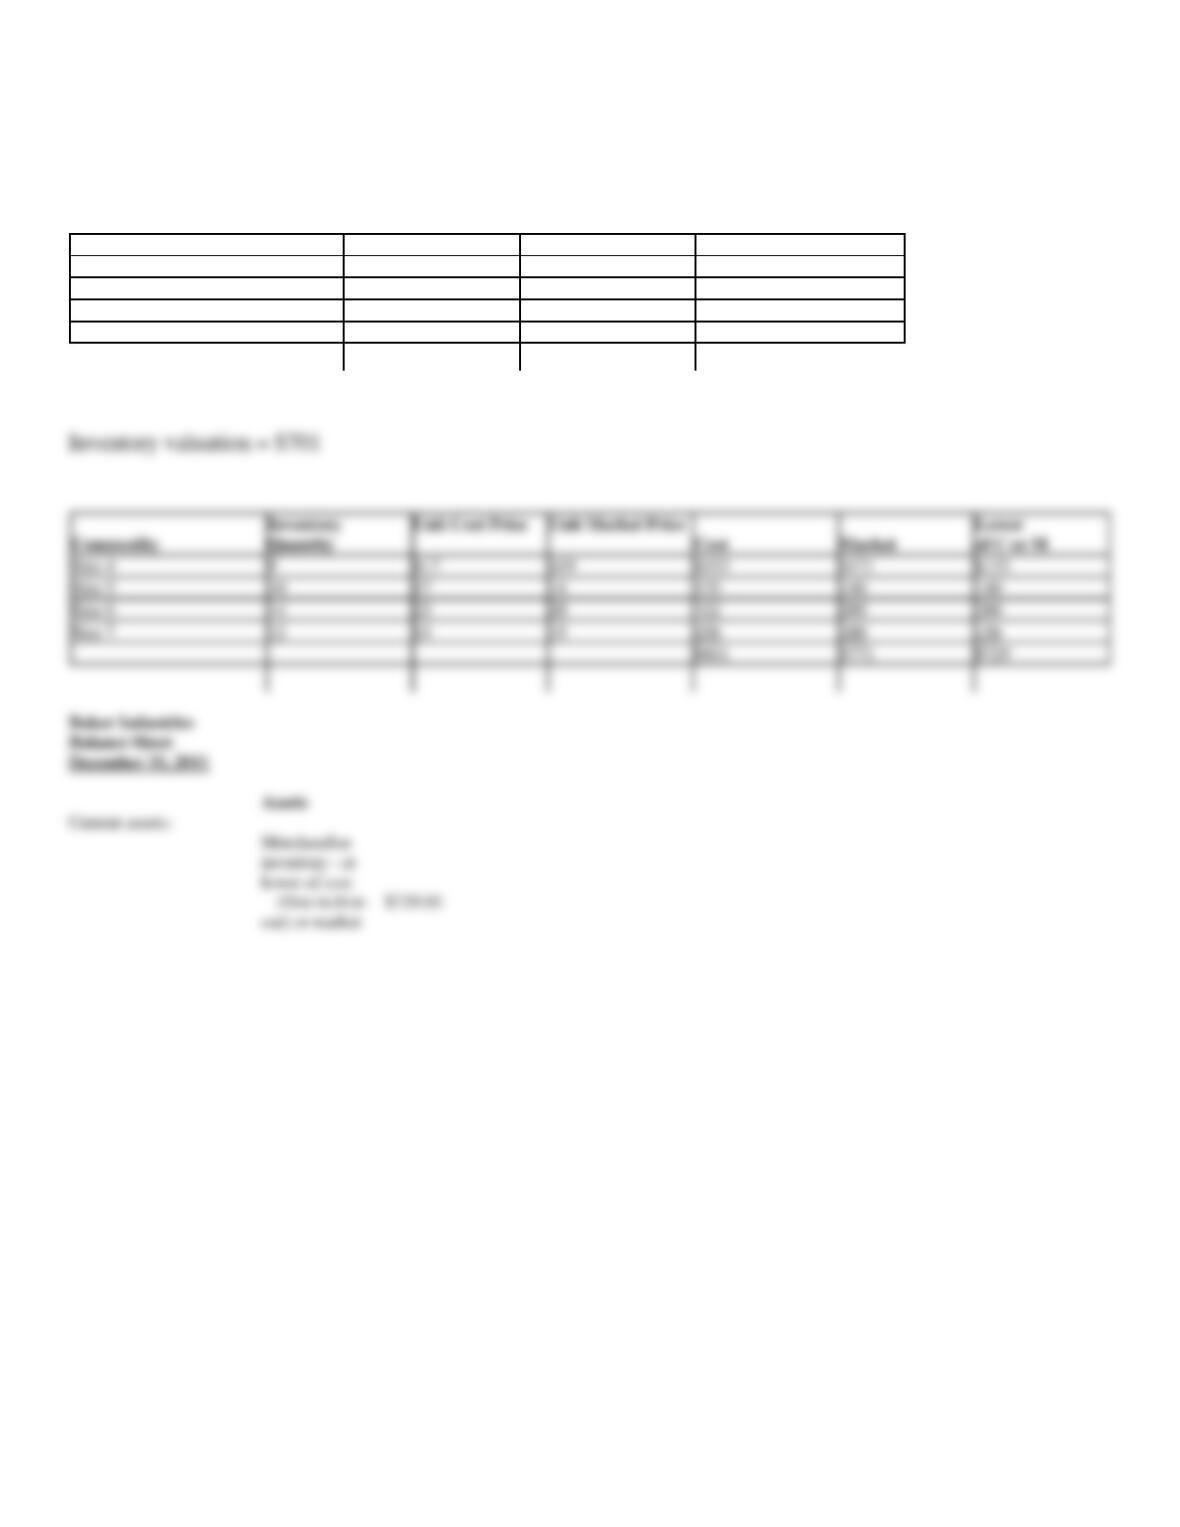
165. Basic inventory data for April 30 are presented below for a business that employs the lower of cost or
market basis of inventory valuation.
Unit Unit
Total
Cost Market
Lower of
Commodity
Quantity
Price Price
Cost
Market
C or M
A
35
$ 52 $ 55
_______
_______
_______
B
10
155 150
_______
_______
_______
C
25
82 85
_______
_______
_______
D
40
58 55
_______
_______
_______
(a)
Complete the table.
(b)
Determine the amount of reduction in the inventory at April 30 attributable to market decline.
Total
Lower of
Commodity Cost_____
Market
C or M
A $1,820
$1,925
$1,820
B 1,550
1,500
1,500
C 2,050
2,125
2,050
D 2,320
2,200
2,200
Total $7,740
$7,750
$7,570

166. Hampton Co. took a physical count of its inventory on December 31. In addition, it had to decide whether
or not the following items should be added to this count.
(a)
Merchandise on hand had been sold earlier in the year but had been returned by customers for various warranty repairs.
(b)
Hampton Co. sent merchandise on a consignment basis on December 31 just prior to the physical count.
(c)
On December 22, Hampton Co. ordered merchandise on FOB destination terms. The merchandise was shipped by the supplier on
December 30 but had not been received by December 31.
(d)
On December 27, Hampton Co. ordered merchandise on FOB shipping point terms. The merchandise was shipped on December 29 but
had not been received by December 31.
(e)
Merchandise sold FOB shipping point on December 31 was picked up by the freight company just before closing on December 31.
(f)
Merchandise shipped to a customer FOB destination was picked up by the freight company on December 28 but had not arrived at its
destination as of December 31.
Indicate which items should be added to (answer: yes) and which items should not be added to (answer: no) the December 31 inventory count.
(a)
(b)
yes
(c)
(d)
yes
(e)
yes
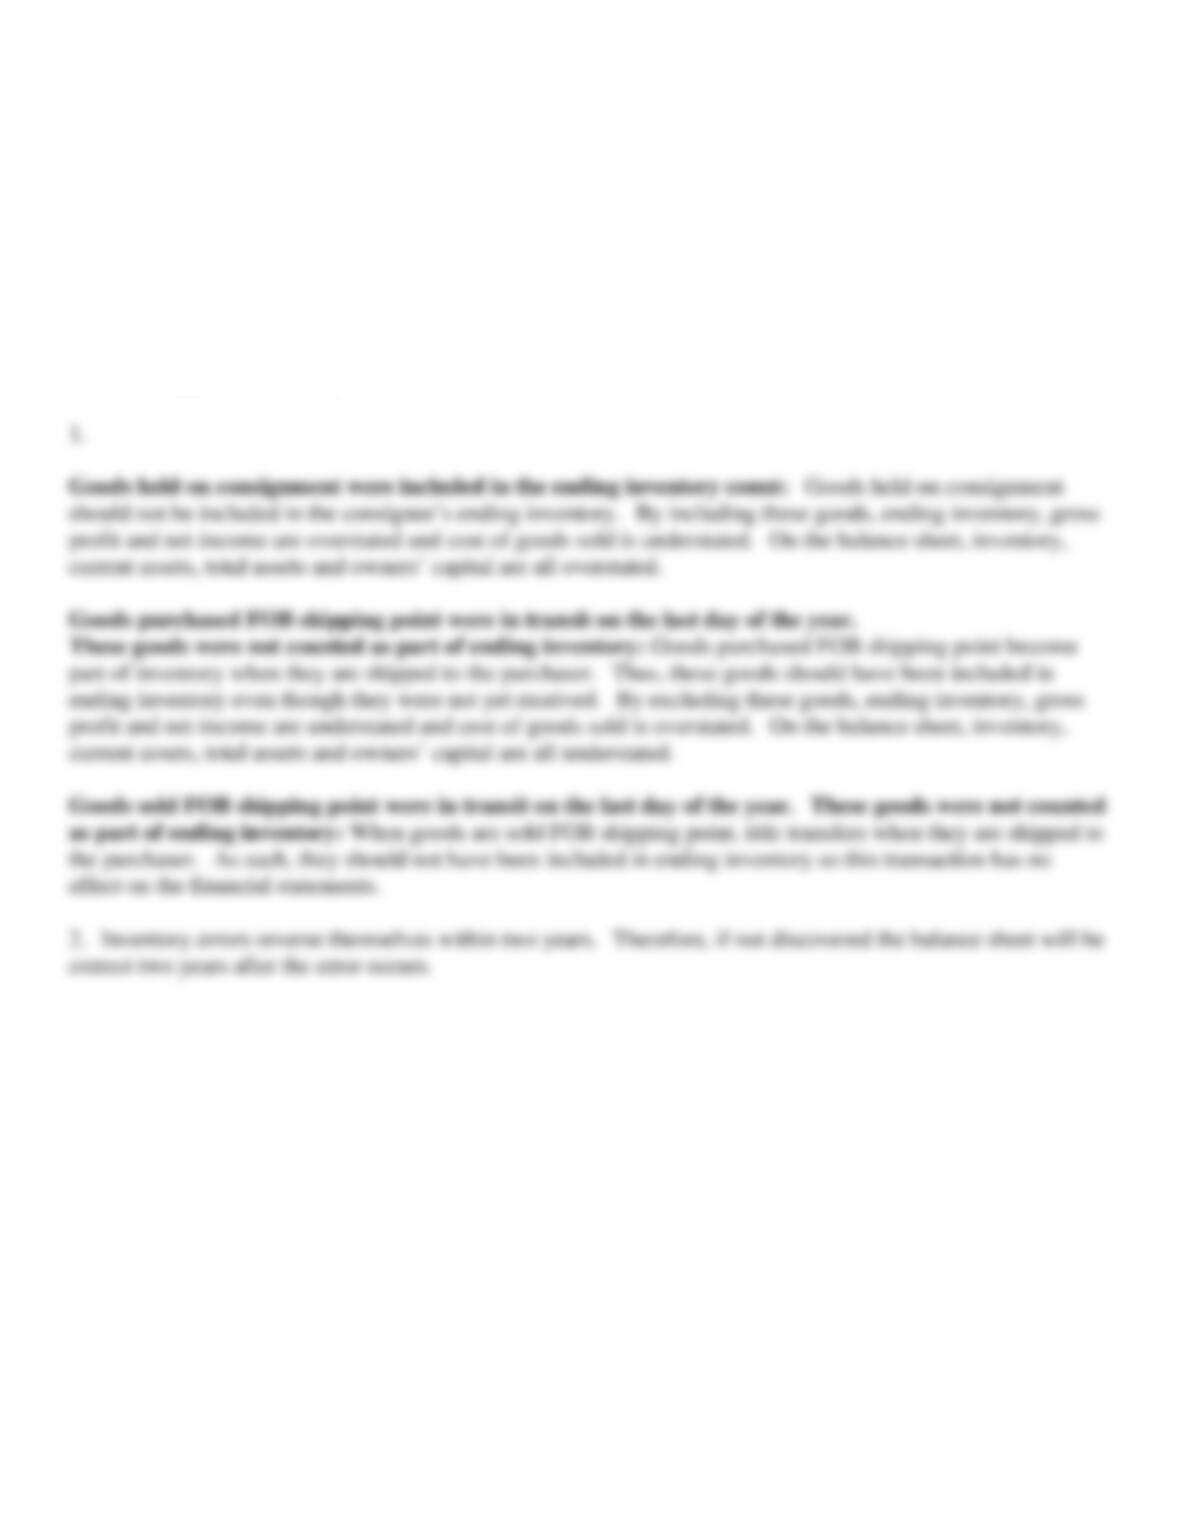
167. 1. Explain the effect of the following on the financial statements:
Goods held on consignment were included in the ending inventory count.
Goods purchased FOB shipping point were in transit on the last day of the year. The
goods were not counted as part of ending inventory.
Goods sold FOB shipping point were in transit on the last day of the year. These
goods were not counted as part of ending inventory.
2. What happens if inventory errors are not found and corrected?
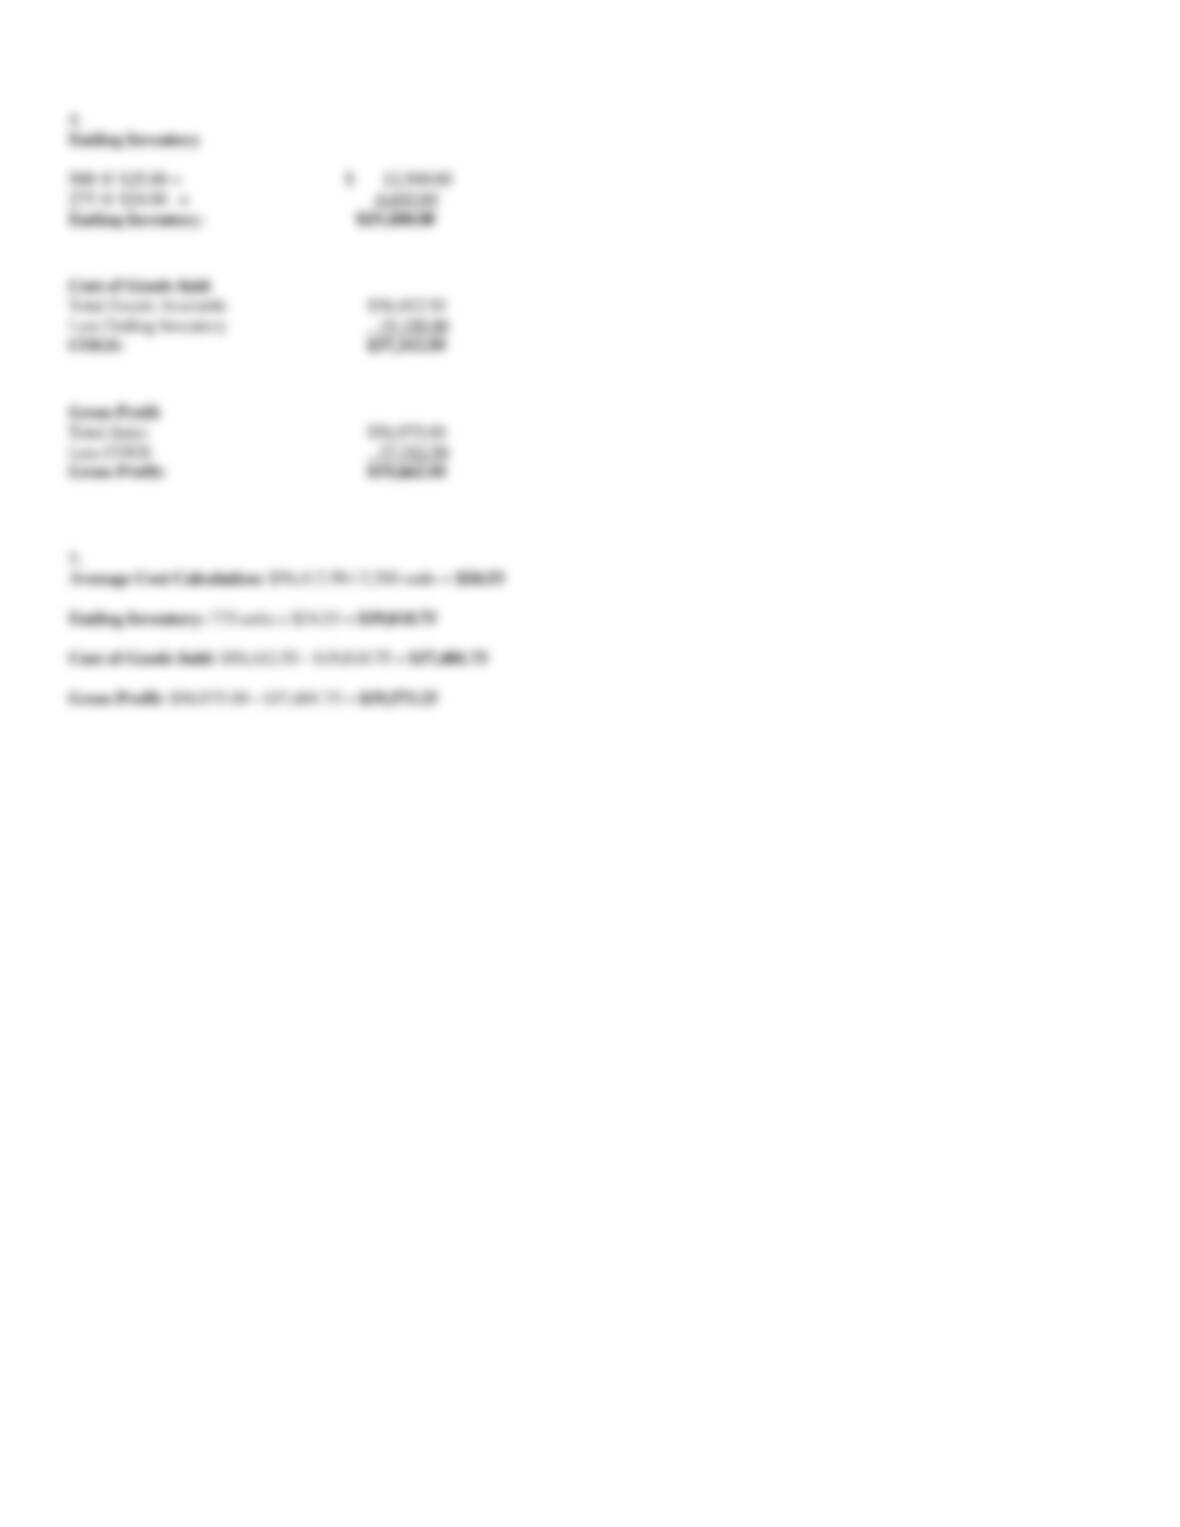
168. On the basis of the following data for Barker Industries as of December 31, 2011, determine the value of
the inventory at the lower of cost or market. Also, show how the merchandise inventory would appear on the
balance sheet (assume that the cost was determined by the FIFO method). Apply lower of cost or market to each
inventory item.
Commodity
Inventory Quantity
Unit Cost Price
Unit Market Price
Size 4
9
$17
$19
Size 5
10
17
14
Size 6
14
23
20
Size 7
12
13
15
Size 4
9
$17
$19
$153
$171
$153
Size 5
10
17
14
170
140
140
Size 6
14
23
20
322
280
280
Size 7
12
13
15
156
180
156
$801
$771
$729
Current assets:
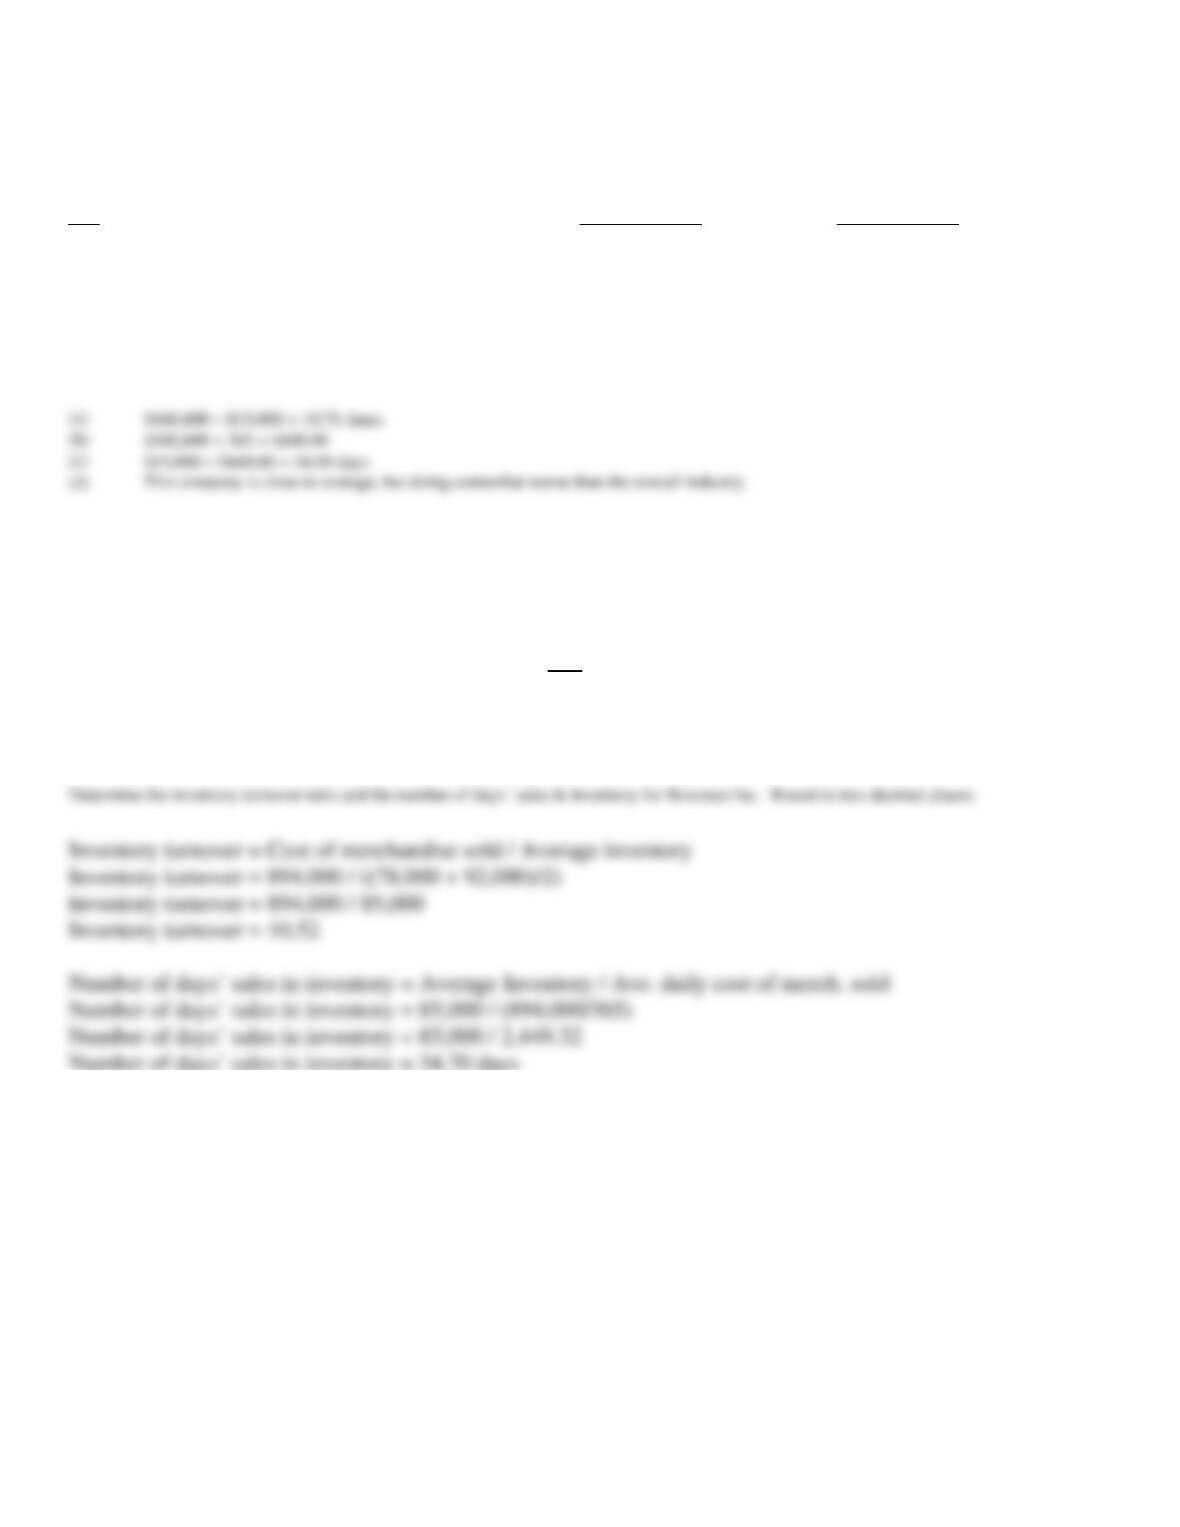
169. Based on the following information: compute (a) Inventory turnover; (b) Average daily cost of
merchandise sold; and (c) Number of days’ sales in inventory for 2011. Use a 365-day year. (d) If an inventory
turnover of 12 is average for the industry, how is this company doing?
Item
12/31/10 Amount
12/31/11 Amount
Cost of merchandise sold
$172,900
$160,600
Inventory
18,000
12,000
170. The following data were taken from Bowman Inc.
2014
Cost of Merchandise Sold
$894,000
Inventory, end of year
78,000
Inventory, beginning of the year
92,000
$15,000 $440.00 = 34.09 days
(d)
This company is close to average, but doing somewhat worse than the overall industry.
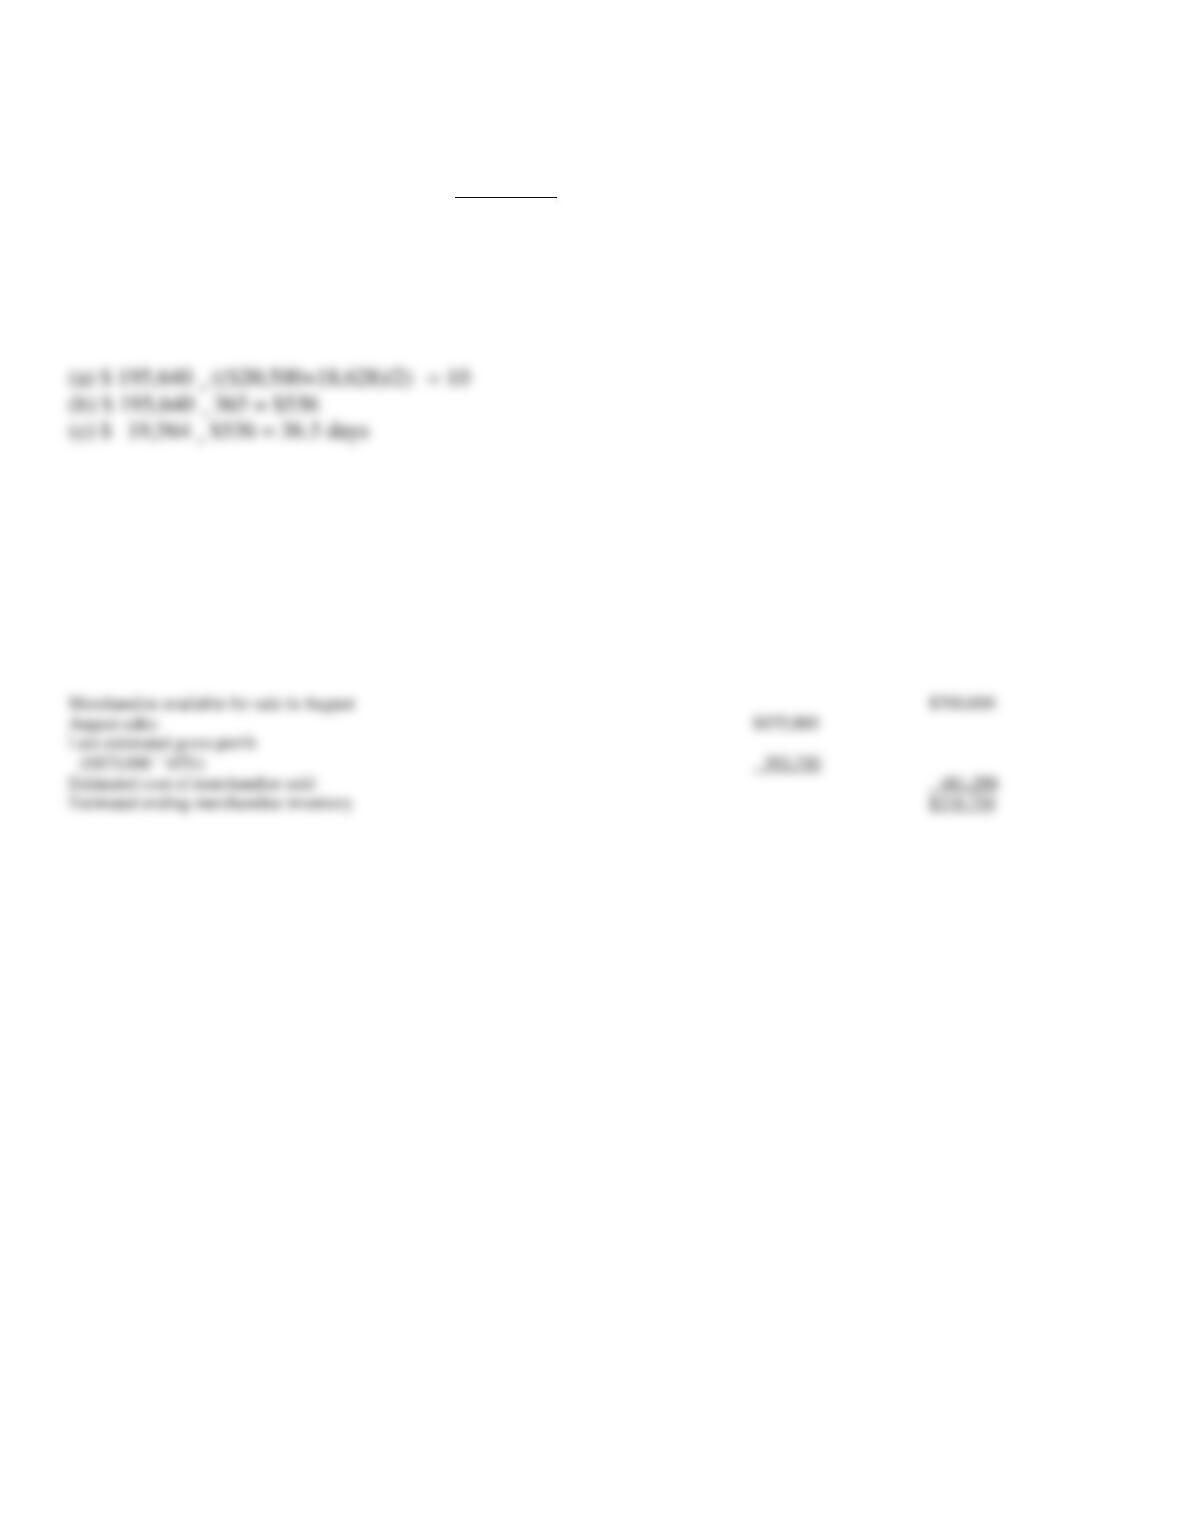
171. Based on the following information, compute (a) Inventory turnover; (b) Average daily cost of
merchandise sold using a 365 day year; and (c) Number of days’ sales in inventory.
April 30, 2012
Cost of merchandise sold
$ 195,640
Inventory:
Beginning
20,500
Ending
18,628
172. During August, the first month of the fiscal year, sales totaled $875,000 and the cost of merchandise
available for sale totaled $700,000. Estimate the cost of the merchandise inventory as of August 31, based on
an estimated gross profit rate of 45%.
Merchandise available for sale in August
$700,000
August sales
$875,000
Less estimated gross profit
($875,000 ´ 45%)
393,750
Estimated cost of merchandise sold
481,250
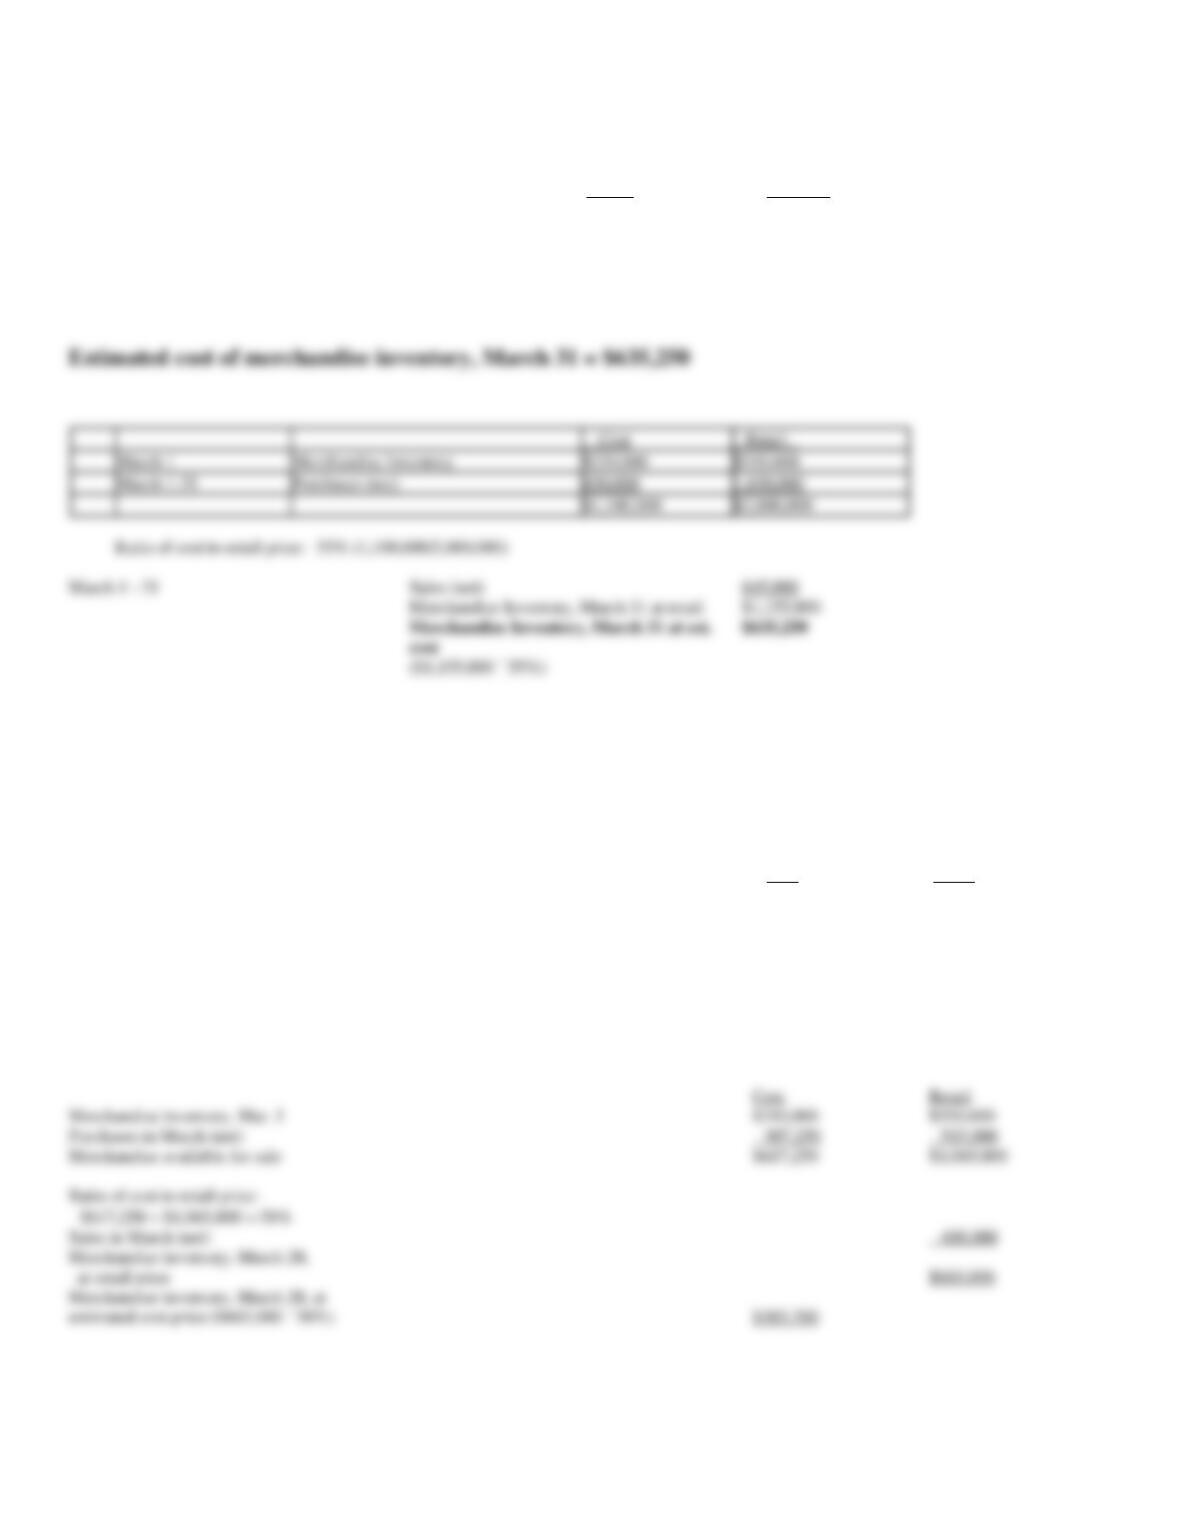
173. On the basis of the following data, estimate the cost of the merchandise inventory at March 31 by the retail
method:
Cost
Retail
March 1
Merchandise Inventory
$250,000
$350,000
March 1-31
Purchases (net)
850,000
1,650,000
March 1-31
Sales (net)
845,000
174. On the basis of the following data, determine the estimated cost of the inventory as of March 31 by the
retail method, presenting details of the computation in good order.
Cost
Retail
Mar. 1
Merchandise inventory
$310,000
$550,000
1-31
Purchases (net)
307,250
515,000
1-31
Sales (net)
400,000
Cost
Retail
Merchandise inventory, Mar. 1
$310,000
$550,000
Purchases in March (net)
307,250
515,000
Merchandise available for sale
$617,250
$1,065,000
Ratio of cost to retail price:
$617,250 $1,065,000 = 58%
Sales in March (net)
400,000
Merchandise inventory, March 28,
at retail price
$665,000
Merchandise inventory, March 28, at
estimated cost price ($665,000 ´ 58%)
$385,700
Cost
Retail
March 1
Merchandise Inventory
$250,000
$350,000
March 1-31
Purchases (net)
850,000
1,650,000
$1,100,000
$2,000,000
March 1 – 31
Sales (net)
845,000
Merchandise Inventory, March 31 at retail
$1,155,000
($1,155,000 ´ 55%)