Exam
Name___________________________________
SHORT ANSWER. Write the word or phrase that best completes each statement or answers the question.
Provide an appropriate response.
1)
Generally, the normal probability plot for a data set must be roughly linear in order to
assume that the variable is approximately normally distributed. Should this rule be
interpreted more strictly for small data sets or for large data sets? Explain.
1)
2)
How does the standard normal distribution differ from a nonstandard normal distribution?
Why is it necessary to standardize in order to find percentages for nonstandard normal
variables?
2)
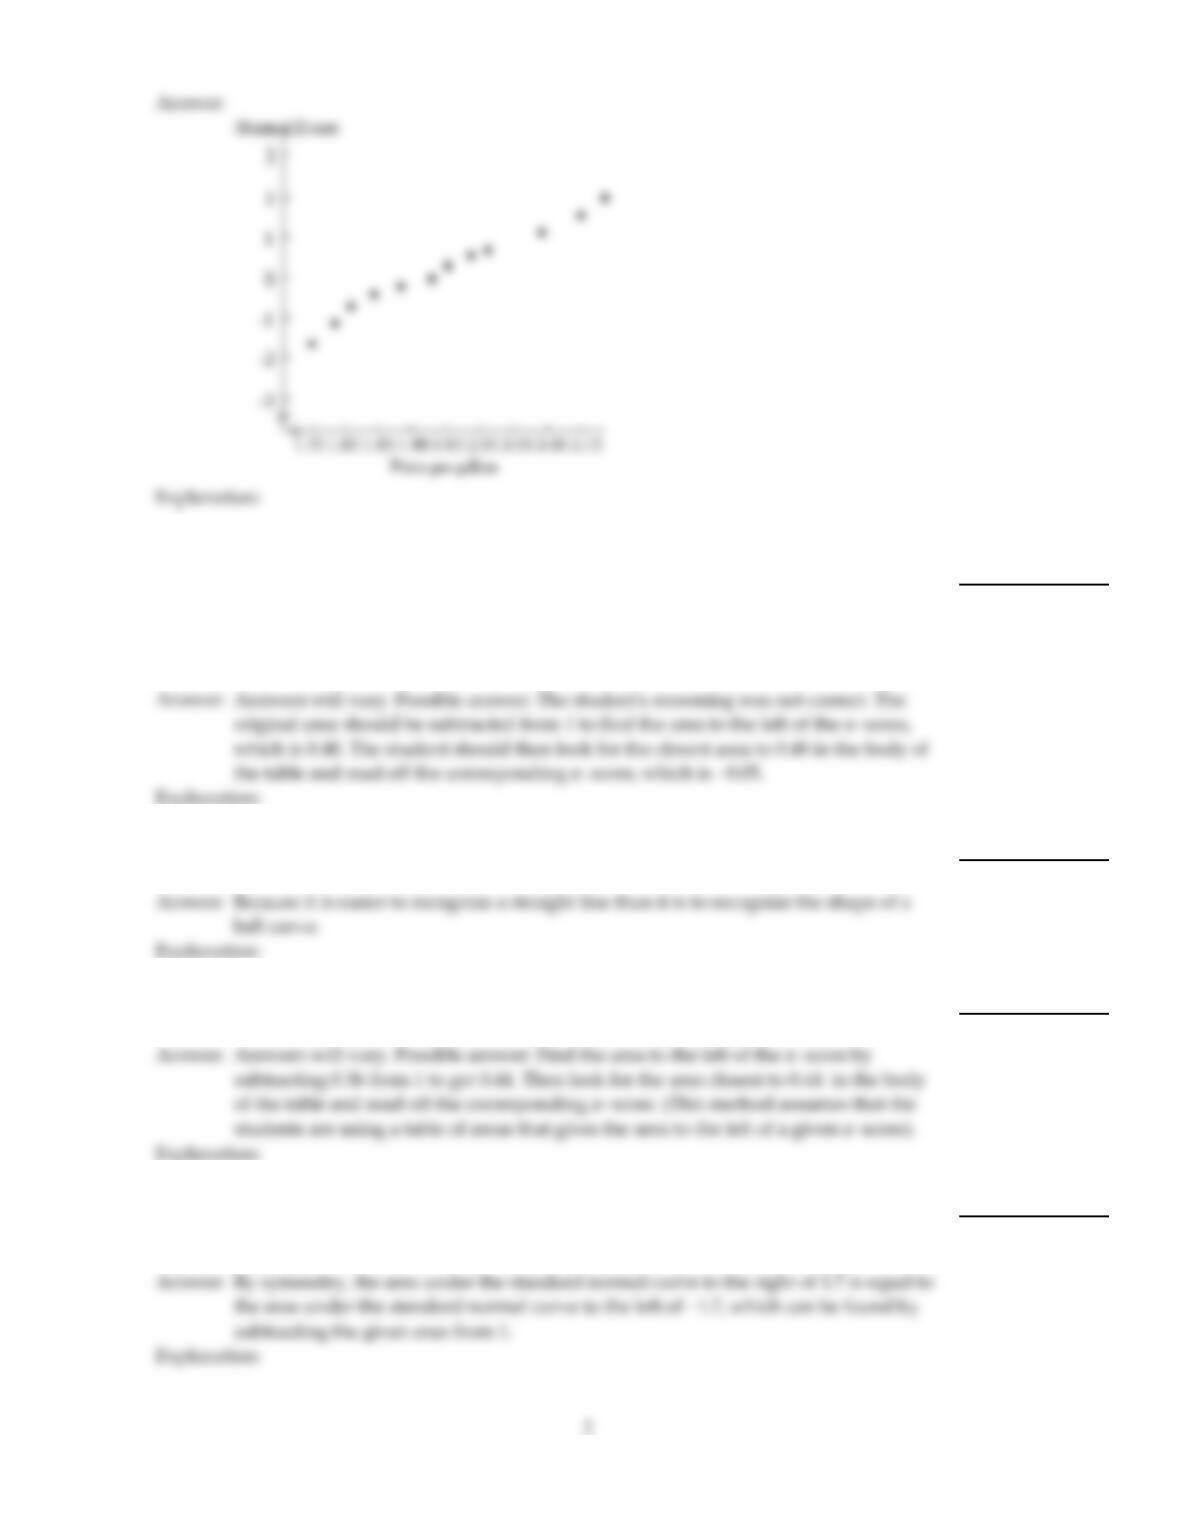
Construct a normal probability plot of the given data.
3)
The prices per gallon (in dollars) of regular unleaded gasoline at twelve service stations are
given below.
1.79 2.09 1.89 1.99
1.75 1.81 1.93 2.19
2.01 2.15 1.95 1.85
3)
1
Provide an appropriate response.
4)
A student wished to use a table of areas for the standard normal curve to find the z–score
having an area to its right of 0.52. The student started by looking for the closest area to 0.52
in the body of the table and reading off the corresponding z–score which was 0.05. She
then subtracted this z–score from 1 to get 0.95. Was her reasoning correct? If not, where did
she go wrong and how would you have solved the problem?
4)
5)
In assessing the normality of a data set, why is it easier to interpret a normal probability
plot than it is to interpret a histogram?
5)
6)
The area under the standard normal curve to the right of a z–score is 0.56. Explain how
you could use a table of areas to find the z–score.
6)
7)
Suppose that you know the area under the standard normal curve to the right of –1.7. How
could you use this to find the area under the standard normal curve to the right of 1.7?
Explain your reasoning.
7)
8)
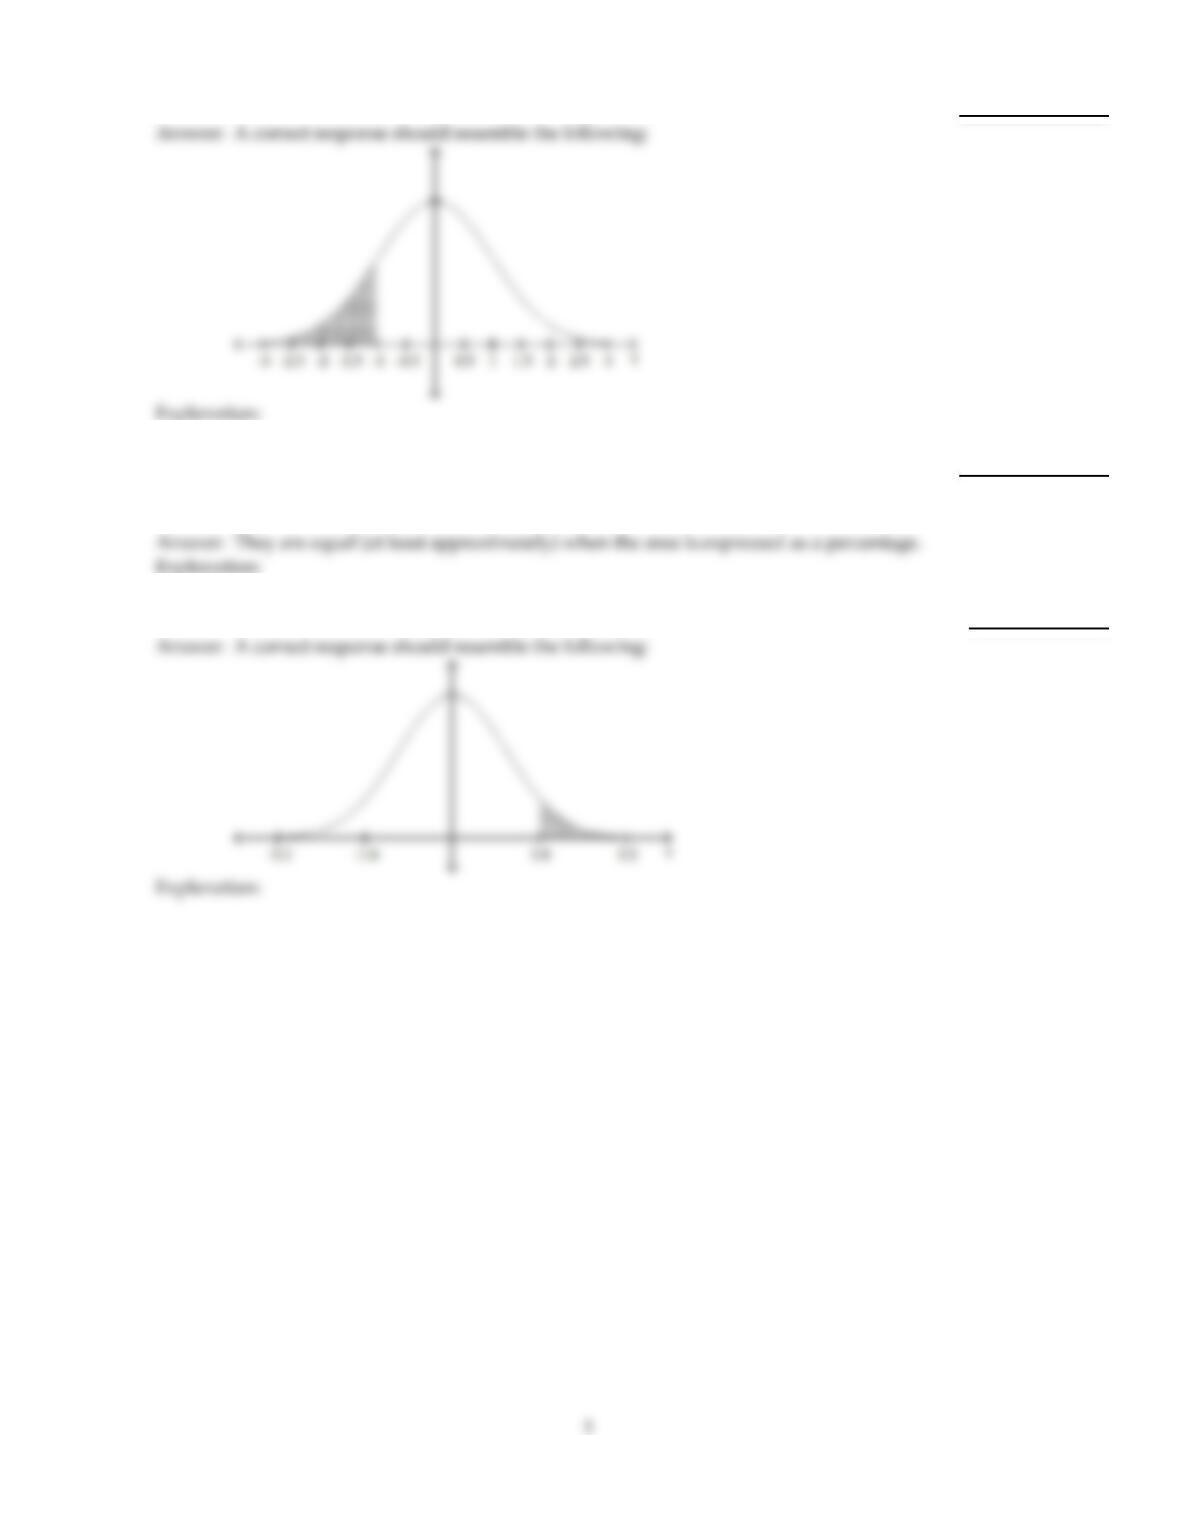
Sketch a standard normal curve and shade the area between the z–scores –2.5 and –1.
8)
9)
For a variable with a density curve, what is the relationship between the percentage of all
possible observations of the variable that lie within any specified range and the
corresponding area under its density curve?
9)
10)
Sketch a standard normal curve and shade the area to the right of the z–score 1.6.
10)
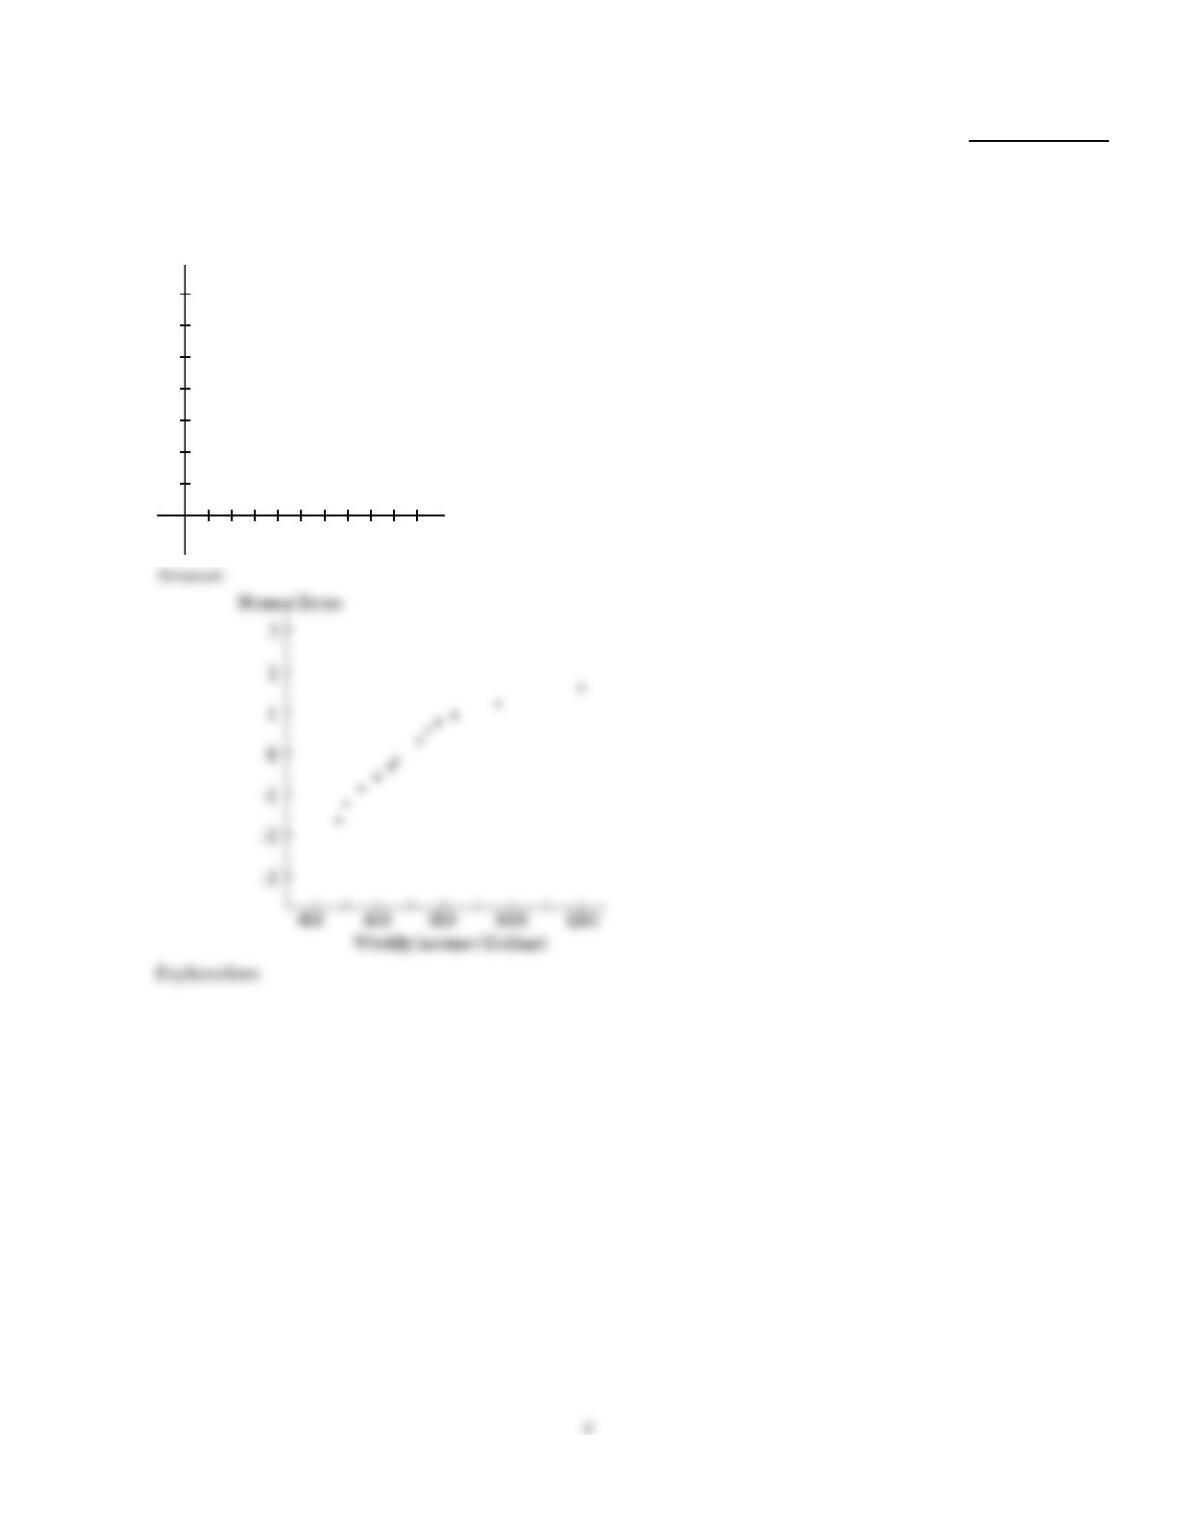
Construct a normal probability plot of the given data.
11)
The weekly incomes (in dollars) of a sample of 12 nurses working at a Los Angeles hospital
are given below.
500 750 630 480
550 650 720 780
820 960 1200 770
11)
Provide an appropriate response.
12)
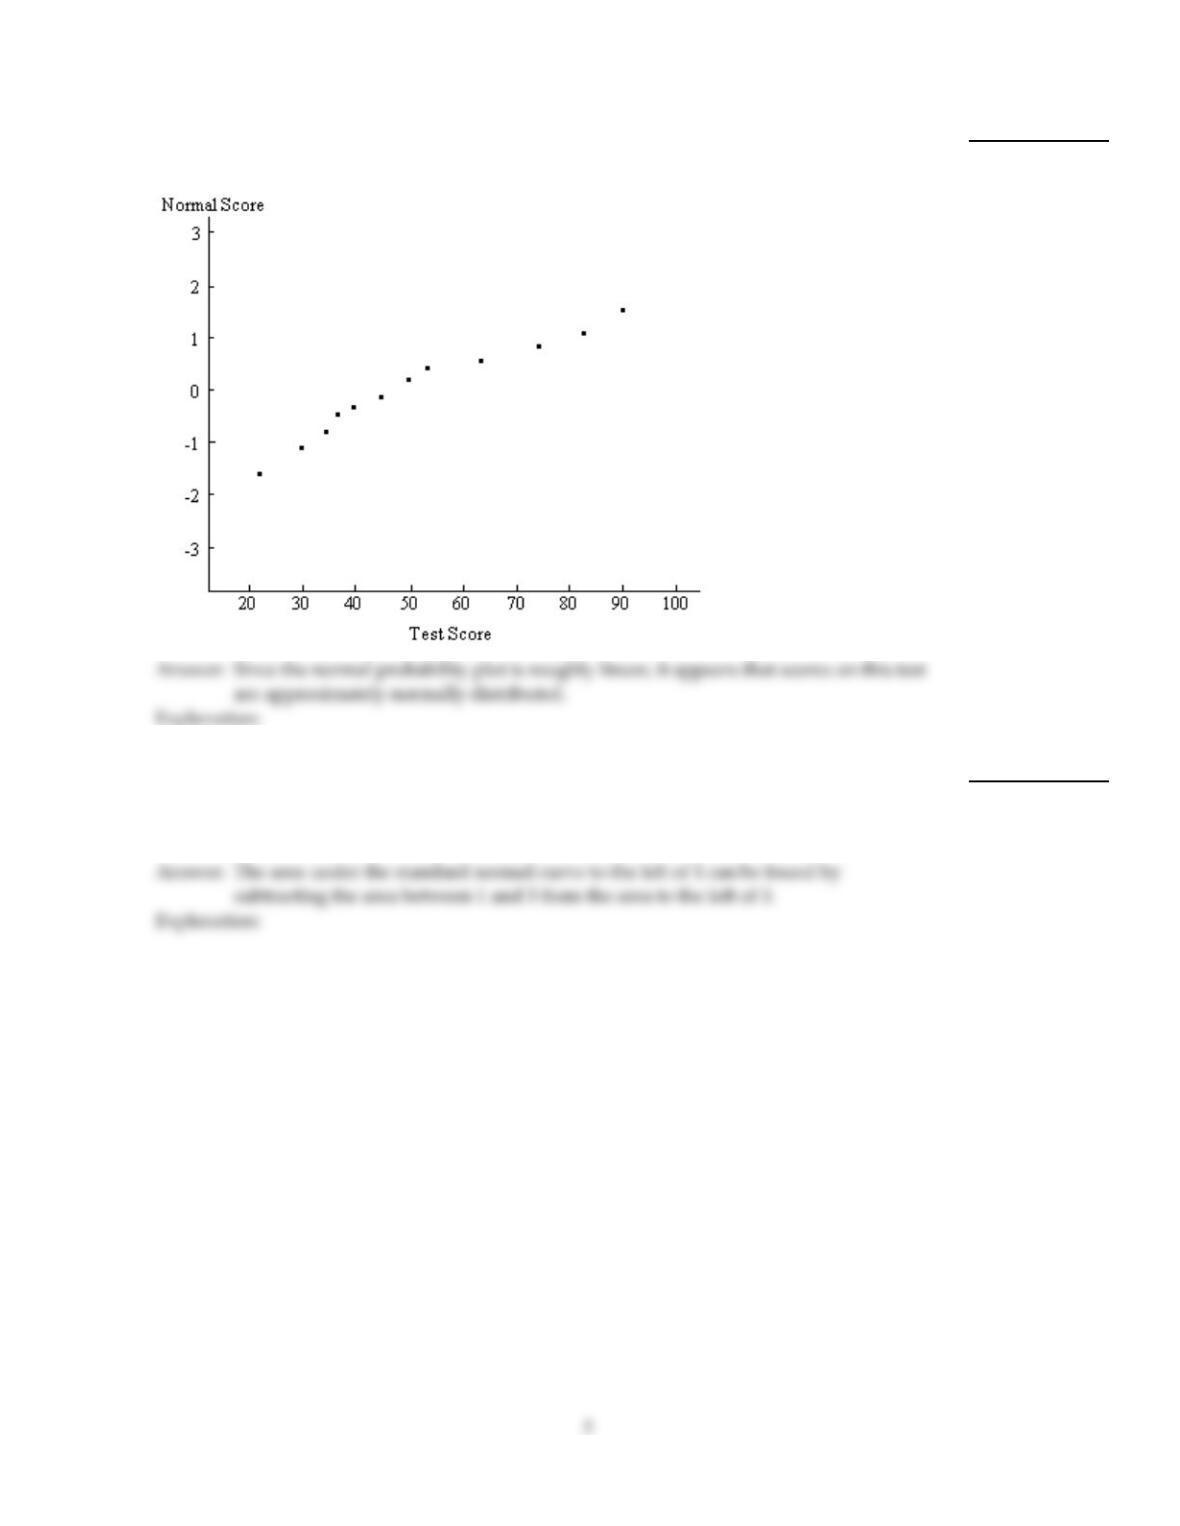
A normal probability plot is given below for a sample of scores on an aptitude test. Use the
plot to assess the normality of scores on this test. Explain your reasoning.
12)
13)
Suppose that you know the area under the standard normal curve between 1 and 3 and the
area under the standard normal curve to the left of 3. Without further consulting a table of
areas, how could you find the area under the standard normal curve to the left of 1?
Explain your reasoning by using a sketch of the standard normal curve.
13)
Construct a normal probability plot of the given data.
14)
The resting heart rates from a group of 9 men before starting a workout program are given
below.
58 70 63
48 60 55
45 51 69
14)
Provide an appropriate response.
15)
On the same axes sketch normal distributions with
a. µ= 6, = 4
b. µ= 6, = 2
c. µ= –6, = 2.
15)
16)
Suppose that scores on a test are normally distributed with a mean of 80 and a standard
deviation of 8. You have been asked to find the 70th percentile. After sketching a standard
normal curve and shading the area of interest, the next step in solving this problem is to
use the table of areas. Would you look for 0.7 in the body of the table or in the left–hand
column? Explain your reasoning.
16)
17)
A variable is normally distributed with a mean of 100 and a standard deviation of 10.
Which is larger, the percentage of observations between 80 and 90 or the percentage of
observations between 120 and 130? Explain your reasoning.
17)
18)
Which is larger, the area under the standard normal curve between –1 and 1, or the area
under the standard normal curve between 0 and 2? Explain your reasoning.
18)
19)
Suppose that you know the area under the standard normal curve to the right of –2. How
could you use this to find the area under the standard normal curve to the left of 2? Explain
your reasoning.
19)
20)
A variable is normally distributed. 42% of the possible observations of the variable lie
between 20 and 28. What information does this give you about the graph of the normal
curve for this variable?
20)
21)
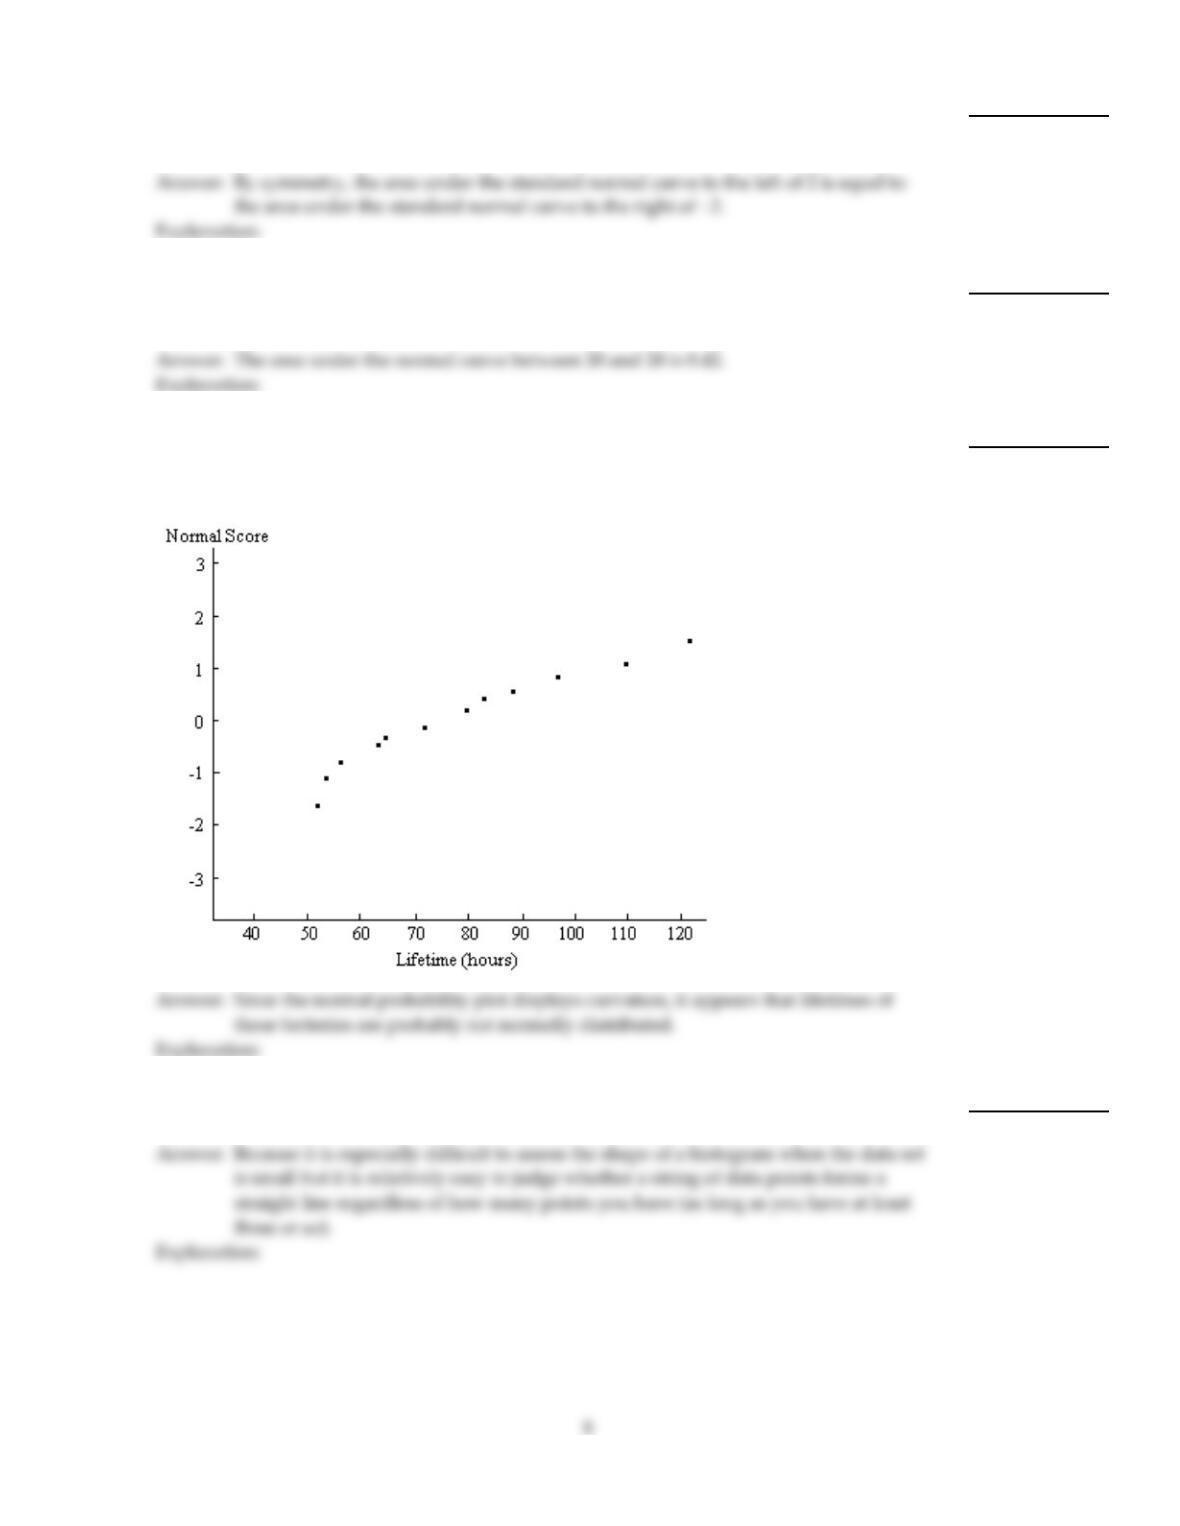
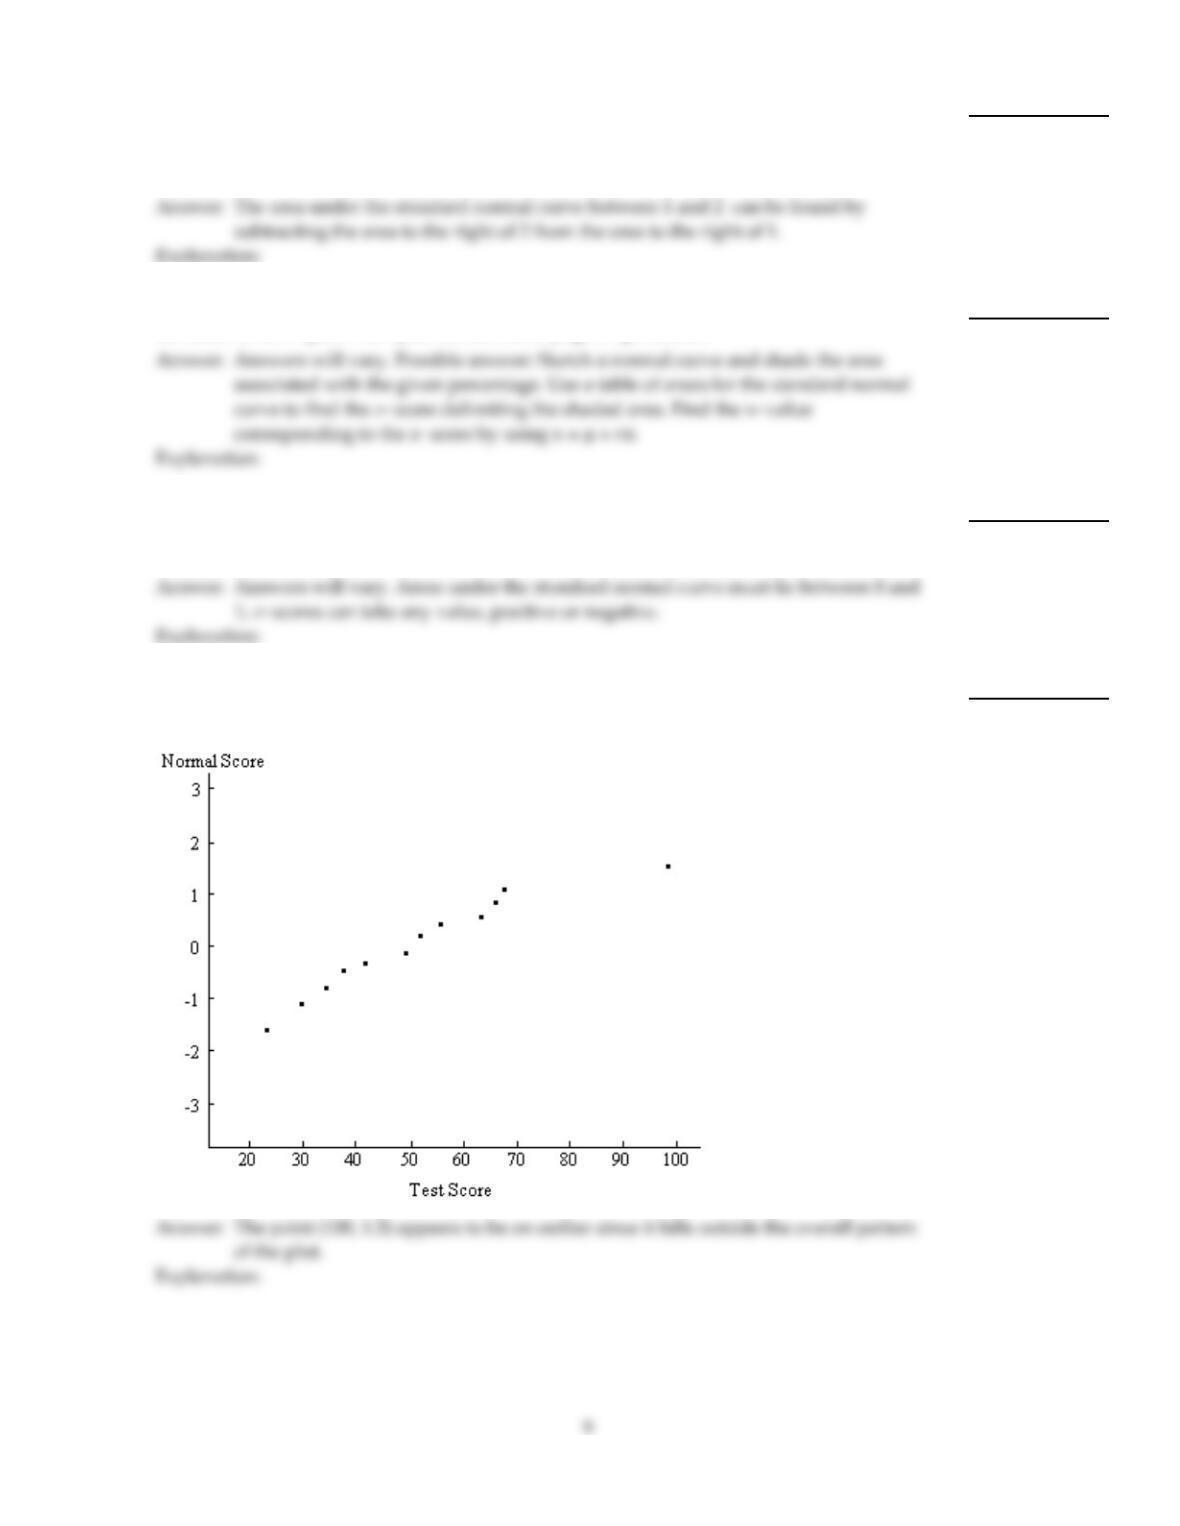
A normal probability plot is given below for the lifetimes (in hours) of a sample of batteries
of a particular brand. Use the plot to assess the normality of the lifetimes of these batteries.
Explain your reasoning.
21)
22)
In assessing the normality of data, why is a normal probability plot especially
advantageous for small samples?
22)
23)
Suppose that you know the area under the standard normal curve to the right of 2 and the
area under the standard normal curve to the right of 1. Without further consulting a table
of areas, how could you find the area under the standard normal curve between 1 and 2?
Explain your reasoning.
23)
24)
Scores on an aptitude test are normally distributed with a mean of 400 and a standard
deviation of 60. Explain how you would find any given percentile.
24)
25)
Use a sketch of the standard normal curve to explain the difference between z–scores and
areas under the standard normal curve. What are the possible values for an area and what
are the possible values for a z–score?
25)
26)
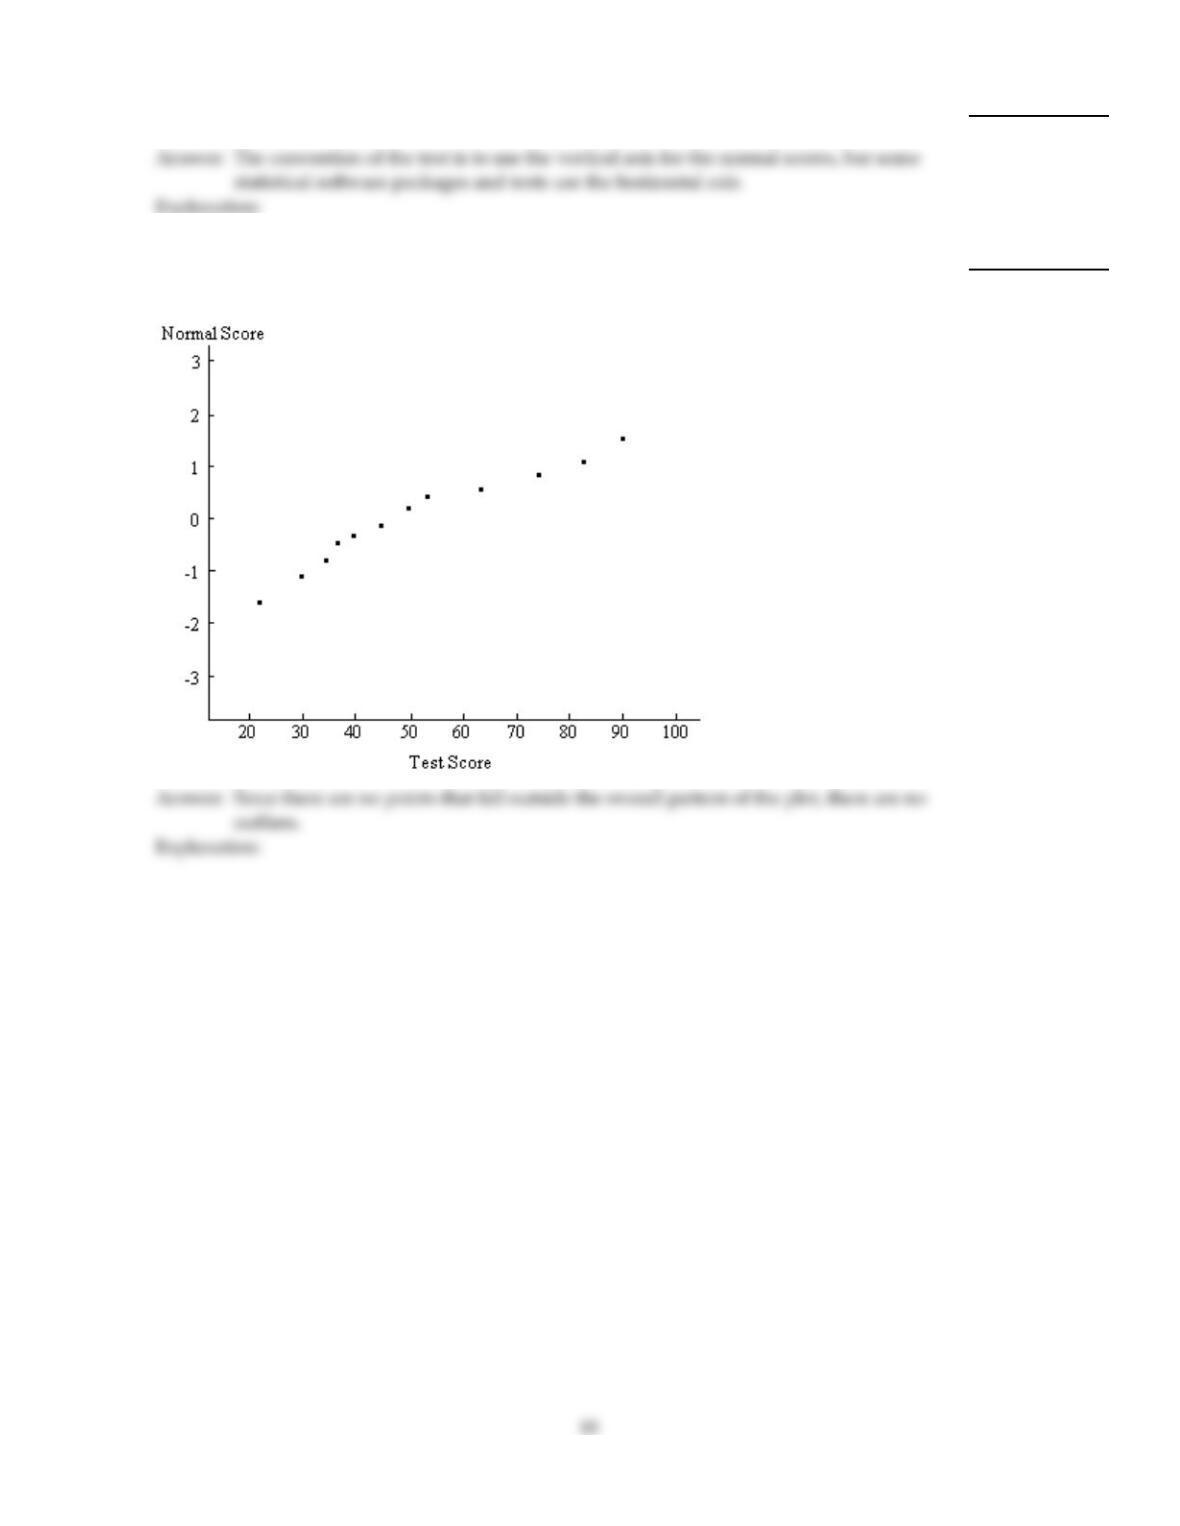
A normal probability plot is given below for a sample of scores on an aptitude test. Use the
plot to identify outliers, if any. Explain your reasoning.
26)
27)
When a normal probability plot is constructed, which axis is used for the normal scores
(horizontal or vertical)?
27)
28)
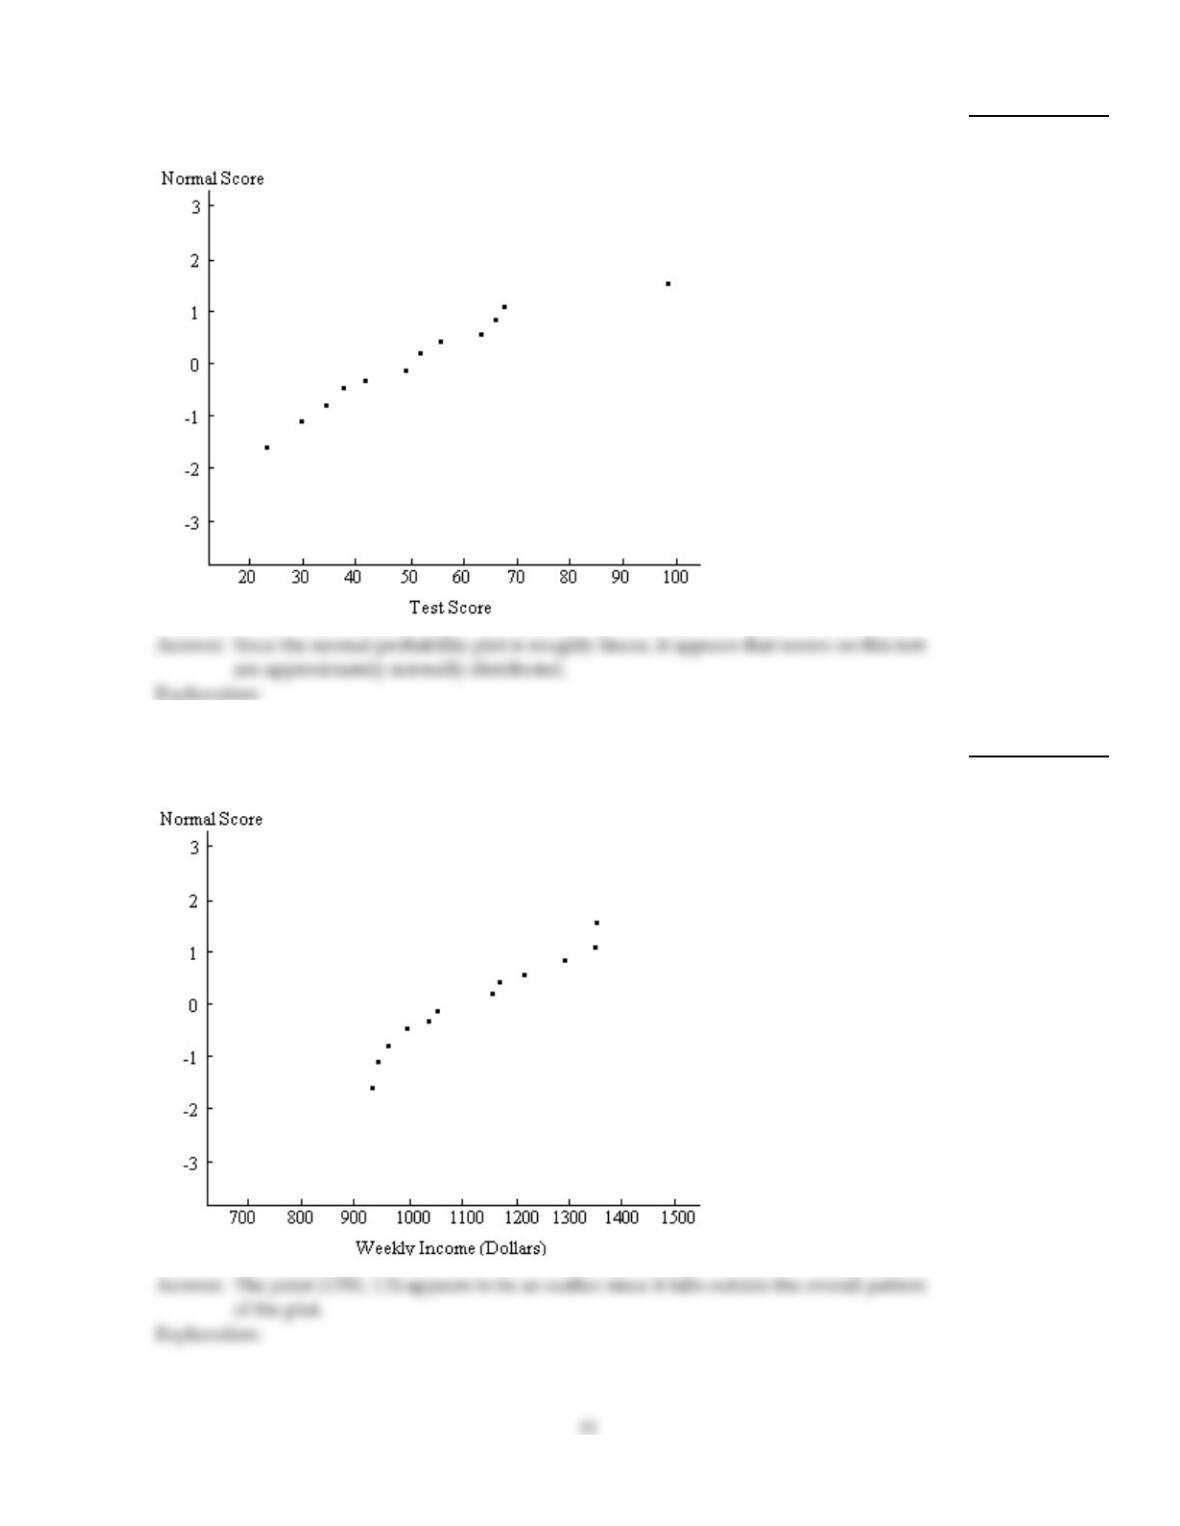
A normal probability plot is given below for a sample of scores on an aptitude test. Use the
plot to identify outliers, if any. Explain your reasoning.
28)
29)
A normal probability plot is given below for a sample of scores on an aptitude test. Use the
plot to assess the normality of scores on this test. Explain your reasoning.
29)
30)
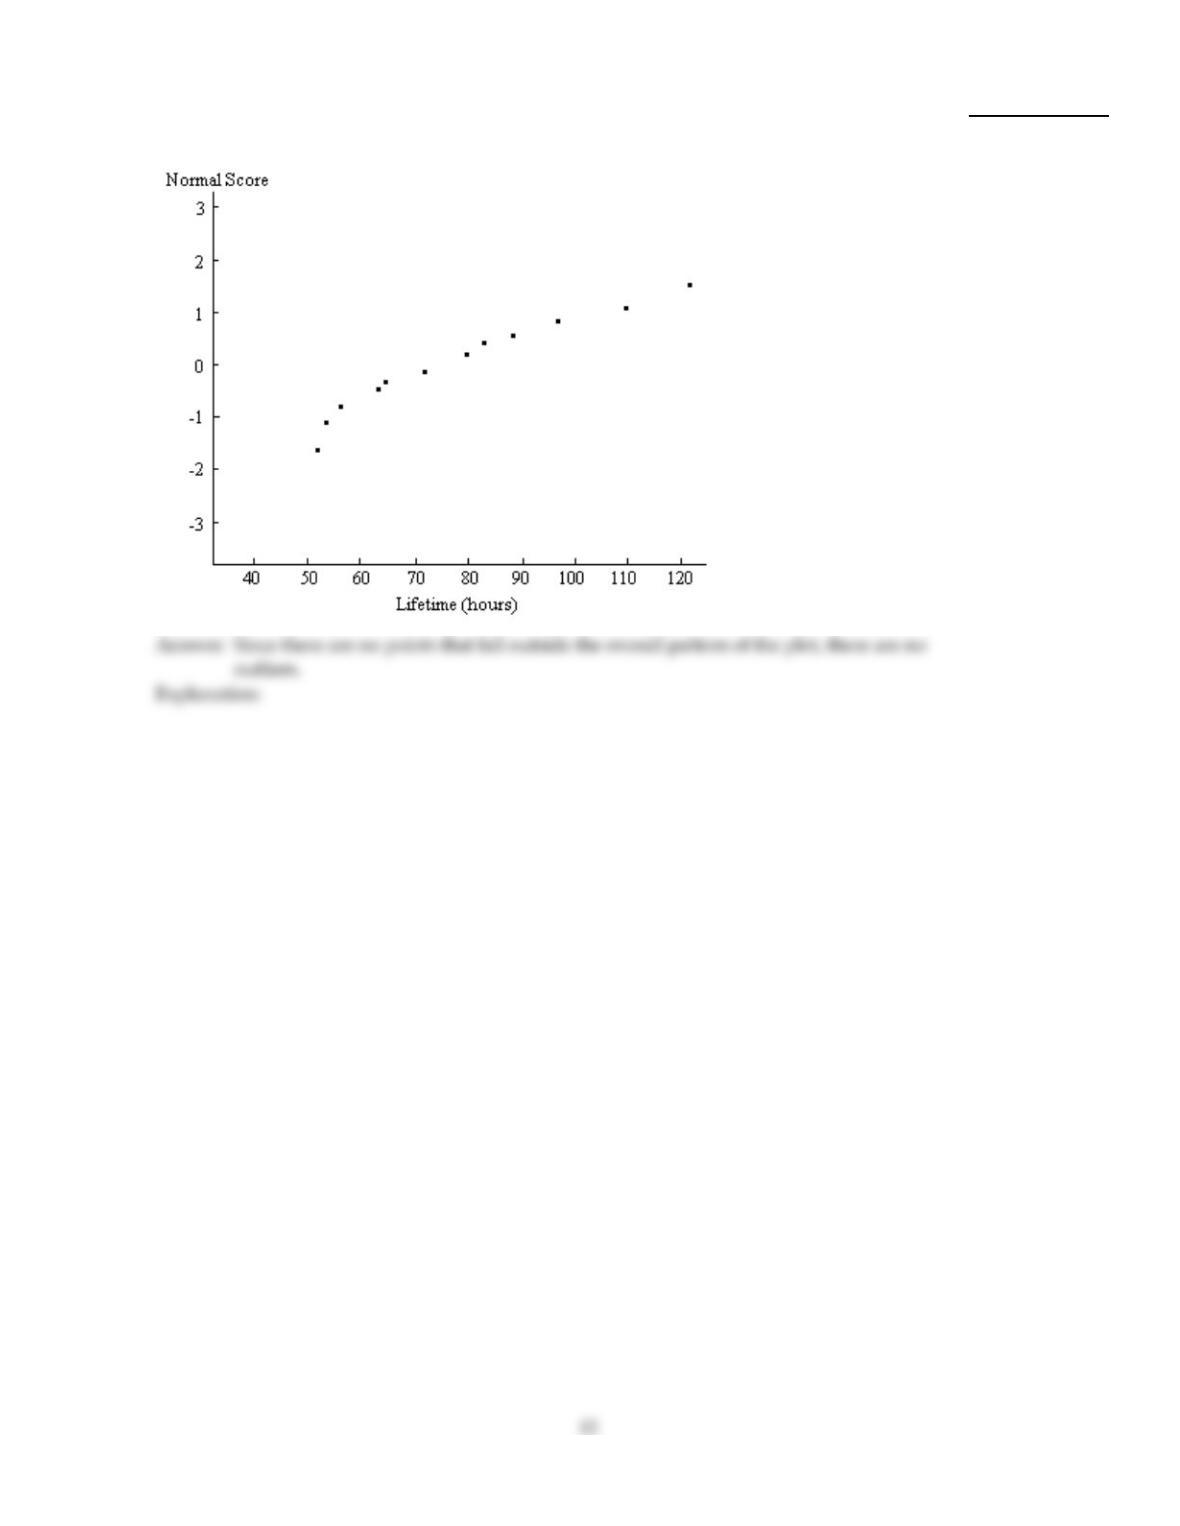
A normal probability plot is given below for the weekly incomes (in dollars) of a sample of
engineers in one town. Use the plot to identify outliers, if any. Explain your reasoning.
30)
31)
A normal probability plot is given below for the lifetimes (in hours) of batteries of a
particular type. Use the plot to identify outliers, if any. Explain your reasoning.
31)
Construct a normal probability plot of the given data.
32)
The systolic blood pressure (in mmHg) is given below for a sample of 12 men aged between
60 and 65. 127 135 118 164
143 130 125 153
120 173 140 180
32)
Provide an appropriate response.
33)
Suppose that scores on a test are normally distributed with a mean of 80 and a standard
deviation of 8. Read the two questions below.
A. What is the 90th percentile?
B. What percentage of students score less than 90?
Explain the difference between the two questions. Describe how the method for solving A
would differ from the the method for solving B. Be sure to include in your explanation a
description of how the table of areas would be used in each case.
33)
34)
Does the presence of an outlier in your data set necessarily mean that you cannot use the
normal model to interpret the data? Explain.
34)
35)
A curve has area 0.317 to the left of 5 and area 0.647 to the right of 5. Could this curve be a
density curve for some variable? Explain your answer.
35)
Construct a normal probability plot of the given data.
36)
The final exam scores for 15 students in a statistics course are given below.
95 70 60 82 40
62 97 57 32 75
78 85 68 54 88
36)
Provide an appropriate response.
37)
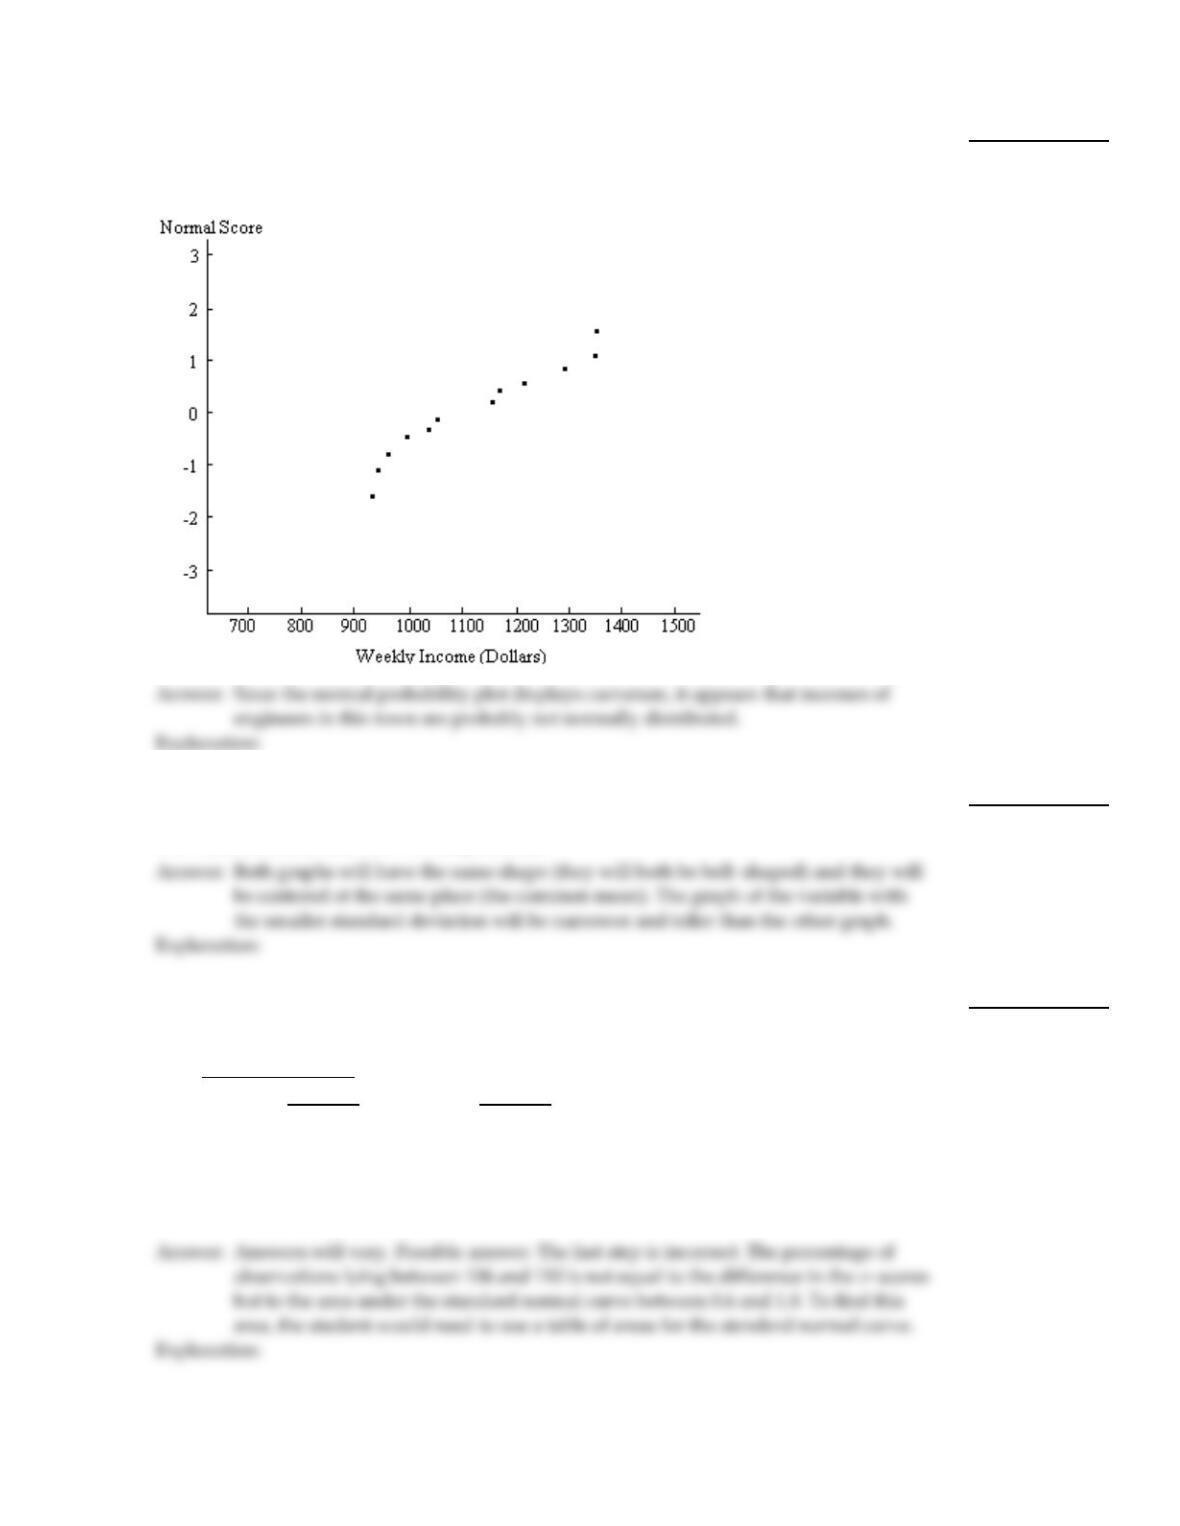
A normal probability plot is given below for the weekly incomes (in dollars) of a sample of
engineers in one town. Use the plot to assess the normality of the incomes of engineers in
this town. Explain your reasoning.
37)
38)
Two random variables are normally distributed with the same mean. One has a standard
deviation of 10 while the other has a standard deviation of 15. How will the graphs of the
two variables differ and how will they be alike?
38)
39)
A variable is normally distributed with a mean of 100 and a standard deviation of 10. A
student wanted to find the percentage of observations of the variable lying between 106
and 110. What is wrong with his solution?
Student’s solution:
z–scores: 106–100
10 = 0.6 110–100
10 = 1.0
Percentage of scores lying between 106 and 110
= difference between z–scores
= 1.0 – 0.6 = 0.4 = 40%
39)
16
MULTIPLE CHOICE. Choose the one alternative that best completes the statement or answers the question.
Find the indicated probability or percentage for the normally distributed variable.
40)
The variable X is normally distributed. The mean is µ= 15.2 and the standard deviation is = 0.9.
Find P(X > 16.1).
40)
A)
0.1357
B)
0.8413
C)
0.1550
D)
0.1587
Use a table of areas for the standard normal curve to find the required z–score.
41)
Find the z–score for having area 0.09 to its right under the standard normal curve, that is, find
z0.09
41)
A)
1.34
B)
1.26
C)
1.39
D)
1.45
Find the specified percentile, quartile, or decile.
42)
Scores on an English test are normally distributed with a mean of 31.4 and a standard deviation of
8.9. Find the 41st percentile.
42)
A)
36.7
B)
29.4
C)
26.1
D)
33.4
Fill in the blanks by standardizing the normally distributed variable.
43)
The amount of time that customers wait in line during peak hours at one bank is normally
distributed with a mean of 13 minutes and a standard deviation of 2 minutes. The percentage of
time that the waiting time lies between 15 and 17 minutes is equal to the area under the standard
normal curve between ___ and ___.
43)
A)
1, 1.15
B)
–2, –1
C)
1, 2
D)
2, 4
17
Use the empirical rule to solve the problem.
44)
The amount of Jen’s monthly phone bill is normally distributed with a mean of $64 and a standard
deviation of $12. Fill in the blanks.
68.26% of her phone bills are between $___ and $___.
44)
A)
52, 76
B)
64, 76
C)
40, 88
D)
40, 64
Find the indicated probability or percentage for the normally distributed variable.
45)
A bank‘s loan officer rates applicants for credit. The ratings are normally distributed with a mean of
200 and a standard deviation of 50. If an applicant is randomly selected, find the probability of a
rating that is between 200 and 275.
45)
A)
0.9332
B)
0.0668
C)
0.4332
D)
0.5
Provide an appropriate response.
46)
True or false, the standard deviation of a normally distributed variable can be any real number.
46)
A)
True
B)
False
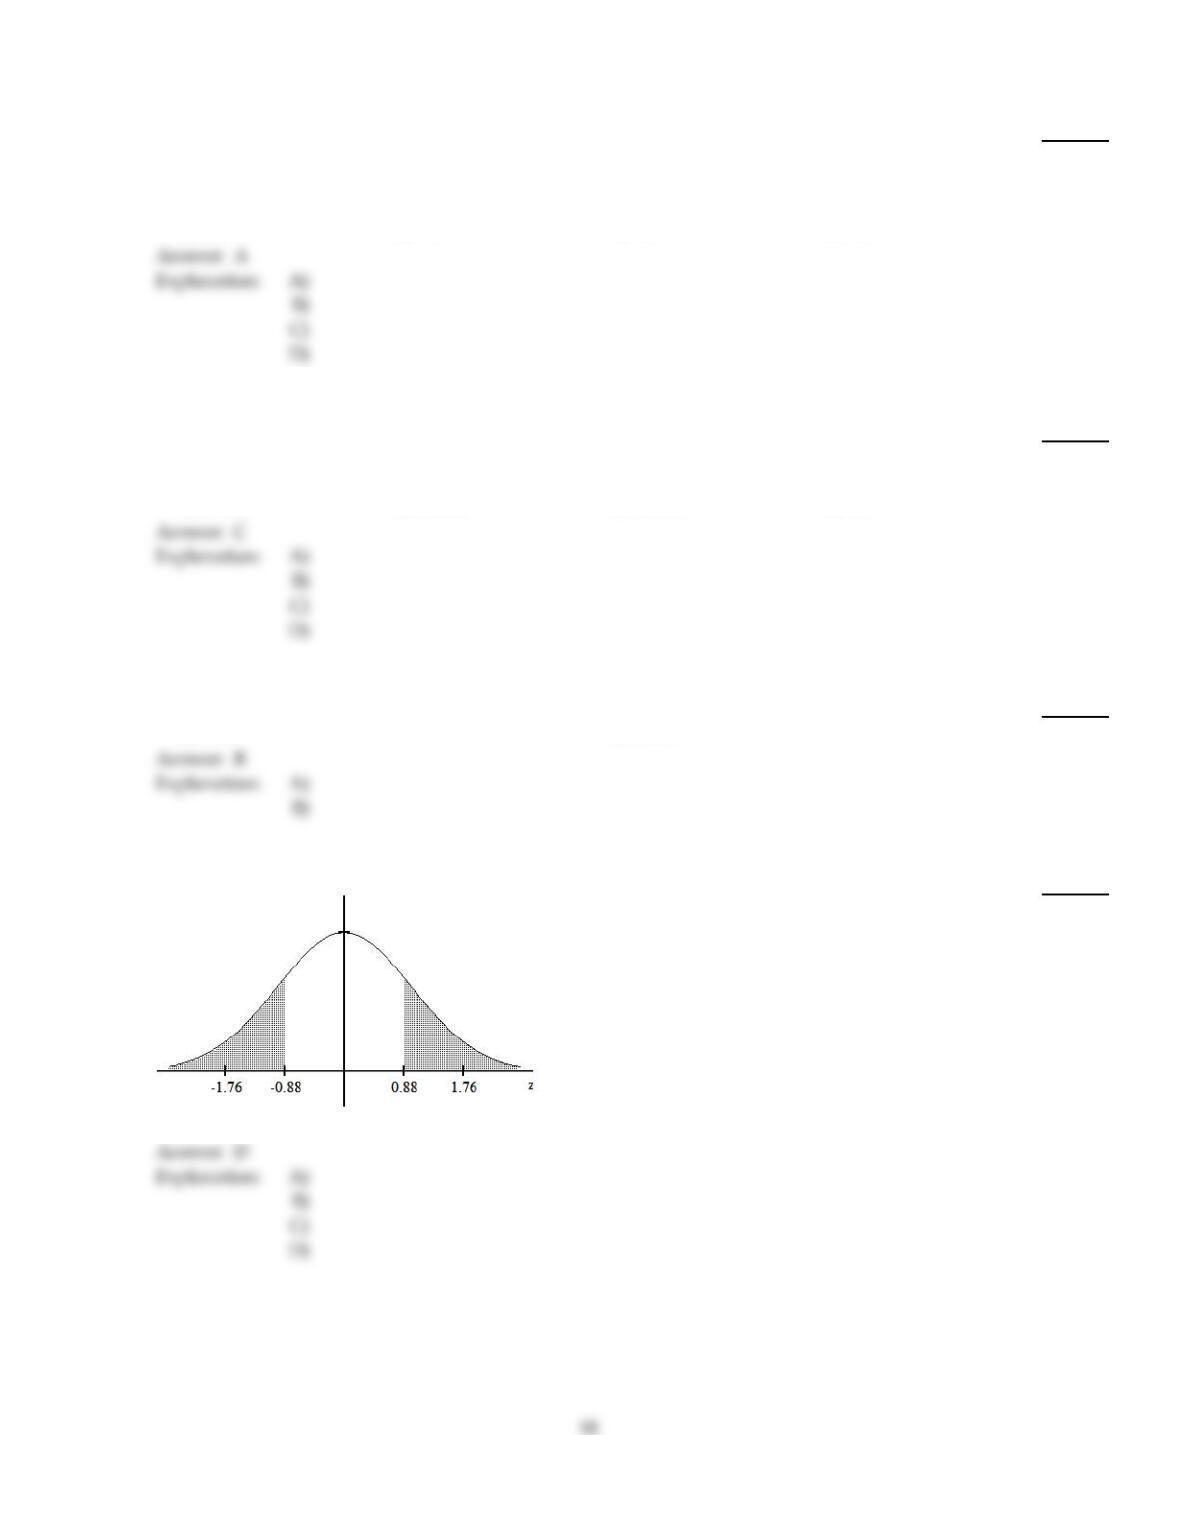
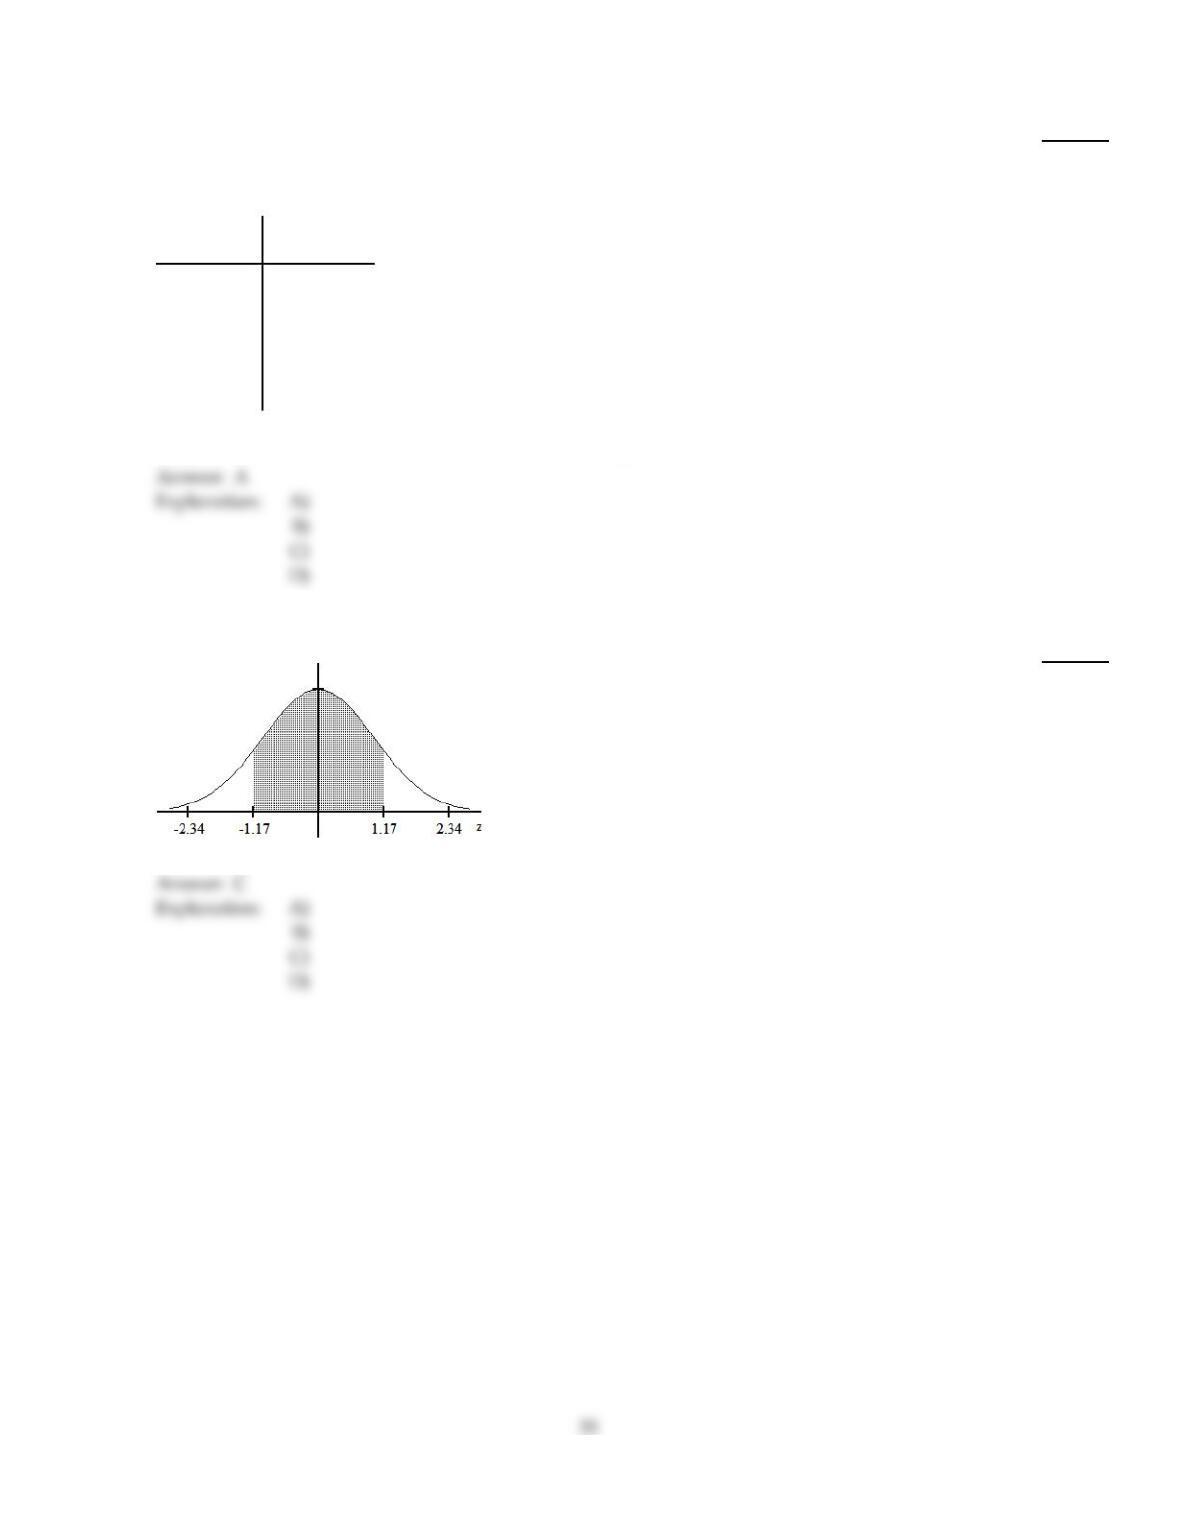
Use a table of areas to obtain the shaded area under the standard normal curve.
47)
47)
A)
0.1894
B)
0.6212
C)
0.8106
D)
0.3788
Find the indicated probability or percentage for the normally distributed variable.
48)
The variable X is normally distributed. The mean is µ= 60.0 and the standard deviation is = 4.0.
Find P(X < 53.0).
48)
A)
0.9599
B)
0.5589
C)
0.0401
D)
0.0802
Fill in the blanks by standardizing the normally distributed variable.
49)
Dave drives to work each morning at about the same time. His commute time is normally
distributed with a mean of 47 minutes and a standard deviation of 5 minutes. The percentage of
time that his commute time is less than 54 minutes is equal to the area under the standard normal
curve that lies to the ___ of __.
49)
A)
left, 1.4
B)
right, 1
C)
right, 1.4
D)
left, –1.4
Use a table of areas for the standard normal curve to find the required z–score.
50)
Find the z–score for which the area under the standard normal curve to its left is 0.96
50)
A)
–1.38
B)
1.03
C)
1.75
D)
1.82
51)
Find the z–score having area 0.09 to its left under the standard normal curve.
51)
A)
–1.26
B)
–1.45
C)
–1.39
D)
–1.34
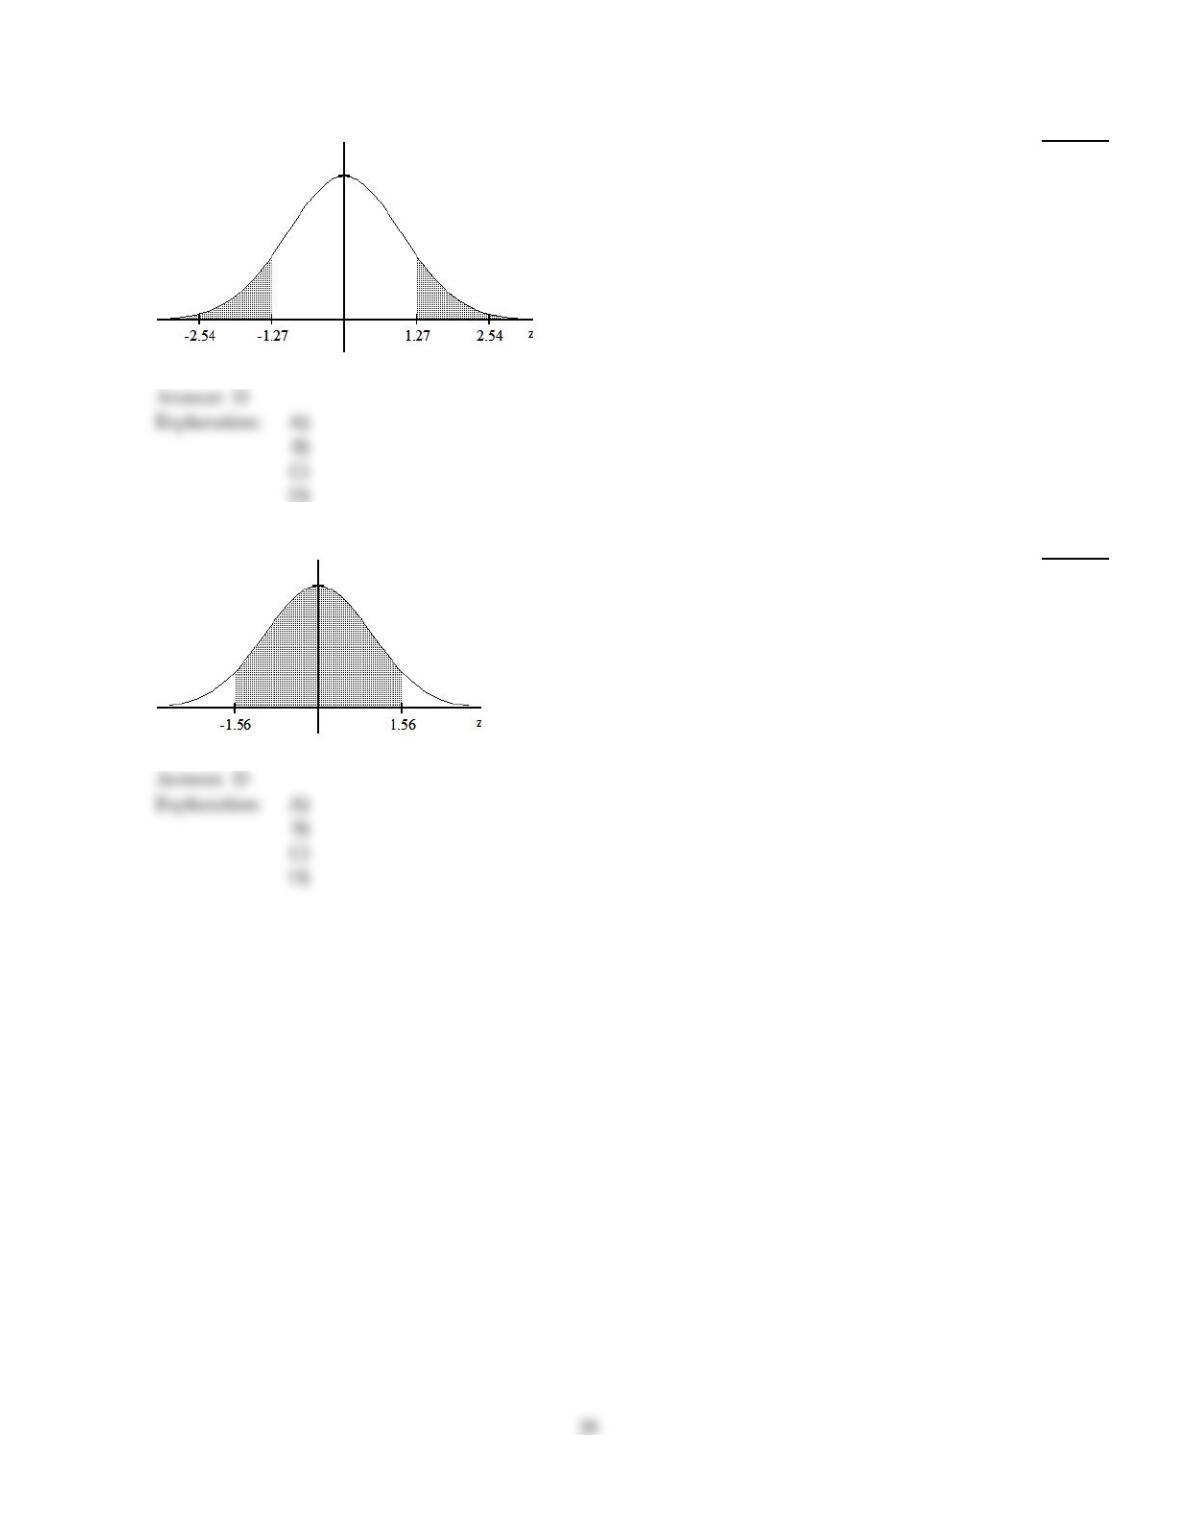
Use a table of areas to obtain the shaded area under the standard normal curve.
52)
52)
A)
0.1020
B)
0.7960
C)
0.8980
D)
0.2040
53)
53)
A)
0.0594
B)
0.1188
C)
0.9406
D)
0.8812
Solve the problem.
54)
A southeastern college has an enrollment of 2951 female students. Records show that the mean
height of these students is 64.7 inches and that the standard deviation is 2.3 inches. The table shows
frequency and relative–frequency data for these heights. If you assume that the distribution of
heights is approximately normal, then you can use the table to estimate areas under the associated
normal curve (that is, under the normal curve that has parameters µ = 64.7 and = 2.3). Making
this assumption, estimate the area under the associated normal curve to the left of 65.
Height
(inches) Freq. Relative
freq.
56–under 57 20.0007
57–under 58 70.0024
58–under 59 14 0.0047
59–under 60 31 0.0105
60–under 61 101 0.0342
61–under 62 194 0.0657
62–under 63 311 0.1054
63–under 64 410 0.1389
64–under 65 526 0.1782
65–under 66 482 0.1633
66–under 67 397 0.1345
67–under 68 254 0.0861
68–under 69 150 0.0508
69–under 70 49 0.0166
70–under 71 17 0.0058
71–under 72 50.0017
72–under 73 10.0003
54)
A)
0.1782
B)
0.5407
C)
0.4591
D)
0.3415
Find the specified percentile, quartile, or decile.
55)
The lifetimes of lightbulbs of a particular type are normally distributed with a mean of 241 hours
and a standard deviation of 12 hours. Find the first quartile, Q1.
55)
A)
238
B)
244
C)
232.96
D)
249.04
21
Solve the problem.
56)
Data were reported for household size (number of people in household) in a small community. The
size distribution is given in the table. Obtain a relative–frequency histogram for these data and
determine whether the household sizes are approximately normally distributed.
Size
(# of people) Frequency
1–under 2 4
2–under 3 33
3–under 4 30
4–under 5 12
5–under 6 6
6–under 7 3
56)
A)
No. The distribution has outliers.
B)
No. The distribution is left–skewed.
C)
No. The distribution is right–skewed.
D)
Yes. The distribution is bell–shaped.
Find the specified percentile, quartile, or decile.
57)
The serum cholesterol levels for men in one age group are normally distributed with a mean of
178.3 and a standard deviation of 40.6. All units are in mg/100 mL. Find the 9th percentile.
57)
A)
161.7 mg/100mL
B)
123.9 mg/100mL
C)
107.7 mg/100mL
D)
165.3 mg/100mL
Fill in the blanks by standardizing the normally distributed variable.
58)
Dave drives to work each morning at about the same time. His commute time is normally
distributed with a mean of 46 minutes and a standard deviation of 5 minutes. The percentage of
time that his commute time exceeds 58 minutes is equal to the area under the standard normal
curve that lies to the ___ of ___.
58)
A)
left, 2.4
B)
right, 2.4
C)
right, 12
D)
left, 1.2
22
Provide an appropriate response.
59)
Which of the variables below do you think will be roughly normally distributed?
a. Weights of 10 year old boys
b. Incomes of 40 year old adults
c. The numbers that show up when you roll a balanced die
d. The amount of coffee which a filling machine puts into “4 ounce jars”
59)
A)
a, b, d
B)
a and d
C)
a only
D)
a, b, c, d
Find the specified percentile, quartile, or decile.
60)
The weights of certain machine components are normally distributed with a mean of 8.57 g and a
standard deviation of 0.08 g. Find the 97th percentile.
60)
A)
8.79 g
B)
8.72 g
C)
8.61 g
D)
8.58 g
Fill in the blanks by standardizing the normally distributed variable.
61)
Dave drives to work each morning at about the same time. His commute time is normally
distributed with a mean of 49 minutes and a standard deviation of 8 minutes. The percentage of
time that his commute time lies between 41 and 65 minutes is equal to the area under the standard
normal curve between ___ and ___.
61)
A)
0, 1
B)
–1.5, 1.5
C)
–0.5, 2.5
D)
–1, 2
Use a table of areas to find the specified area under the standard normal curve.
62)
The area that lies to the right of –1.82
62)
A)
–0.0344
B)
0.9656
C)
0.0344
D)
0.4656
Solve the problem.
63)
Frequency data were reported for the ages of women who became mothers during one year in a
selected U.S. city. The age distribution is given in the table. Obtain a relative–frequency histogram
of these data and determine whether the ages are approximately normally distributed.
Age
(yrs) Frequency
15–under 20 101
20–under 25 270
25–under 30 285
30–under 35 479
35–under 40 867
40–under 45 1021
45–under 50 225
50–under 55 56
63)
A)
Yes. The distribution is bell–shaped.
B)
No. The distribution is J–shaped.
C)
No. The distribution is left–skewed.
D)
No. The distribution is right–skewed.
Fill in the blanks by standardizing the normally distributed variable.
64)
The amount of time that customers wait in line during peak hours at one bank is normally
distributed with a mean of 12 minutes and a standard deviation of 4 minutes. The percentage of
time that the waiting time is less than 14 minutes is equal to the area under the standard normal
curve that lies to the ___ of ___.
64)
A)
left, –0.5
B)
left, 0.5
C)
right, 0.5
D)
right, 0.83
24
Provide an appropriate response.
65)
Most problems involving normally distributed variables are one of two types.
Type A: Find a probability or percentage, e.g. find the probability that X lies in a specified range.
Type B: Find the observation corresponding to a given probability or percentage.
Suppose that scores on a test are normally distributed with a mean of 80 and a standard deviation
of 8. Which of the following questions below are of type B?
a. Find the 80th percentile.
b. Find the cutoff for the A grade if the top 10% get an A.
c. Find the percentage scoring more than 90.
d. Find the score that separates the bottom 30% from the top 70%.
e. Find the probability that a randomly selected student will score more than 80.
65)
A)
a, b, d
B)
a, b, c, d
C)
c, e
D)
b, d
Use a table of areas to find the specified area under the standard normal curve.
66)
The area that lies between –1.10 and –0.36
66)
A)
0.4951
B)
0.2239
C)
–0.2237
D)
0.2237
Fill in the blanks by standardizing the normally distributed variable.
67)
The amount of time that customers wait in line during peak hours at one bank is normally
distributed with a mean of 15 minutes and a standard deviation of 3 minutes. The percentage of
time that the waiting time exceeds 16 minutes is equal to the area under the standard normal curve
that lies to the ___ of ___.
67)
A)
left, 0.33
B)
left, 0.87
C)
right, 0.33
D)
right, –0.33
25
Use the empirical rule to solve the problem.
68)
The systolic blood pressure of 18–year–old women is normally distributed with a mean of 120
mmHg and a standard deviation of 12 mmHg. What percentage of 18–year–old women have a
systolic blood pressure that lies within 3 standard deviations to either side of the mean?
68)
A)
95.44%
B)
99.74%
C)
68.26%
D)
99.99%
Use a table of areas to find the specified area under the standard normal curve.
69)
The area that lies to the right of 0.59
69)
A)
0.2776
B)
0.2190
C)
0.7224
D)
0.2224
Find the specified percentile, quartile, or decile.
70)
A bank‘s loan officer rates applicants for credit. The ratings are normally distributed with a mean of
200 and a standard deviation of 50. Find the 6th decile.
70)
A)
212.5
B)
207.8
C)
211.3
D)
187.5
Find the indicated probability or percentage for the normally distributed variable.
71)
A bank‘s loan officer rates applicants for credit. The ratings are normally distributed with a mean of
200 and a standard deviation of 50. If an applicant is randomly selected, find the probability of a
rating that is between 170 and 220.
71)
A)
0.2257
B)
0.3811
C)
0.0703
D)
0.1554
26
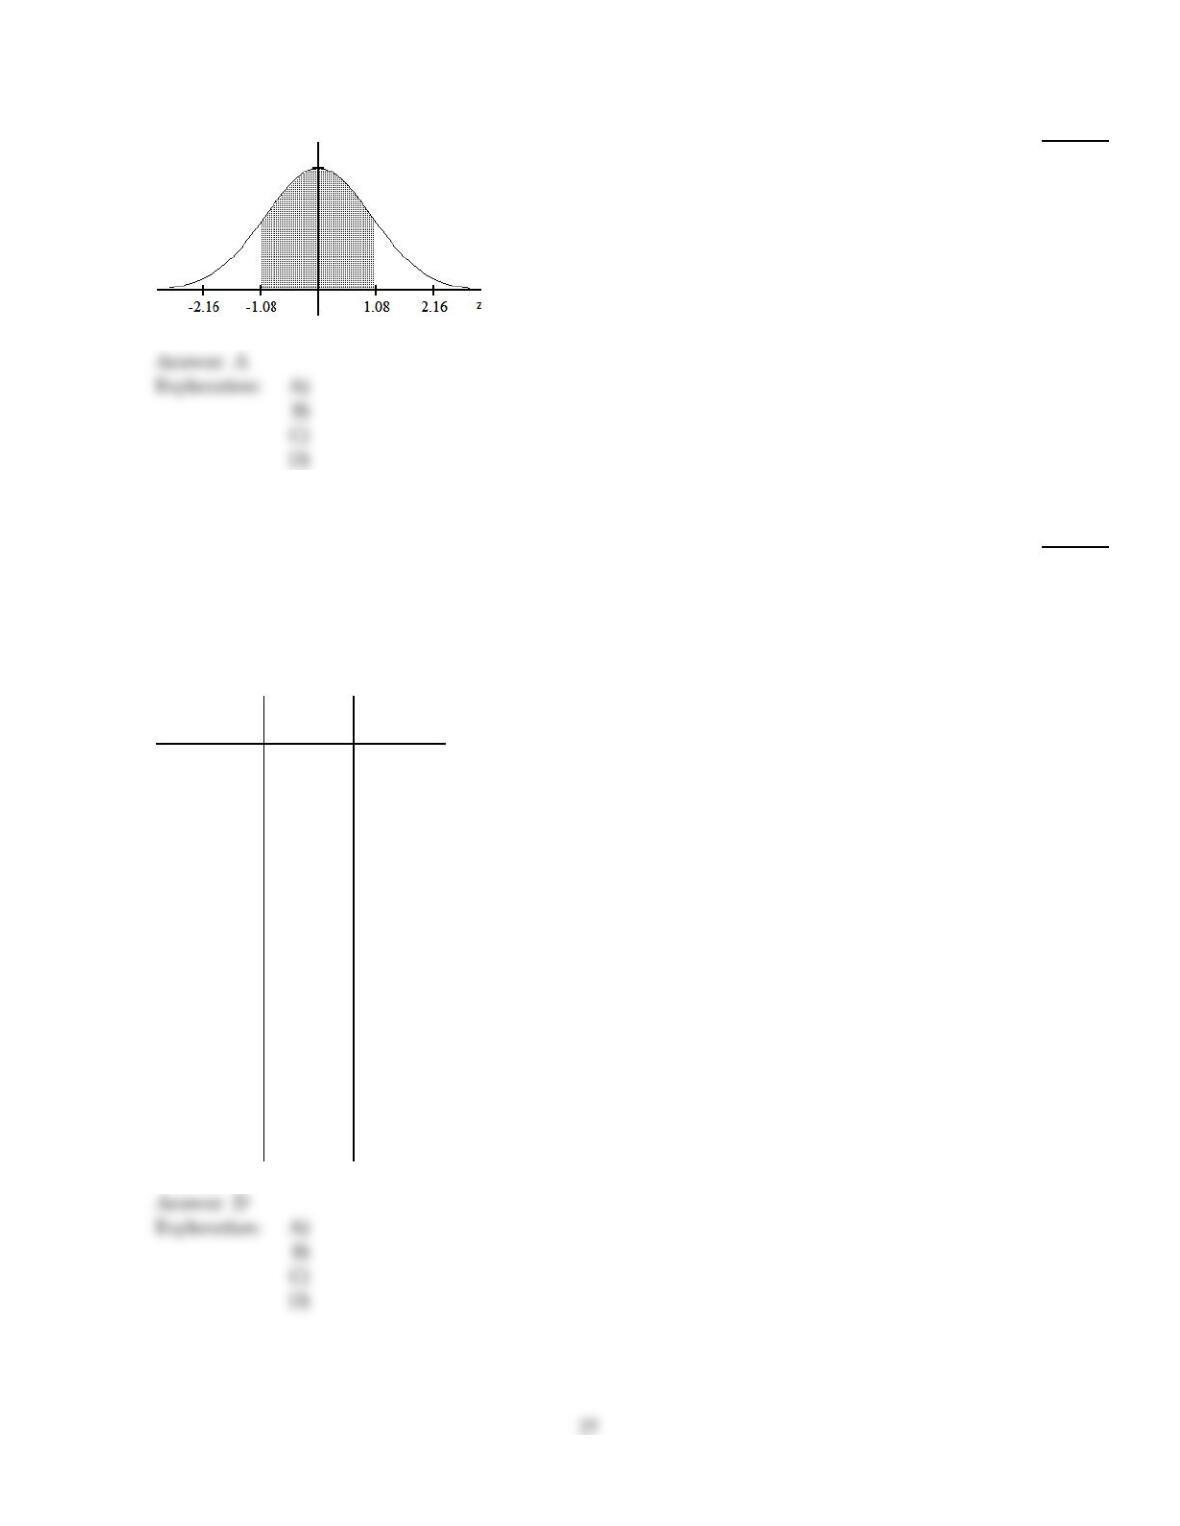
Use a table of areas to obtain the shaded area under the standard normal curve.
72)
72)
A)
0.7198
B)
0.2802
C)
0.8599
D)
0.1401
Solve the problem.
73)
A southeastern college has an enrollment of 2951 female students. Records show that the mean
height of these students is 64.7 inches and that the standard deviation is 2.3 inches. The table shows
frequency and relative–frequency data for these heights. If you assume that the distribution of
heights is approximately normal, then you can use the table to estimate areas under the associated
normal curve (that is, under the normal curve that has parameters µ = 64.7 and = 2.3). Making
this assumption, estimate the area under the associated normal curve to the right of 61.
Height
(inches) Freq. Relative
freq.
56–under 57 20.0007
57–under 58 70.0024
58–under 59 14 0.0047
59–under 60 31 0.0105
60–under 61 101 0.0342
61–under 62 194 0.0657
62–under 63 311 0.1054
63–under 64 410 0.1389
64–under 65 526 0.1782
65–under 66 482 0.1633
66–under 67 397 0.1345
67–under 68 254 0.0861
68–under 69 150 0.0508
69–under 70 49 0.0166
70–under 71 17 0.0058
71–under 72 50.0017
72–under 73 10.0003
73)
A)
0.0999
B)
0.0525
C)
0.0342
D)
0.9473
Find the specified percentile, quartile, or decile.
74)
The annual precipitation for one city is normally distributed with a mean of 30.4 inches and a
standard deviation of 2.7 inches. Find the 2nd decile.
74)
A)
24.865 inches
B)
35.935 inches
C)
28.132 inches
D)
32.668 inches
Solve the problem.
75)
Data were reported for household size (number of people in household) in a small community. The
size distribution is given in the table. Obtain a relative–frequency histogram for these data and
determine whether the household sizes are approximately normally distributed.
Size
(# of people) Frequency
1–under 2 4
2–under 3 0
3–under 4 2
4–under 5 10
5–under 6 32
6–under 7 28
7–under 8 8
8–under 9 4
75)
A)
No. The distribution has outliers.
B)
No. The distribution is left–skewed.
C)
Yes. The distribution is bell–shaped.
D)
No. The distribution is right–skewed.
Use the empirical rule to solve the problem.
76)
The annual precipitation for one city is normally distributed with a mean of 37.9 inches and a
standard deviation of 3.4 inches. Fill in the blanks.
In 99.74% of the years, the precipitation in this city is between ___ and ___ inches.
76)
A)
37.9, 48.1
B)
31.1, 37.9
C)
27.7, 48.1
D)
31.1, 44.7
28
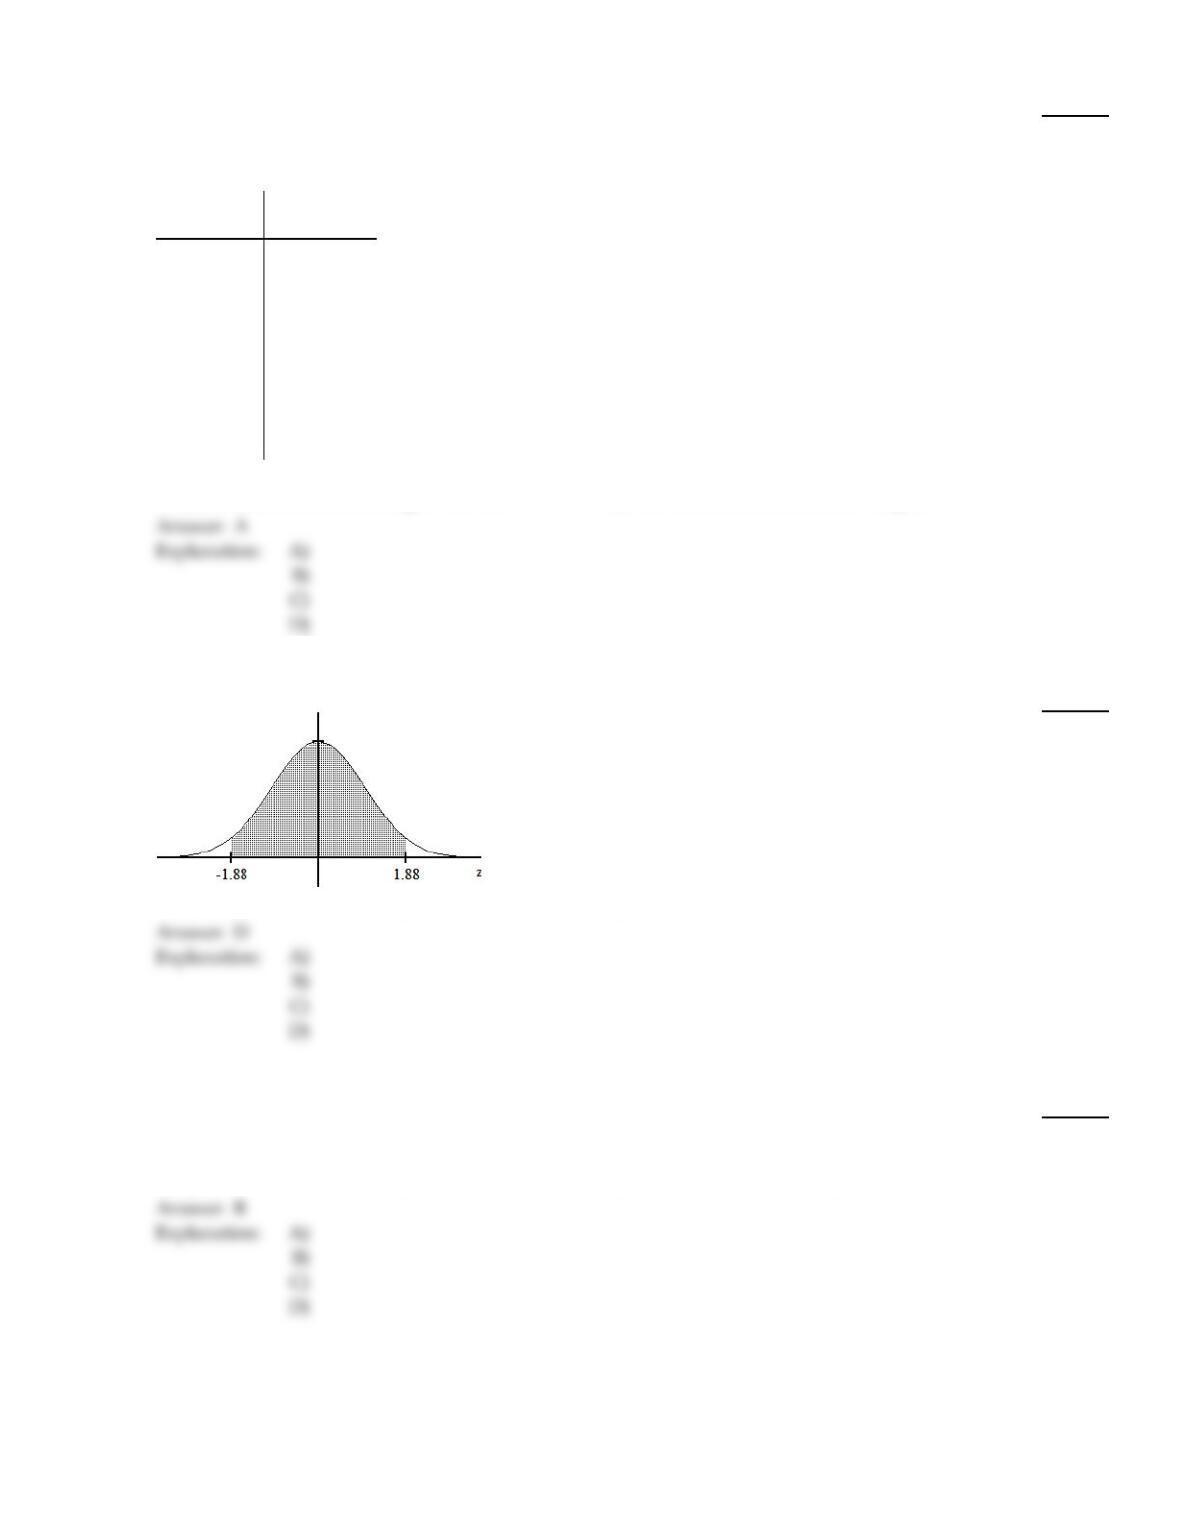
Use a table of areas to find the specified area under the standard normal curve.
77)
The area that lies either to the left of –2.61 or to the right of 0.66
77)
A)
0.7499
B)
1.2501
C)
0.7409
D)
0.2591
Find the indicated probability or percentage for the normally distributed variable.
78)
The diameters of bolts produced by a certain machine are normally distributed with a mean of 0.30
inches and a standard deviation of 0.01 inches. What percentage of bolts will have a diameter
greater than 0.32 inches?
78)
A)
2.28%
B)
47.72%
C)
37.45%
D)
97.72%
Solve the problem.
79)
Frequency data were reported for the ages of full–time employees at a company. The age
distribution is given in the table. Obtain a relative–frequency histogram of these data and
determine whether the ages are approximately normally distributed.
Age
(yrs) Frequency
25–under 30 23
30–under 35 25
35–under 40 24
40–under 45 30
45–under 50 26
50–under 55 22
55–under 60 27
60–under 65 30
65–under 70 19
79)
A)
Yes. The distribution is bell–shaped.
B)
No. The distribution is right–skewed.
C)
No. The distribution is left–skewed.
D)
No. The distribution is uniform.
80)
Frequency data were reported for the ages of full–time employees at a company. The age
distribution is given in the table. Obtain a relative–frequency histogram of these data and
determine whether the ages are approximately normally distributed.
Age
(yrs) Frequency
25–under 30 20
30–under 35 65
35–under 40 60
40–under 45 112
45–under 50 266
50–under 55 300
55–under 60 385
60–under 65 200
65–under 70 36
80)
A)
No. The distribution is left–skewed.
B)
No. The distribution is uniform.
C)
No. The distribution is right–skewed.
D)
Yes. The distribution is bell–shaped.
Use a table of areas to obtain the shaded area under the standard normal curve.
81)
81)
A)
0.0602
B)
0.9699
C)
0.0301
D)
0.9398
Use the empirical rule to solve the problem.
82)
The lifetimes of lightbulbs of a particular type are normally distributed with a mean of 400 hours
and a standard deviation of 9 hours. What percentage of the bulbs have lifetimes that lie within 1
standard deviation to either side of the mean?
82)
A)
31.74%
B)
68.26%
C)
84.13%
D)
95.44%
30
83)
The lifetimes of lightbulbs of a particular type are normally distributed with a mean of 250 hours
and a standard deviation of 6 hours. What percentage of the bulbs have lifetimes that lie within 2
standard deviations to either side of the mean?
83)
A)
97.72%
B)
99.74%
C)
68.26%
D)
95.44%
Use a table of areas to find the specified area under the standard normal curve.
84)
The area that lies between 0 and 3.01
84)
A)
0.1217
B)
0.5013
C)
0.4987
D)
0.9987
Use a table of areas for the standard normal curve to find the required z–score.
85)
Find the z–score for having area 0.07 to its right under the standard normal curve, that is, find
z0.07 .
85)
A)
1.26
B)
1.39
C)
1.45
D)
1.48
86)
Determine the two z–scores that divide the area under the standard normal curve into a middle
0.96 area and two outside 0.02 areas.
86)
A)
–1.75 and 1.75
B)
0 and 2.05
C)
–2.05 and 2.05
D)
–2.33 and 2.33
Use the empirical rule to solve the problem.
87)
The annual precipitation for one city is normally distributed with a mean of 274 inches and a
standard deviation of 3.9 inches. Fill in the blanks.
In 95.44% of the years, the precipitation in this city is between ___ and ___ inches.
87)
A)
262.3, 274
B)
266.2, 281.8
C)
262.3, 285.7
D)
274, 281.8
31
88)
The systolic blood pressure of 18–year–old women is normally distributed with a mean of 120
mmHg and a standard deviation of 12 mmHg. What percentage of 18–year–old women have a
systolic blood pressure between 96 mmHg and 144 mmHg?
88)
A)
99.74%
B)
99.99%
C)
68.26%
D)
95.44%
Provide an appropriate response.
89)
The area under the standard normal curve between 1 and 2 is equal to 0.1359. Scores on a
particular aptitude test are normally distributed with a mean of 100 and a standard deviation of
10. Which of the following are equal to 13.59%?
a. The percentage of scores between 120 and 130
b. The percentage of scores between 110 and 120
c. The percentage of scores between 80 and 90
d. The percentage of scores between 90 and 120
e. The percentage of scores between 90 and 110
89)
A)
a, b
B)
e
C)
b, c
D)
b
Find the indicated probability or percentage for the normally distributed variable.
90)
The volumes of soda in quart soda bottles are normally distributed with a mean of 32.3 oz and a
standard deviation of 1.2 oz. What is the probability that the volume of soda in a randomly selected
bottle will be less than 32 oz?
90)
A)
0.3821
B)
0.5987
C)
0.4013
D)
0.0987
32
Solve the problem.
91)
Data were reported for household size (number of people in household) in a small community. The
size distribution is given in the table. Obtain a relative–frequency histogram for these data and
determine whether the household sizes are approximately normally distributed.
Size
(# of people) Frequency
1–under 2 2
2–under 3 11
3–under 4 35
4–under 5 41
5–under 6 7
6–under 7 3
91)
A)
Yes. The distribution is bell–shaped.
B)
No. The distribution is right–skewed.
C)
No. The distribution is uniform.
D)
No. The distribution is left–skewed.
Use a table of areas to obtain the shaded area under the standard normal curve.
92)
92)
A)
0.1210
B)
0.2420
C)
0.7580
D)
0.8790
Solve the problem.
93)
Frequency data were reported for the ages of women who became mothers during one year in a
selected U.S. city. The age distribution is given in the table. Obtain a relative–frequency histogram
of these data and determine whether the ages are approximately normally distributed.
Age
(yrs) Frequency
10–under 15 10
15–under 20 87
20–under 25 888
25–under 30 679
30–under 35 245
35–under 40 227
40–under 45 123
45–under 50 79
93)
A)
No. The distribution is uniform.
B)
Yes. The distribution is bell–shaped.
C)
No. The distribution is right–skewed.
D)
No. The distribution is left–skewed.
94)
A northeastern college has an enrollment of 2835 female students. Records show that the mean
height of these students is 65.2 inches and that the standard deviation is 2.8 inches. The table shows
frequency and relative–frequency data for these heights. If you assume that the distribution of
heights is approximately normal, then you can use the table to estimate areas under the associated
normal curve (that is, under the normal curve that has parameters µ = 65.2 and = 2.8). Making
this assumption, estimate the area under the associated normal curve between 61 and 66.
Height
(inches) Freq. Relative
freq.
57–under 58 16 0.0056
58–under 59 25 0.0088
59–under 60 56 0.0198
60–under 61 96 0.0339
61–under 62 178 0.0628
62–under 63 263 0.0928
63–under 64 322 0.1136
64–under 65 388 0.1369
65–under 66 406 0.1432
66–under 67 361 0.1273
67–under 68 292 0.1030
68–under 69 201 0.0709
69–under 70 113 0.0399
70–under 71 75 0.0265
71–under 72 25 0.0088
72–under 73 16 0.0056
73–under 74 20.0007
94)
A)
0.2060
B)
0.6766
C)
0.5832
D)
0.5493
Provide an appropriate response. Assume that the variable under consideration has a density curve.
95)
The percentage of all possible observations of the variable that lie between 9 and 10 equals the area
under its density curve between and , expressed as a percentage.
95)
A)
10, 11
B)
0.09, 0.1
C)
4.5, 5
D)
9, 10
Provide an appropriate response.
96)
Which of the following statements concerning the standard normal curve is/are true (if any)?
a. The area under the standard normal curve to the left of –3 is zero.
b. The area under the standard normal curve between any two z–scores is greater than zero.
c. The area under the standard normal curve between two z–scores will be negative if both z–scores
are negative.
d. The area under the standard normal curve to the left of any z–score is less than 1.
96)
A)
a, b
B)
b, d
C)
a
D)
a, c
97)
True or false, the mean of a normally distributed variable can be any real number.
97)
A)
True
B)
False
98)
True or false, areas under the standard normal curve cannot be negative, whereas z–scores can be
positive or negative.
98)
A)
True
B)
False
Solve the problem.
99)
Frequency data were reported for the ages of women who became mothers during one year in a
selected U.S. city. The age distribution is given in the table. Obtain a relative–frequency histogram
of these data and determine whether the ages are approximately normally distributed.
Age
(yrs) Frequency
10–under 15 16
15–under 20 134
20–under 25 534
25–under 30 1043
30–under 35 982
35–under 40 399
40–under 45 94
45–under 50 7
99)
A)
No. The distribution is right–skewed.
B)
Yes. The distribution is bell–shaped.
C)
No. The distribution is left–skewed.
D)
No. The distribution is J–shaped.
Use a table of areas to find the specified area under the standard normal curve.
100)
The area that lies either to the left of 1.56 or to the right of 2.30
100)
A)
0.9513
B)
0.0487
C)
0.9299
D)
0.0701
Use the empirical rule to solve the problem.
101)
At one college, GPAs are normally distributed with a mean of 2.9 and a standard deviation of 0.6.
What percentage of students at the college have a GPA between 2.3 and 3.5?
101)
A)
99.74%
B)
68.26%
C)
84.13%
D)
95.44%
Find the specified percentile, quartile, or decile.
102)
Assume that women have heights that are normally distributed with a mean of 63.6 inches and a
standard deviation of 2.5 inches. Find the value of the third quartile.
102)
A)
64.3 inches
B)
67.8 inches
C)
65.3 inches
D)
66.1 inches
Find the indicated probability or percentage for the normally distributed variable.
103)
The variable X is normally distributed.The mean is µ= 22.0 and the standard deviation is = 2.4.
Find P(19.7 < X < 25.3).
103)
A)
0.3370
B)
0.7477
C)
1.0847
D)
0.4107
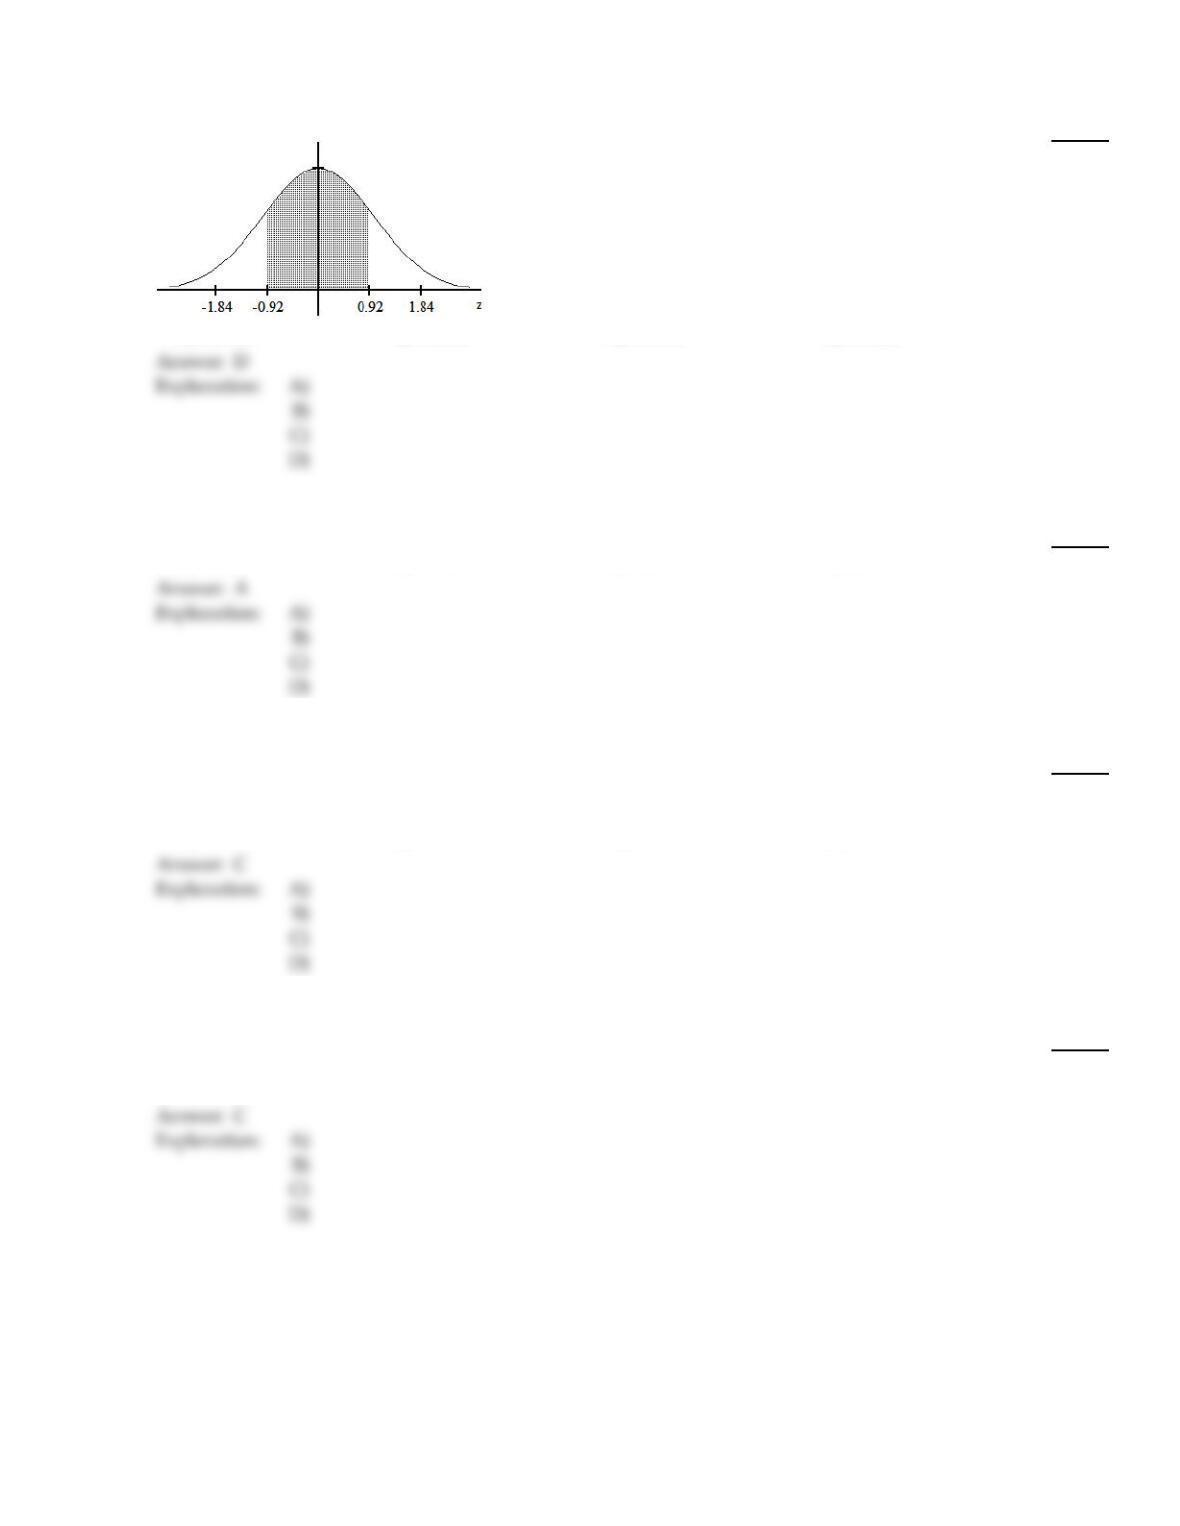
Use a table of areas to obtain the shaded area under the standard normal curve.
104)
104)
A)
0.1788
B)
0.8212
C)
0.3576
D)
0.6424
Use a table of areas for the standard normal curve to find the required z–score.
105)
Find the z–score for which the area under the standard normal curve to its left is 0.40
105)
A)
–0.25
B)
–0.57
C)
0.57
D)
0.25
Find the indicated probability or percentage for the normally distributed variable.
106)
Assume that the weights of quarters are normally distributed with a mean of 5.67 g and a standard
deviation 0.070 g. A vending machine will only accept coins weighing between 5.48 g and 5.82 g.
What percentage of legal quarters will be rejected?
106)
A)
1.62%
B)
2.48%
C)
1.96%
D)
0.0196%
Use the empirical rule to solve the problem.
107)
The amount of Jen’s monthly phone bill is normally distributed with a mean of $75 and a standard
deviation of $11. What percentage of her phone bills are between $42 and $108?
107)
A)
68.26%
B)
99.99%
C)
99.74%
D)
95.44%
38
Provide an appropriate response. Assume that the variable under consideration has a density curve.
108)
The area under the density curve that lies between 30 and 40 is 0.625. What percentage of all
possible observations of the variable are either less than 30 or greater than 40?
108)
A)
87.5%
B)
62.5%
C)
12.5%
D)
37.5%
Use a table of areas for the standard normal curve to find the required z–score.
109)
Find z0.45 .
109)
A)
0.3264
B)
–0.13
C)
0.13
D)
0.6736
Find the indicated probability or percentage for the normally distributed variable.
110)
The lengths of human pregnancies are normally distributed with a mean of 268 days and a
standard deviation of 15 days. What is the probability that a pregnancy lasts at least 300 days?
110)
A)
0.0179
B)
0.0166
C)
0.4834
D)
0.9834
Use a table of areas for the standard normal curve to find the required z–score.
111)
Find the z–score for which the area under the standard normal curve to its left is 0.04
111)
A)
–1.89
B)
–1.48
C)
–1.63
D)
–1.75
Find the specified percentile, quartile, or decile.
112)
Suppose that replacement times for washing machines are normally distributed with a mean of 9.2
years and a standard deviation of 1.2 years. Find the 82nd percentile.
112)
A)
9.7 years
B)
10.3 years
C)
8.1 years
D)
9.4 years
39
113)
The amount of Jen’s monthly phone bill is normally distributed with a mean of $59 and a standard
deviation of $9. Find the first quartile, Q1.
113)
A)
$65.03
B)
$61.25
C)
$52.97
D)
$54.5
Solve the problem.
114)
Frequency data were reported for the ages of full–time employees at a company. The age
distribution is given in the table. Obtain a relative–frequency histogram of these data and
determine whether the ages are approximately normally distributed.
Age
(yrs) Frequency
20–under 25 14
25–under 30 39
30–under 35 99
35–under 40 300
40–under 45 385
45–under 50 240
50–under 55 87
55–under 60 24
60–under 65 15
114)
A)
No. The distribution is uniform.
B)
No. The distribution is right–skewed.
C)
No. The distribution is left–skewed.
D)
Yes. The distribution is bell–shaped.
Use a table of areas for the standard normal curve to find the required z–score.
115)
Determine the two z–scores that divide the area under the standard normal curve into a middle
0.874 area and two outside 0.063 areas.
115)
A)
–1.46, 1.46
B)
–1.45, 1.45
C)
–1.53, 1.53
D)
–1.39, 1.39
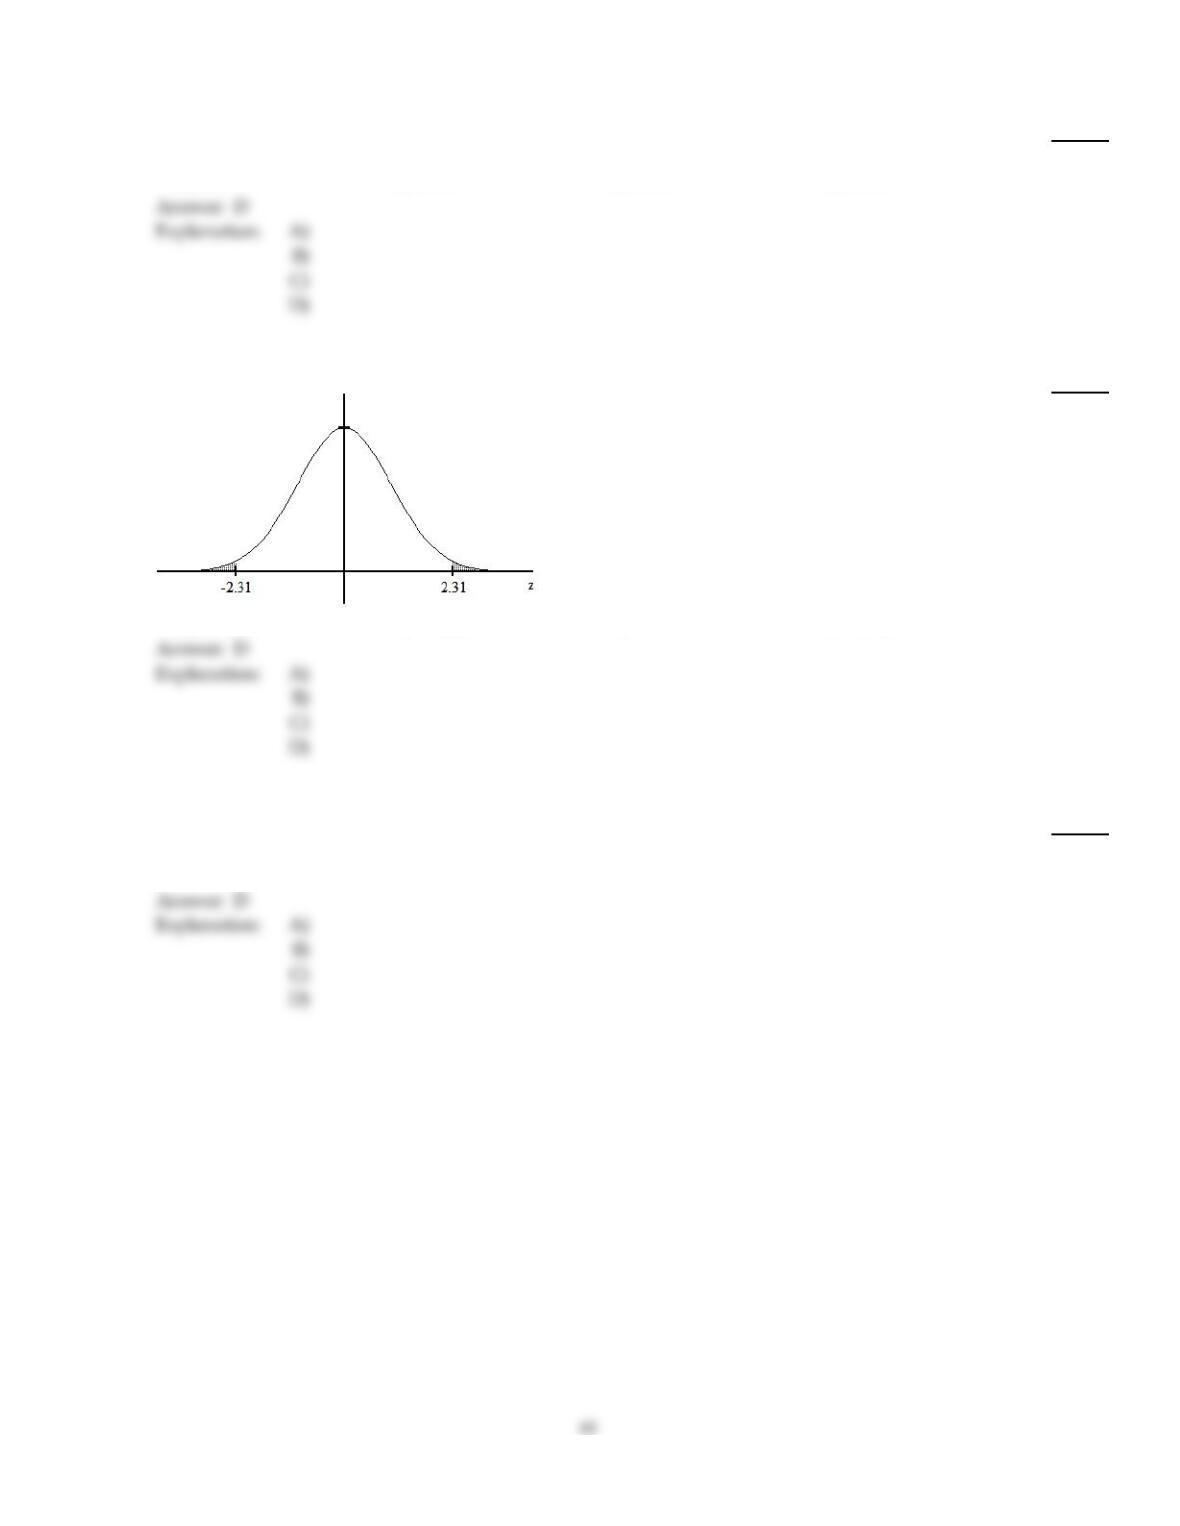
Provide an appropriate response. Assume that the variable under consideration has a density curve.
116)
Given that 31.1% of all possible observations of the variable are less than 14, determine the area
under the density curve that lies to the right of 14.
116)
A)
0.311
B)
0.439
C)
0.189
D)
0.689
Use a table of areas to obtain the shaded area under the standard normal curve.
117)
117)
A)
0.9792
B)
0.0104
C)
0.9896
D)
0.0208
Provide an appropriate response. Assume that the variable under consideration has a density curve.
118)
The area under the density curve that lies to the right of 17 is 0.470. What percentage of all possible
observations of the variable are at most 17?
118)
A)
28%
B)
47%
C)
72%
D)
53%
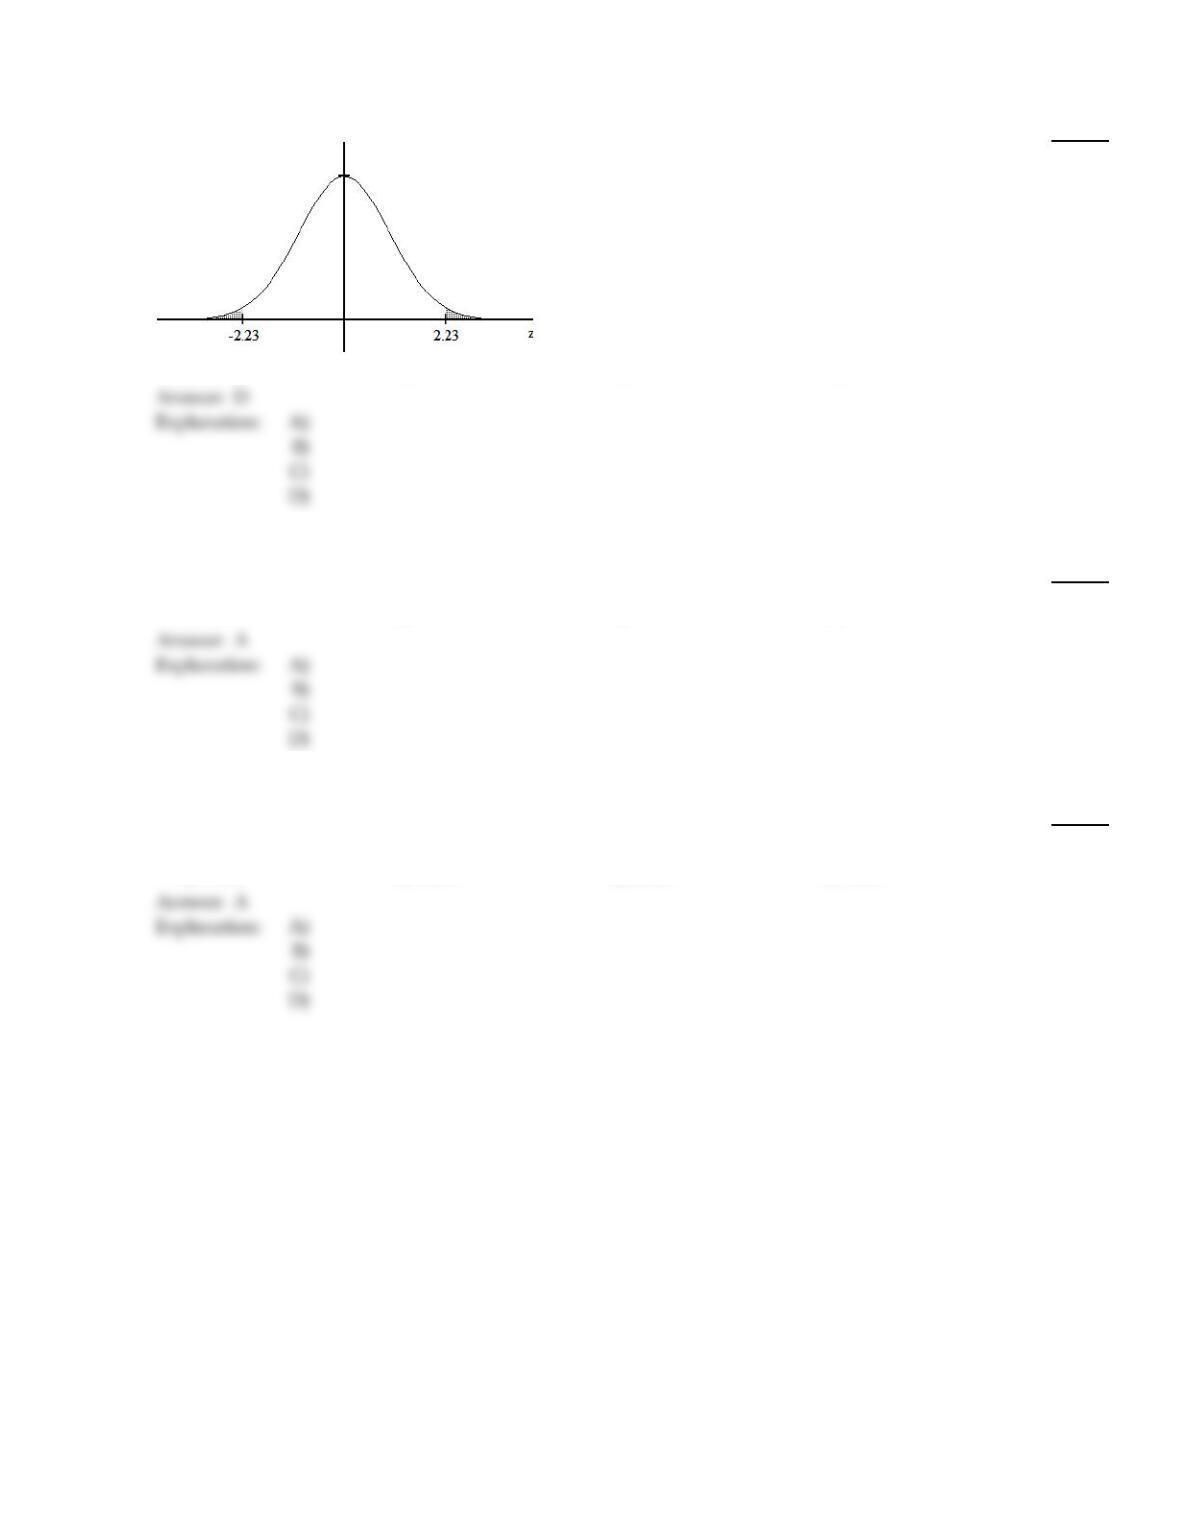
Use a table of areas to obtain the shaded area under the standard normal curve.
119)
119)
A)
0.0129
B)
0.9871
C)
0.9742
D)
0.0258
Use a table of areas for the standard normal curve to find the required z–score.
120)
Find the z–score having area 0.86 to its right under the standard normal curve; that is, find z0.86 .
120)
A)
–1.08
B)
1.08
C)
0.5557
D)
0.8051
Find the specified percentile, quartile, or decile.
121)
At one college, GPAs are normally distributed with a mean of 2.8 and a standard deviation of 0.5.
Find the third quartile, Q3.
121)
A)
3.135
B)
3.175
C)
2.465
D)
3.05
42
Solve the problem.
122)
Frequency data were reported for the ages of full–time employees at a company. The age
distribution is given in the table. Obtain a relative–frequency histogram of these data and
determine whether the ages are approximately normally distributed.
Age
(yrs) Frequency
20–under 25 5
25–under 30 60
30–under 35 443
35–under 40 340
40–under 45 231
45–under 50 75
50–under 55 87
55–under 60 35
60–under 65 15
122)
A)
No. The distribution is right–skewed.
B)
No. The distribution is left–skewed.
C)
Yes. The distribution is bell–shaped.
D)
No. The distribution is uniform.
Provide an appropriate response.
123)
Which of the following statements concerning areas under the standard normal curve is/are true?
a. If a z–score is negative, the area to its right is greater than 0.5
b. If the area to the right of a z–score is less than 0.5, the z–score is negative.
c. If a z–score is positive, the area to its left is less than 0.5
123)
A)
a, b
B)
a
C)
a, c
D)
b, c
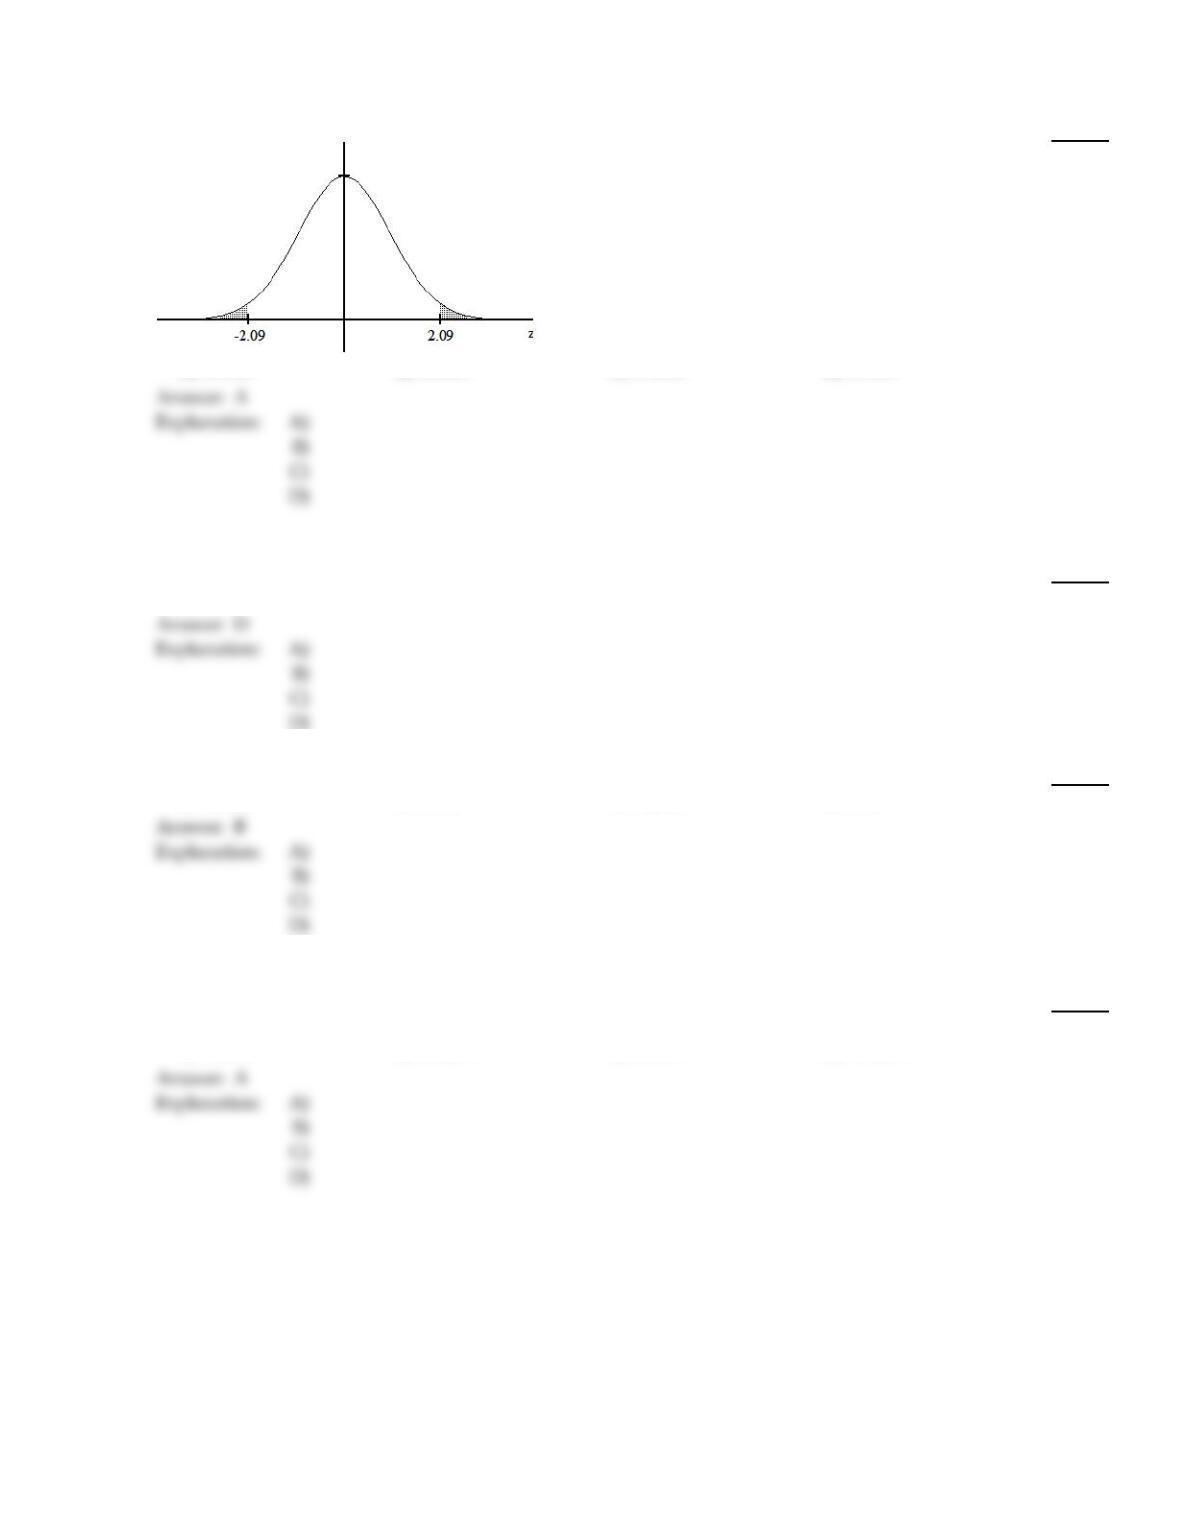
Use a table of areas to obtain the shaded area under the standard normal curve.
124)
124)
A)
0.0366
B)
0.0183
C)
0.9634
D)
0.9817
Use a table of areas to find the specified area under the standard normal curve.
125)
The area that lies to the left of 1.13
125)
A)
0.8907
B)
0.8485
C)
0.1292
D)
0.8708
126)
The area that lies between –0.73 and 2.27
126)
A)
0.4884
B)
0.7557
C)
0.2211
D)
1.54
Find the indicated probability or percentage for the normally distributed variable.
127)
The incomes of trainees at a local mill are normally distributed with a mean of $1,100 and a
standard deviation $150. What percentage of trainees earn less than $900 a month?
127)
A)
9.18%
B)
40.82%
C)
35.31%
D)
90.82%
44
Answer Key
Testname: C6
45
Answer Key
Testname: C6
46
Answer Key
Testname: C6
47
Answer Key
Testname: C6
Answer Key
Testname: C6
49
Answer Key
Testname: C6