Page 1
1.
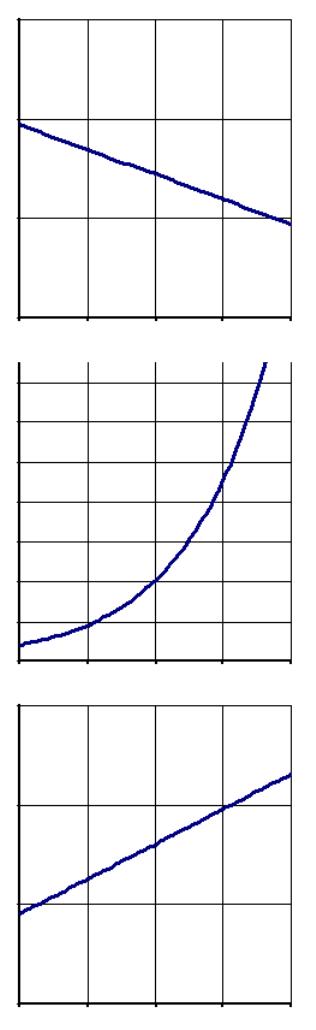
Which of the following functions would appear as a straight line on a semi-log plot?
A)
43 –15yx=
B)
36 1.1x
y=
Page 2
2.
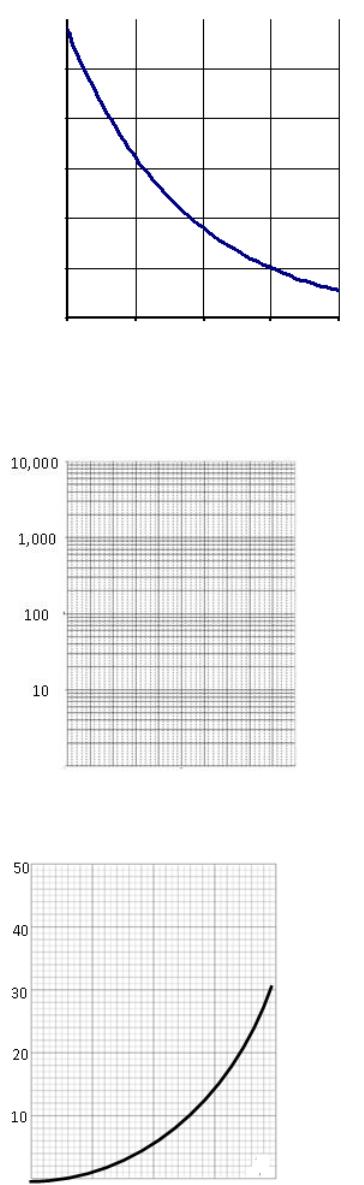
Which of the following is a semi-log plot of the function
4 1.25x
y=
A)
B)
C)
Page 3
D)
3.
Graph the function
( )
53
x
y=
over the interval
06x
4.
Identify the scale used on the vertical axis of this graph.
A)
Linear scale
B)
Logarithmic scale
C)
Power-of-10 scale
Page 4
5.
Which of the following functions would not appear as a straight line on a semi-log plot?
A)
45+12yx=
B)
12 0.7x
y=
C)
( )
log( ) log(56) log(0.8)yx=+
6.
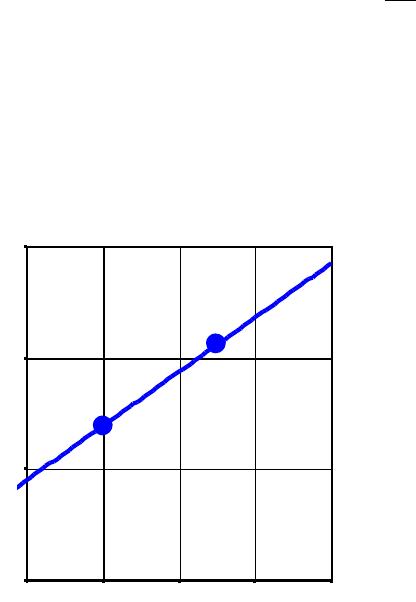
Find the formula for the function pictured on the semi-log plot given that the 2 points
pictured are
(2,2)
and
(8,4)
Write your answer in
x
y C a=
form.
7.
Write the exponential function,
1.22 20x
y=
, in an equivalent logarithmic form,
log( ) log( ) log( )y C a x=+
.
8.
Find the exponential function from the given equivalent logarithmic form,
( )
log( ) log(1.38) log(35)yx=+
.
Write your answer in
x
y C a=
form.
9.
Write the exponential function,
1.23 5x
y=
, in an equivalent logarithmic form,
log( )y b mx=+
.
Round values to 2 decimal places, if necessary.
Page 5
10.
Find the equivalent exponential function from the given logarithmic form,
log( ) 0.14 1.53yx=+
.
Write your answer in
x
y C a=
form and round values to 2 decimal places.
Page 6
Answer Key