Supply, Demand, and Government Policies 1435
71.
When a binding price floor is imposed on a market to benefit sellers,
a.
every seller in the market benefits.
b.
all buyers and sellers benefit.
c.
every seller who wants to sell the good will be able to do so, but only if he appeals to the
personal biases of
the buyers.
d.
some sellers will not be able to sell any amount of the good.
72.
A binding price floor will reduce a firm‘s total revenue
a.
always.
b.
when demand is elastic.
c.
when demand is inelastic.
d.
never.
1436 Supply, Demand, and Government Policies
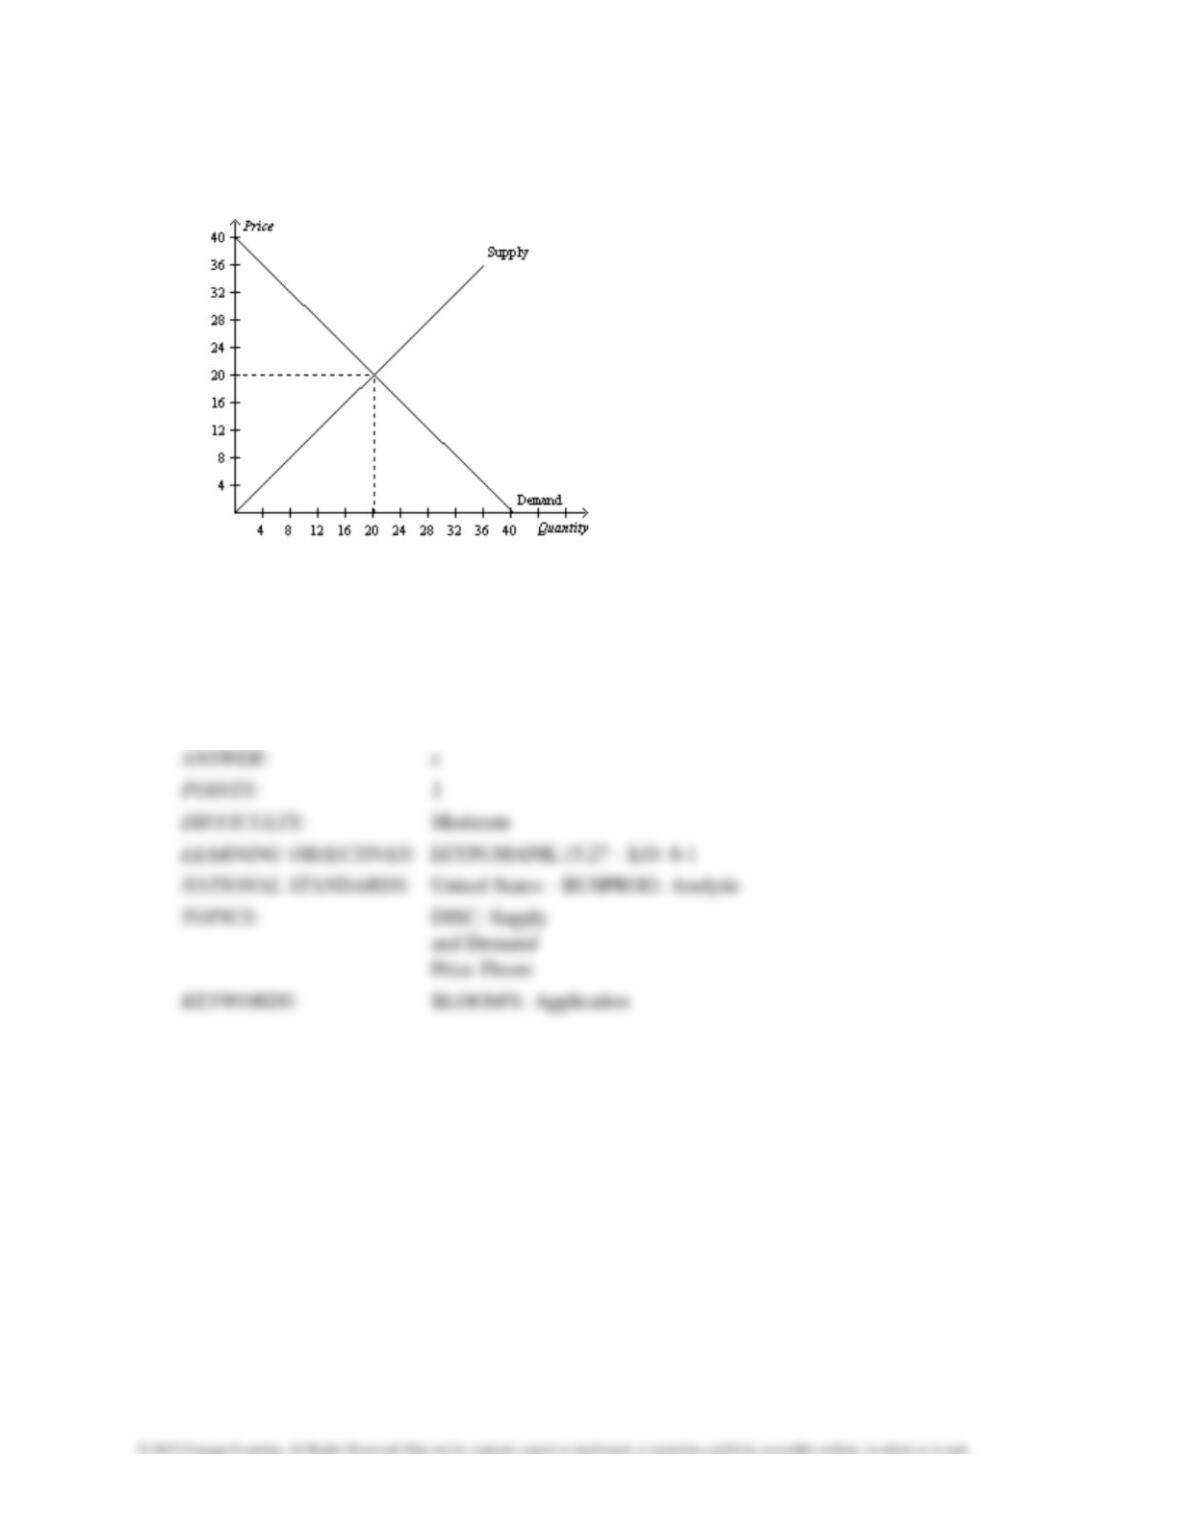
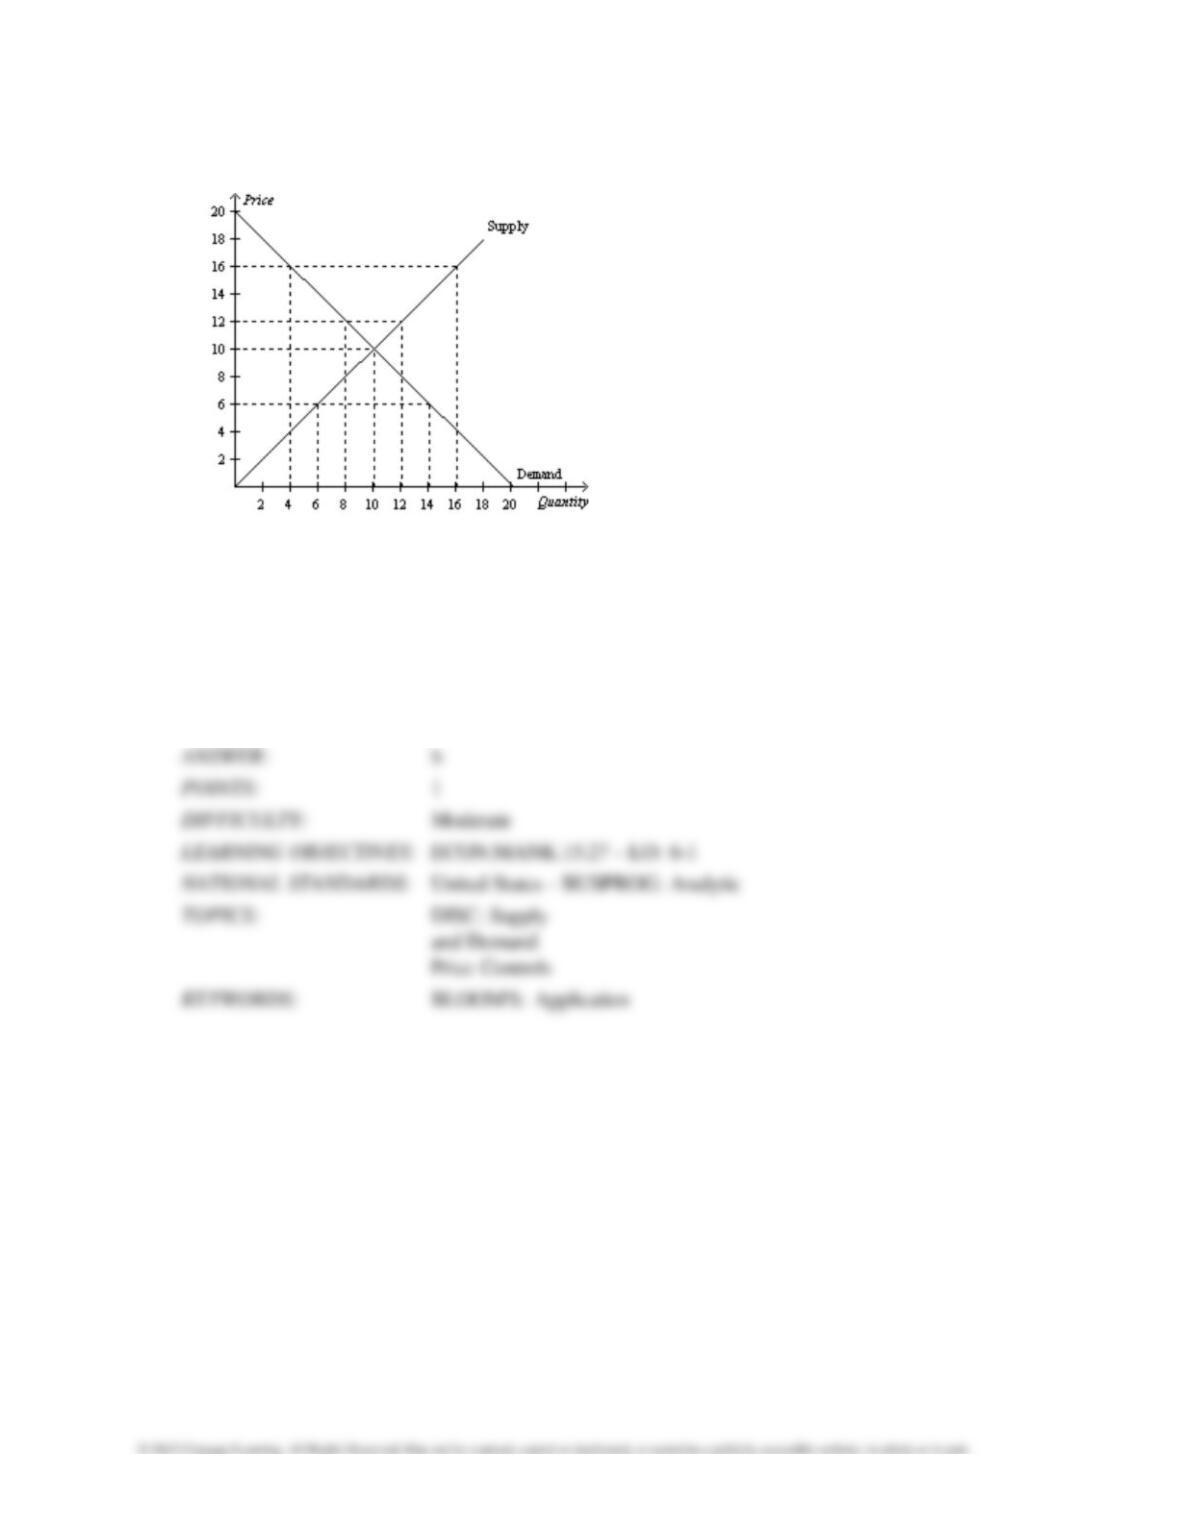
Figure 6-17
This figure shows the market demand and market supply curves for good Y
73.
Refer to Figure 6-17. A government-imposed price of $24 in this market is an example of a
a.
binding price ceiling that creates a shortage.
b.
non-binding price ceiling that creates a shortage.
c.
binding price floor that creates a surplus.
d.
non-binding price floor that creates a surplus.
74.
Refer to Figure 6-17. A government-imposed price of $12 in this market is an example of a
a.
binding price ceiling that creates a shortage.
b.
non-binding price ceiling that creates a shortage.
c.
binding price floor that creates a surplus.
d.
non-binding price floor that creates a surplus.
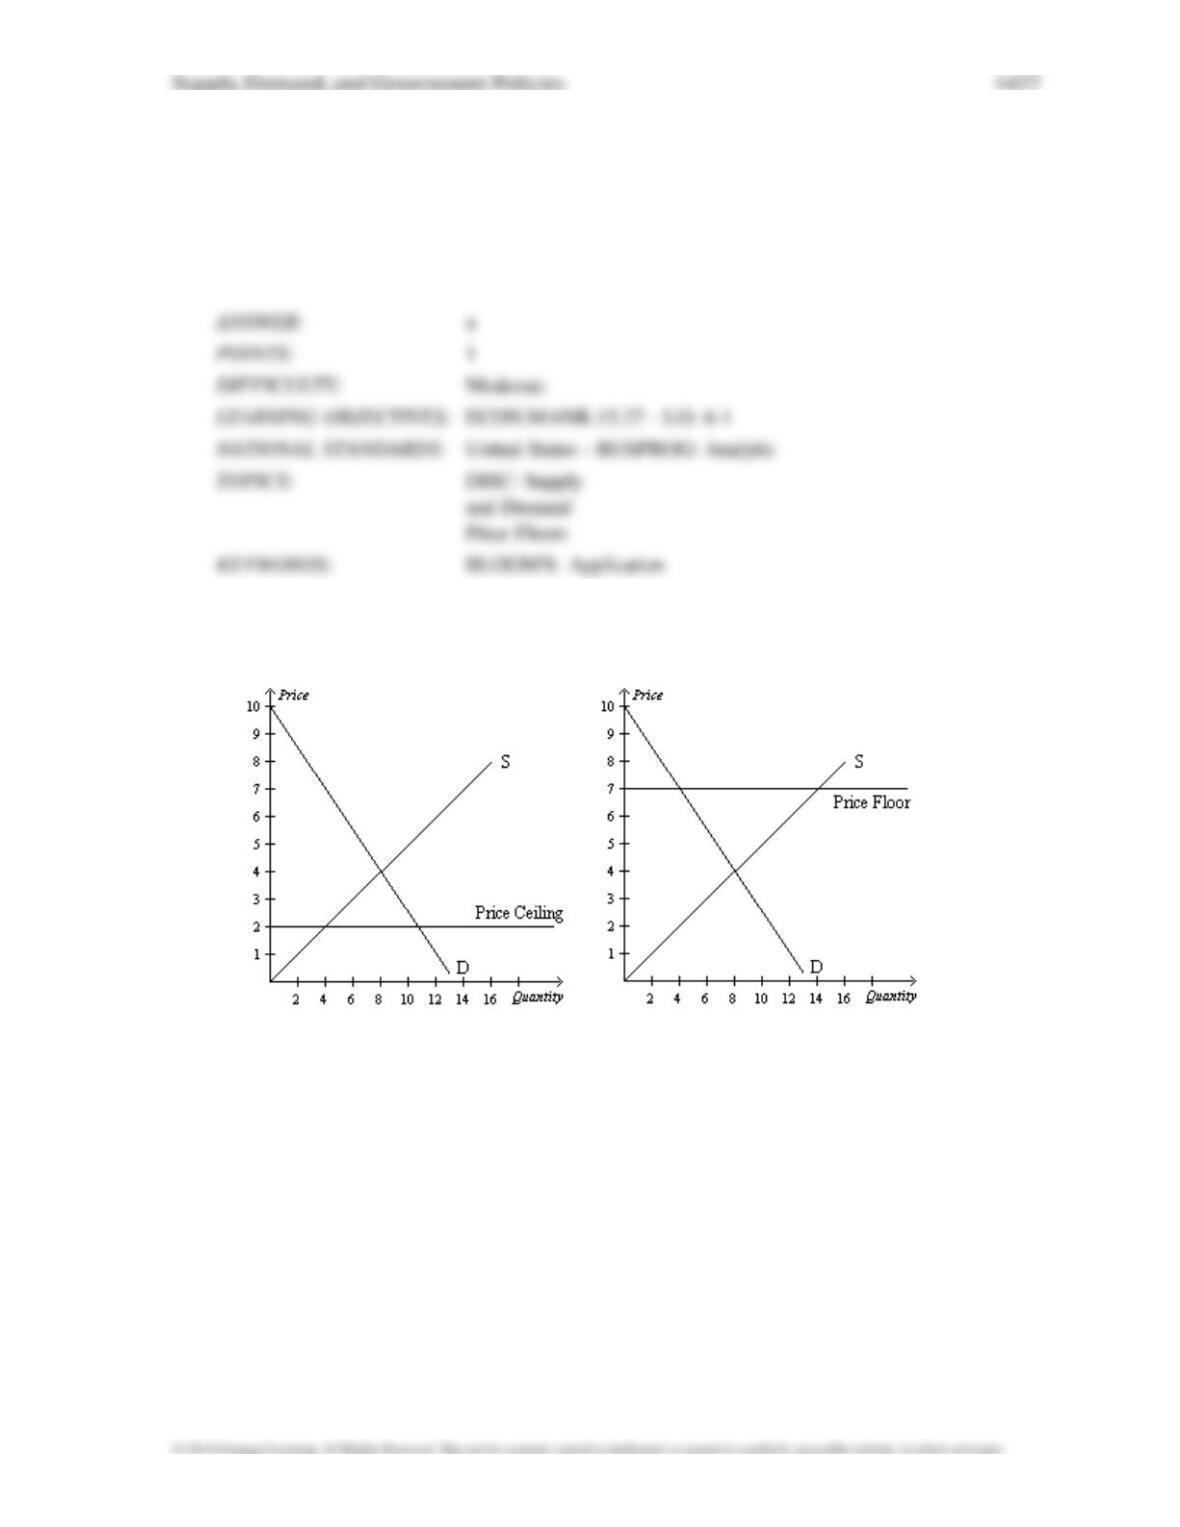
Figure 6-3
Panel (a) Panel (b)

75.
Refer to Figure 6–3. A binding price floor is shown in
a.
both panel (a) and panel (b).
b.
panel (a) only.
c.
panel (b) only.
d.
neither panel (a) nor panel (b).
76.
Refer to Figure 6-3. A nonbinding price floor is shown in
a.
both panel (a) and panel (b).
b.
panel (a) only.
c.
panel (b) only.
d.
neither panel (a) nor panel (b).
77.
Refer to Figure 6-3. In panel (b), there will be
a.
a shortage.
b.
equilibrium in the market.
c.
a surplus.
d.
lines of people waiting to buy the good.
78.
Refer to Figure 6-3. In panel (a), there will be
a.
a shortage.
b.
equilibrium in the market.
c.
a surplus.
d.
lines of people waiting to buy the good.
79.
An outcome that can result from either a price ceiling or a price floor is
a.
a surplus in the market.
b.
a shortage in the market.
c.
a nonbinding price control.
d.
long lines of frustrated buyers.
80.
An outcome that can result from either a price ceiling or a
price floor is
a.
an enhancement of efficiency.
b.
undesirable rationing mechanisms.
c.
a surplus.
d.
a shortage.
81.
Price ceilings and price floors that are binding
a.
are desirable because they make markets more efficient and more fair.
b.
cause surpluses and shortages to persist because price cannot adjust to the market equilibrium
price.
c.
can have the effect of restoring a market to equilibrium.
d.
are imposed because they can make the poor in the economy better off without causing
adverse effects.
82.
When government imposes a price ceiling or a price floor on a market,
a.
price no longer serves as a rationing device.
b.
efficiency in the market is enhanced.
c.
shortages and surpluses are eliminated.
d.
both buyers and sellers become better off.
83.
You have responsibility for economic policy in the country of Freedonia. Recently, the
neighboring country of
Sylvania has cut off all exports of oranges to Freedonia. George, who is
one of your advisors, says that the best
way to avoid a shortage of oranges is to take no action
at all. Charles, another one of your advisors, argues that
without a binding price floor, a shortage
will certainly develop. Otto, a third advisor, suggests that you should impose
a binding price
ceiling in order to avoid a shortage of oranges. Which of your three advisors is most likely to
have
studied economics?
a.
George
b.
Charles
c.
Otto
d.
Apparently, all three advisors have studied economics, but their views on positive economics
are different.
84.
When policymakers set prices by legal decree, they
a.
are usually following the advice of mainstream economists.
b.
improve the organization of economic activity.
c.
obscure the signals that normally guide the allocation of society’s resources.
d.
are demonstrating a willingness to sacrifice fairness for the sake of a gain in efficiency.
85.
Consider the market for gasoline. Buyers
a.
and sellers would lobby for a price ceiling.
b.
and sellers would lobby for a price floor.
c.
would lobby for a price ceiling, whereas sellers would lobby for a price floor.
d.
would lobby for a price floor, whereas sellers would lobby for a price ceiling.
1444 Supply, Demand, and Government Policies
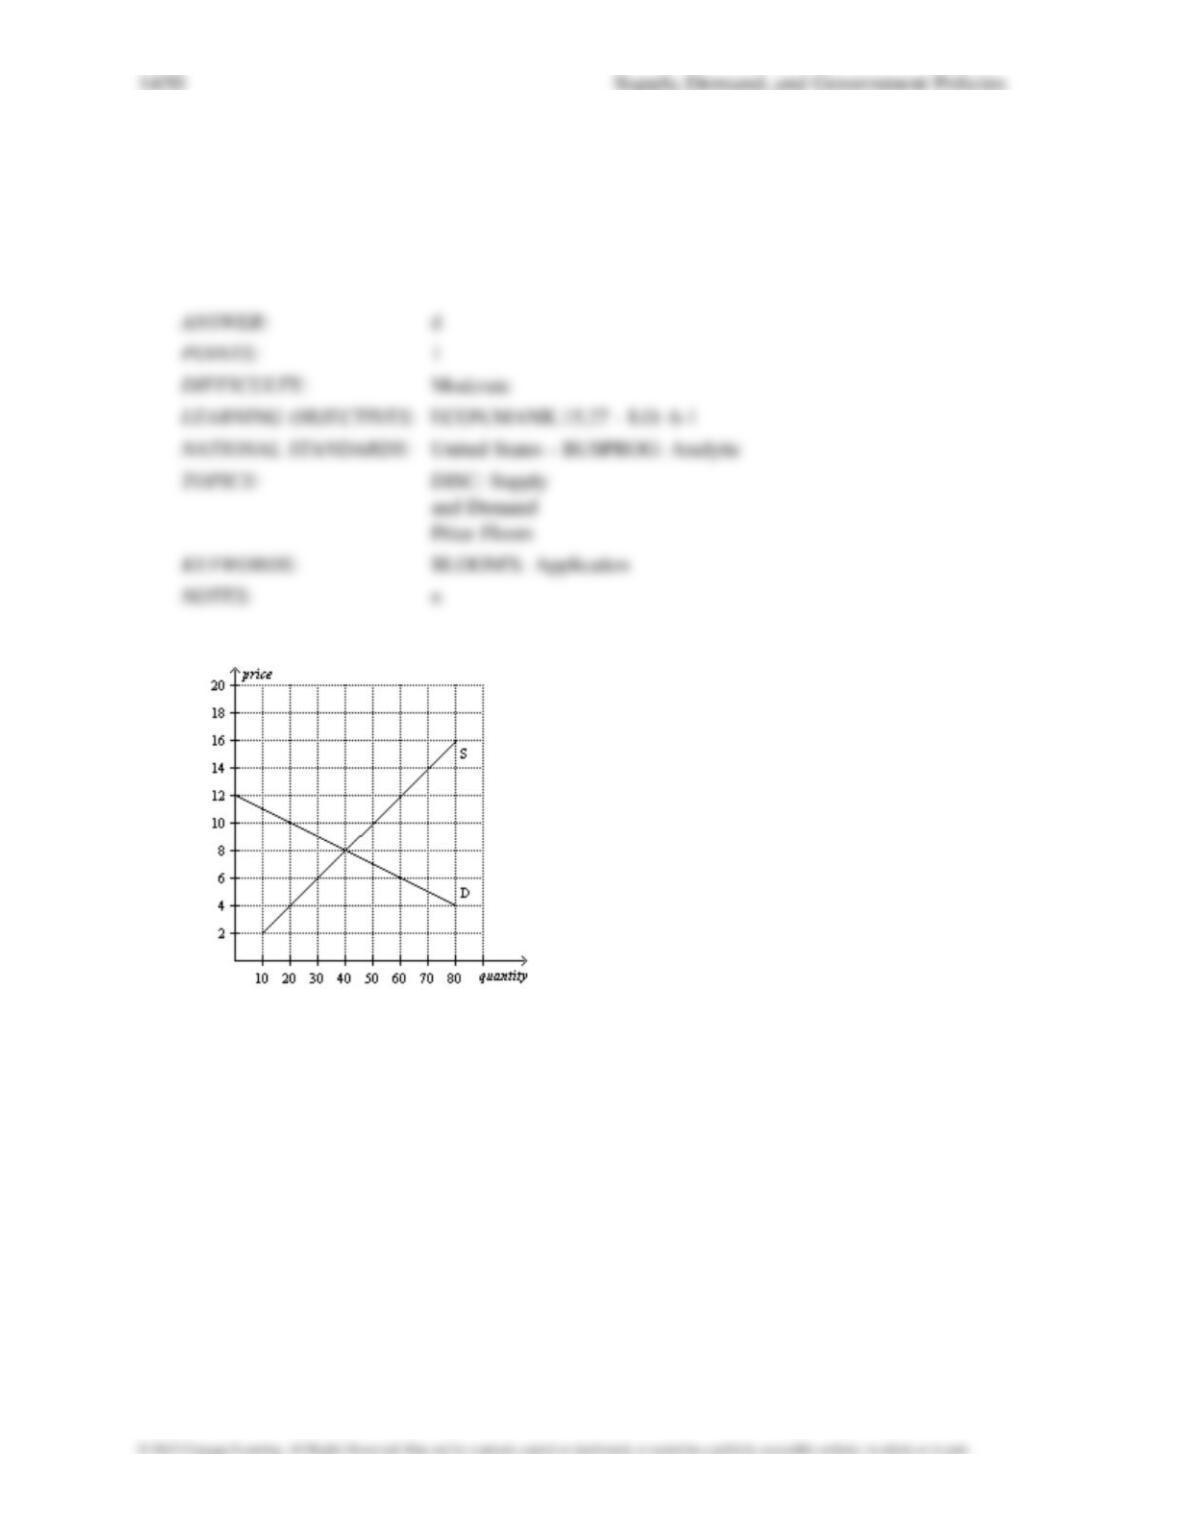
Figure 6-4
86.
Refer to Figure 6-4. Which of the following statements is not
correct?
a.
When the price is $10, quantity supplied equals quantity demanded.
b.
When the price is $6, there is a surplus of 8 units.
c.
When the price is $12, there is a surplus of 4 units.
d.
When the price is $16, quantity supplied exceeds quantity demanded by 12 units.
87.
Refer to Figure 6-4. A government-imposed price of $6 in this market could be an example of a
(i)
binding price ceiling.
(ii)
non–binding price ceiling.
(iii)
binding price floor.
(iv)
non–binding price floor.
a.
(i) only
b.
(ii) only
c.
(i) and (iv) only
d.
(ii) and (iii) only
88.
Refer to Figure 6-4. A government-imposed price of $16 in this market could be an example of
a
(i)
binding price ceiling.
(ii)
non–binding price ceiling.
(iii)
binding price floor.
(iv)
non–binding price floor.
a.
(i) only
b.
(ii) only
c.
(i) and (iv) only
d.
(ii) and (iii) only
89.
Refer to Figure 6-4. A government-imposed price of $12 in this market is an example of a
a.
binding price ceiling that creates a shortage.
b.
non-binding price ceiling that creates a shortage.
c.
binding price floor that creates a surplus.
d.
non-binding price floor that creates a surplus.
90.
Refer to Figure 6-4. A government-imposed price of $6 in this market is an example of a
a.
binding price ceiling that creates a shortage.
b.
non-binding price ceiling that creates a shortage.
c.
binding price floor that creates a surplus.
d.
non-binding price floor that creates a surplus.
91.
Refer to Figure 6-4. A government-imposed price ceiling of $6 in this market results in
a.
a shortage of 8 units.
b.
a shortage of 4 units.
c.
14 units sold.
d.
10 units sold.
92.
Refer to Figure 6-4. A government-imposed price floor of $12 in this market results in
a.
a surplus of 2 units.
b.
a surplus of 4 units.
c.
12 units sold.
d.
10 units sold.
1448 Supply, Demand, and Government Policies
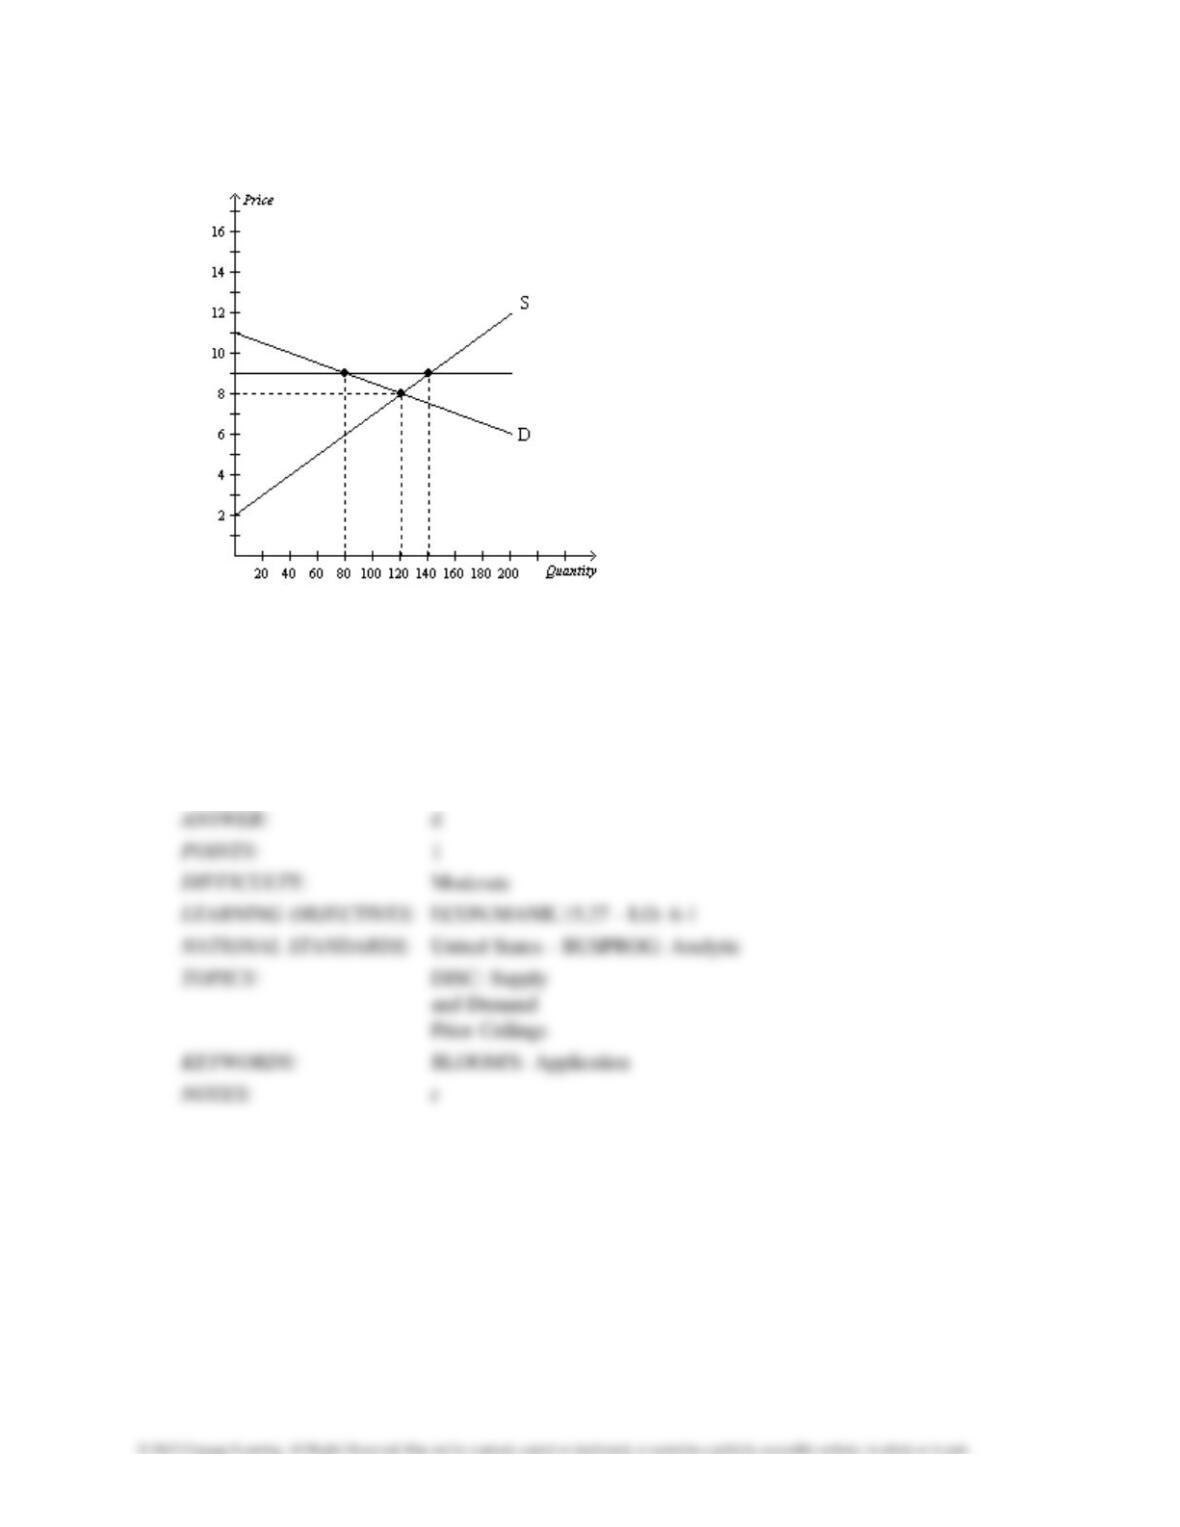
Figure 6-5
93.
Refer to Figure 6-5. If the horizontal line on the graph represents a price ceiling, then the price
ceiling is
a.
binding and creates a surplus of 60 units of the good.
b.
binding and creates a surplus of 20 units of the good.
c.
not binding but creates a surplus of 40 units of the good.
d.
not binding, and there will be no surplus or shortage of the good.
94.
Refer to Figure 6-5. If the horizontal line on the graph represents a price floor, then the price
floor is
a.
binding and creates a surplus of 60 units of the good.
b.
binding and creates a surplus of 20 units of the good.
c.
binding and creates a surplus of 40 units of the good.
d.
not binding, and there will be no surplus or shortage of the good.
95.
Refer to Figure 6-5. Suppose the market is initially in equilibrium. Then the government
imposes a price control,
as represented by the horizontal line on the graph. If the price control is
a price floor, then the price control
a.
causes the quantity demanded to decrease by 50 units, relative to the initial equilibrium.
b.
causes the quantity supplied to increase by 40 units, relative to the initial equilibrium.
c.
results in some firms being more successful than others in selling their goods.
d.
All of the above are correct.
96.
Refer to Figure 6-5. If government imposes a price floor at $9, then the price floor causes
a.
quantity demanded to decrease by 40 units.
b.
quantity supplied to increase by 20 units.
c.
a surplus of 60 units.
d.
All of the above are correct.
Figure 6-6
97.
Refer to Figure 6-6. Which of the following price ceilings would be binding in this market?
a. $8
b. $6
c. $12
d. $10
98.
Refer to Figure 6-6. Which of the following price floors would be binding in this market?
a. $6
b. $8
c. $10
d. $4
99.
Refer to Figure 6-6. Which of the following statements is correct?
a.
A price ceiling set at $12 would be binding, but a price ceiling set at $8 would not be binding.
b.
A price floor set at $8 would be binding, but a price ceiling set at $8 would not be binding.
c.
A price ceiling set at $9 would result in a surplus.
d.
A price floor set at $11 would result in a surplus.
100.
Refer to Figure 6-6. Which of the following statements is not correct?
a.
A price ceiling set at $6 would be binding, but a price ceiling set at $12 would not be binding.
b.
A price floor set at $14 would be binding, but a price floor set at $8 would not be binding.
c.
A price ceiling set at $9 would result in a shortage.
d.
A price floor set at $6 would result in a shortage.
101.
Refer to Figure 6-6. If the government imposes a price ceiling of $8 on this market, then there
will be
a.
no shortage.
b.
a shortage of 10 units.
c.
a shortage of 20 units.
d.
a shortage of 40 units.
102.
Refer to Figure 6-6. If the government imposes a price ceiling of $6 on this market, then there
will be
a.
no shortage.
b.
a shortage of 10 units.
c.
a shortage of 20 units.
d.
a shortage of 30 units.
103.
Refer to Figure 6-6. If the government imposes a price floor of $6 on this market, then there
will be
a.
no surplus.
b.
a surplus of 20 units.
c.
a surplus of 30 units.
d.
a surplus of 40 units.
104.
Refer to Figure 6-6. If the government imposes a price floor of $10 on this market, then there
will be
a.
no surplus.
b.
a surplus of 20 units.
c.
a surplus of 30 units.
d.
a surplus of 10 units.