Chapter 6 – Inventories
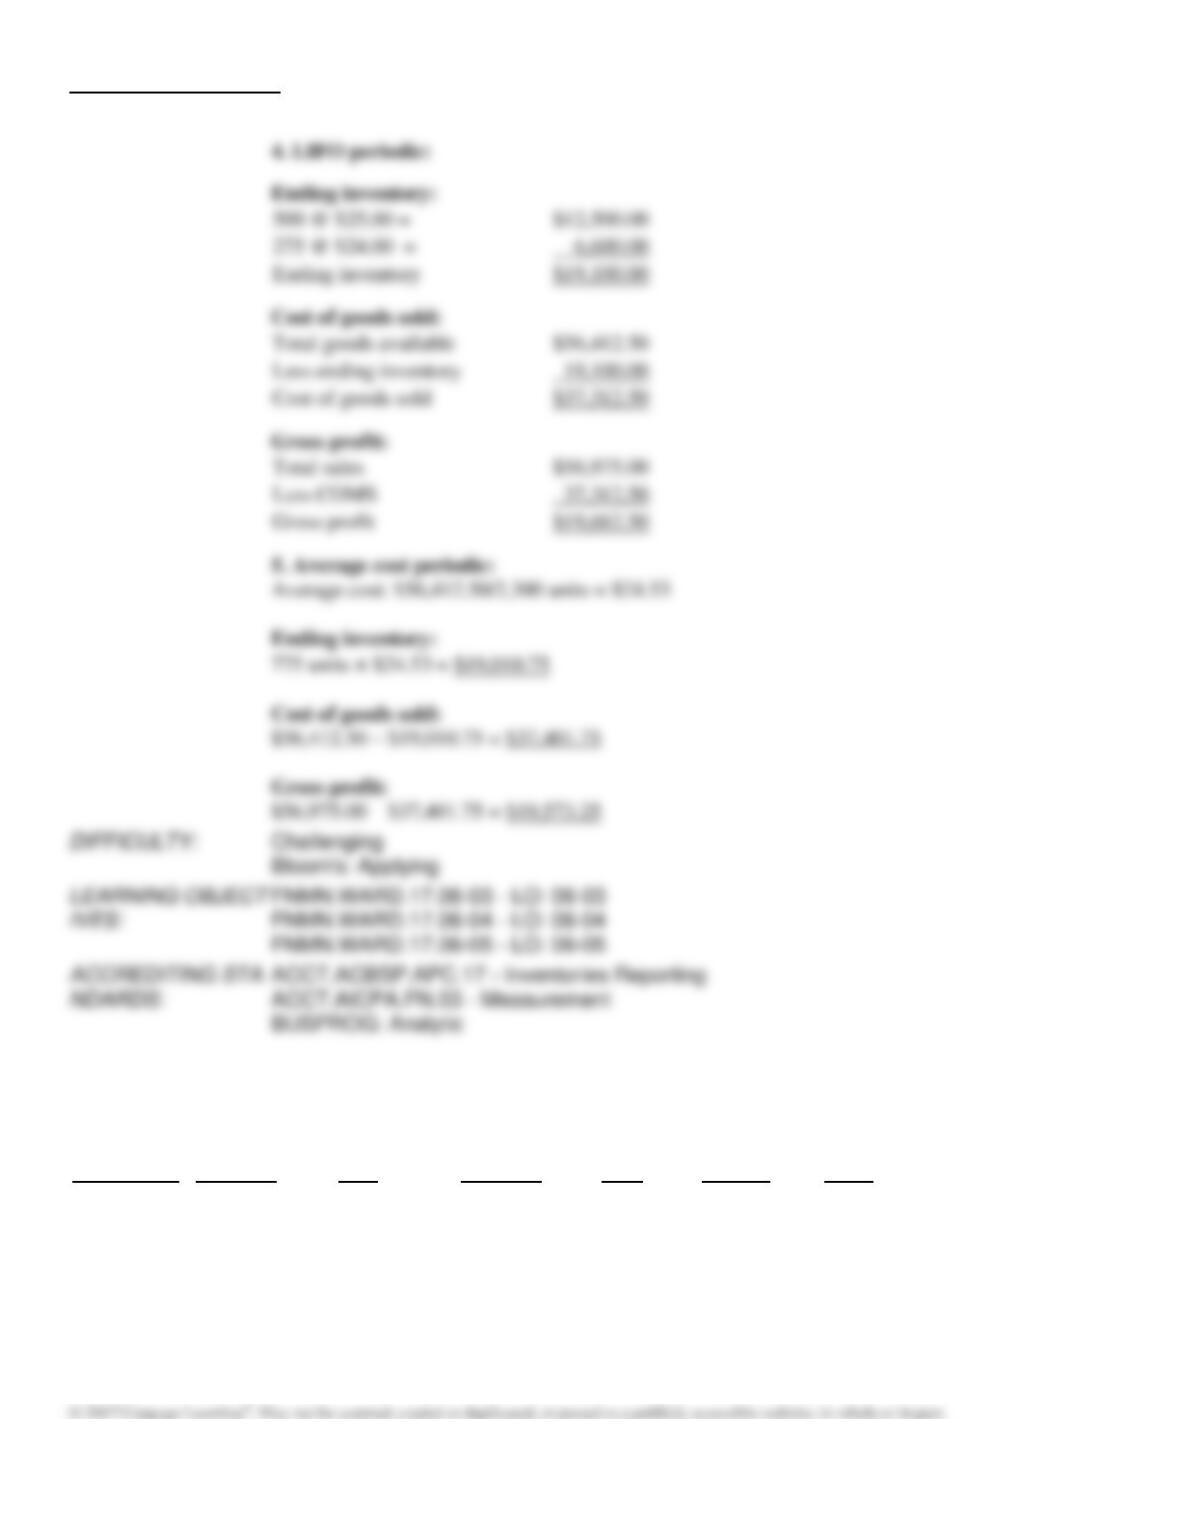
Ending inventory
Total goods available
Less ending inventory
Cost of goods sold
Total sales
Less COMS
Gross profit
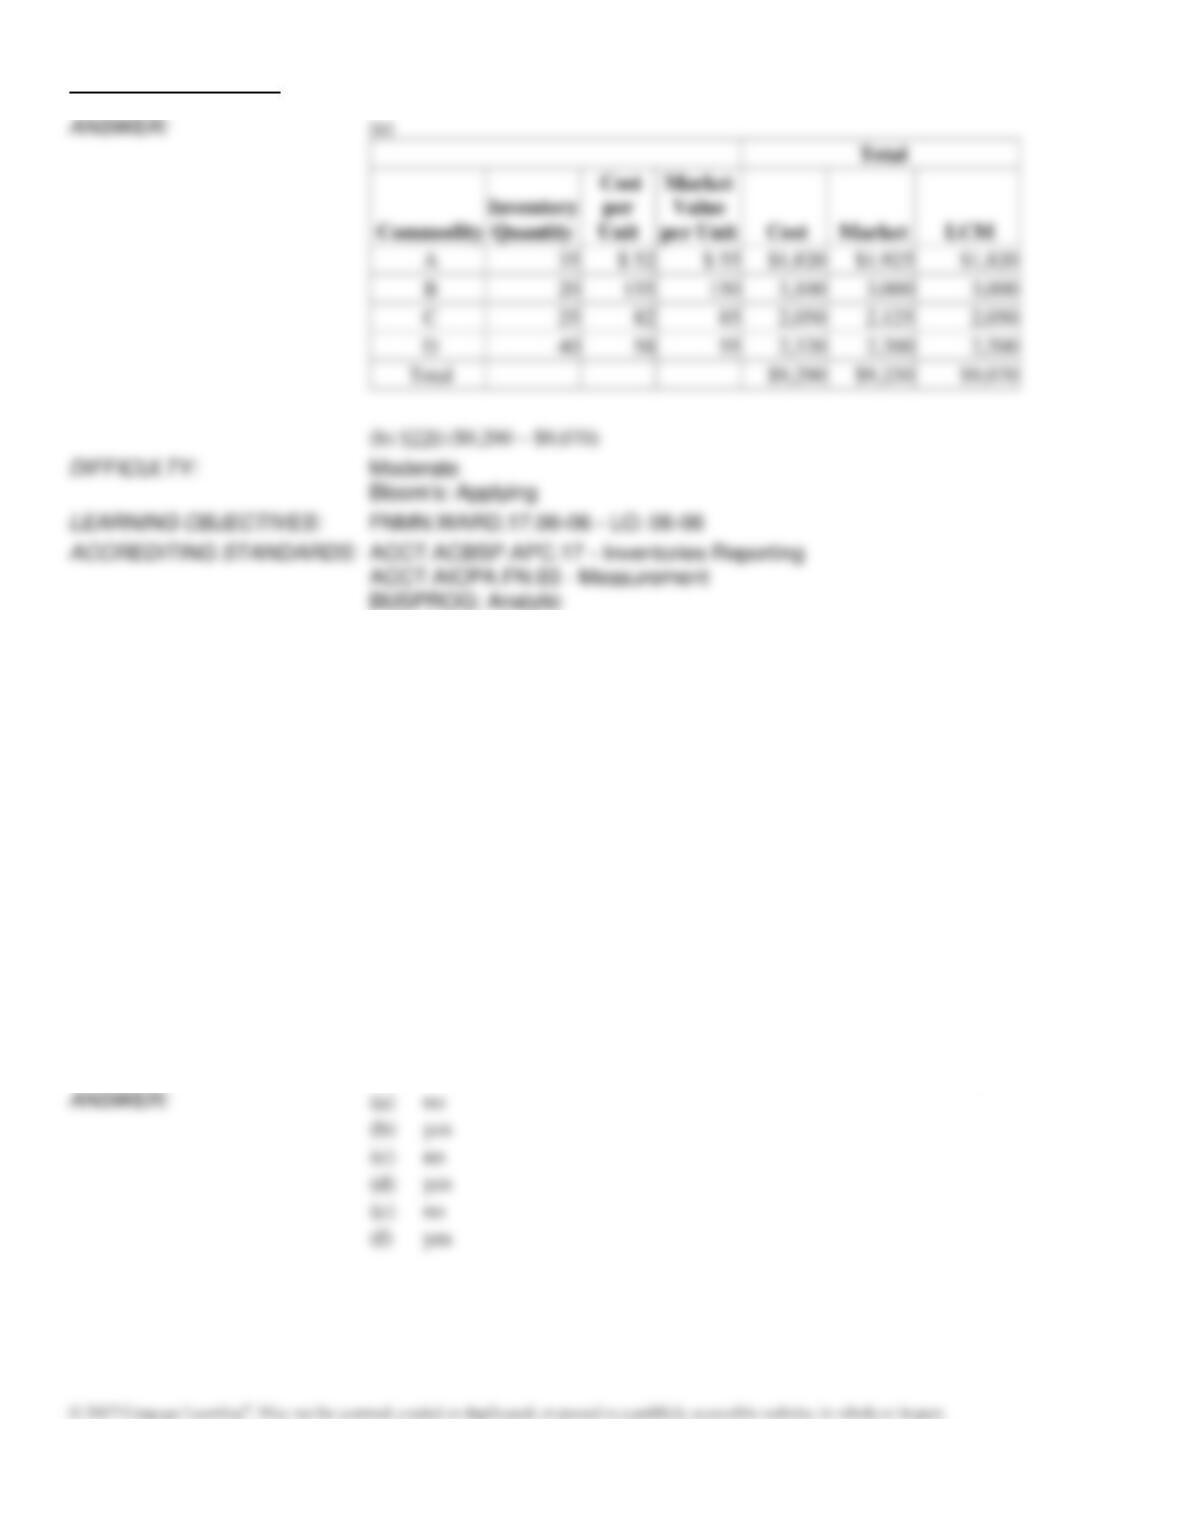
167. Basic inventory data for April 30 are presented below for a business that employs the lower-of-cost-or-market basis
of inventory valuation to each category.
Inventory
Cost per
Market Value
Total
Commodity
Quantity
Unit
per Unit
Cost
Market
LCM
A
35
$ 52
$ 55
_______
_______
_______
B
20
155
150
_______
_______
_______
C
25
82
85
_______
_______
_______
D
40
58
55
_______
_______
_______
(a)
Complete the table.
(b)
Determine the amount of reduction in the inventory at April 30 attributable to market
decline.
Chapter 6 – Inventories
168. Hampton Co. took a physical count of its inventory on December 31. In addition, it had to decide whether or not the
following items should be added to this count.
(a)
Inventory on hand had been sold earlier in the year but had been returned by customers for
various warranty repairs.
(b)
Hampton Co. sent merchandise on a consignment basis on December 31 just prior to the
physical count.
(c)
On December 22, Hampton Co. ordered merchandise on FOB destination terms. The
merchandise was shipped by the supplier on December 30 but had not been received by
December 31.
(d)
On December 27, Hampton Co. ordered merchandise on FOB shipping point terms. The
merchandise was shipped on December 29 but had not been received by December 31.
(e)
Merchandise sold FOB shipping point on December 31 was picked up by the freight
company just before closing on December 31.
(f)
Merchandise shipped to a customer FOB destination was picked up by the freight company
on December 28 but had not arrived at its destination as of December 31.
Answer “yes” or “no” to indicate which items should and should not be added to the December 31 inventory count.
Chapter 6 – Inventories
169. 1. Explain the effect of the following on the financial statements:
Goods held on consignment were included in the ending inventory count.
Goods purchased FOB shipping point were in transit on the last day of the year.
The goods were not counted as part of ending inventory.
Goods sold FOB shipping point were in transit on the last day of the year.
These goods were not counted as part of ending inventory.
2. What happens if inventory errors are not found and corrected?
Chapter 6 – Inventories
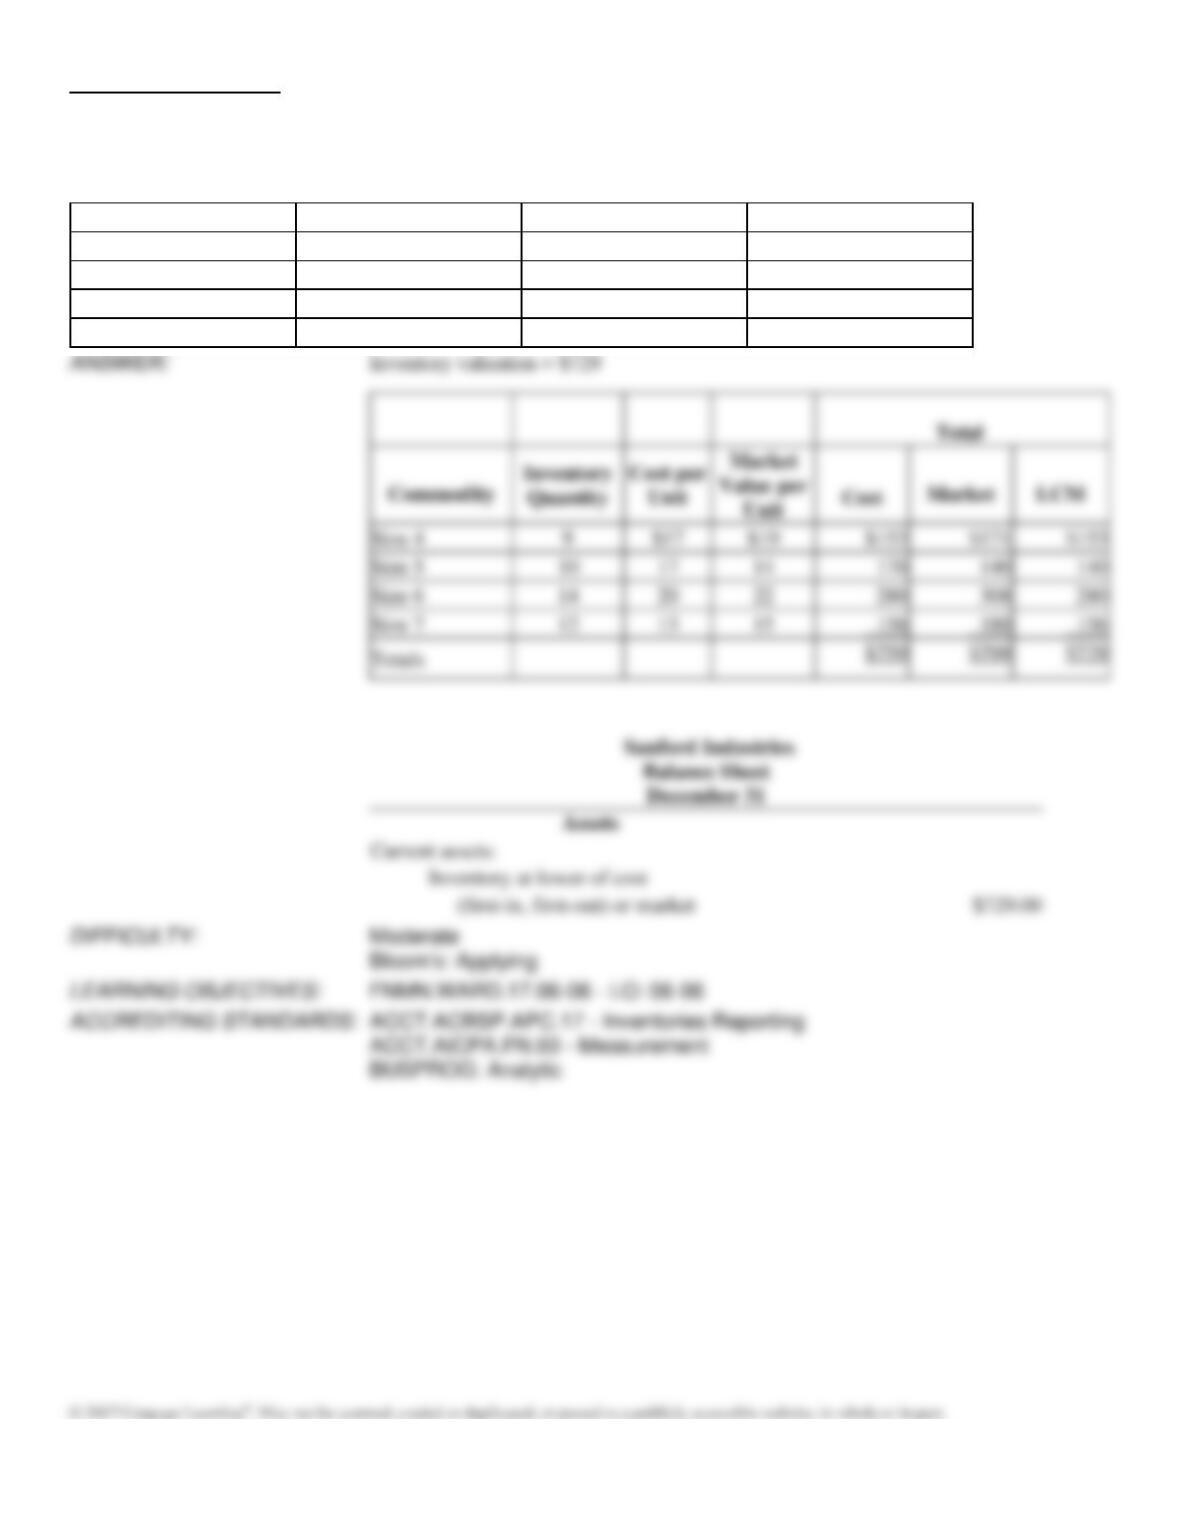
170. On the basis of the following data for Sanford Industries as of December 31, determine the value of the inventory at
the lower of cost or market. Also, show how the inventory would appear on the balance sheet (assume that the cost was
determined by the FIFO method). Apply lower of cost or market to each inventory item.
Commodity
Inventory Quantity
Cost per Unit
Market Value per Unit
Size 4
9
$17
$19
Size 5
10
17
14
Size 6
14
20
22
Size 7
12
13
15
Chapter 6 – Inventories
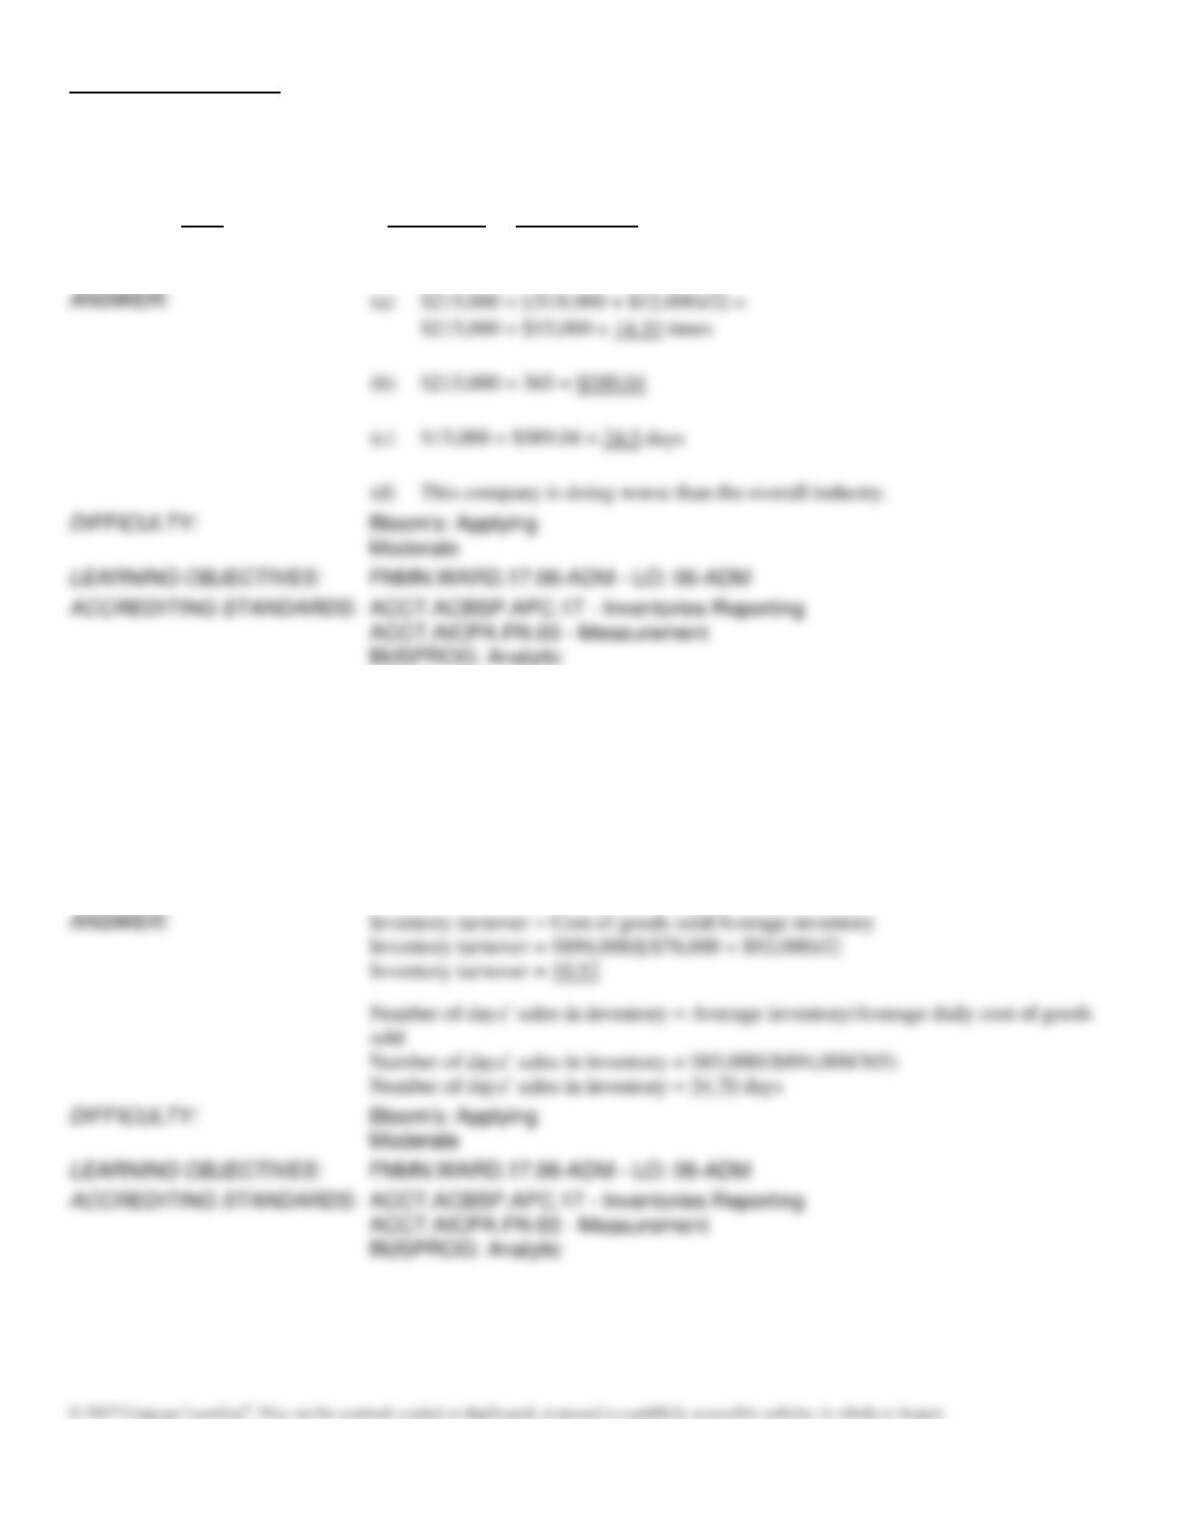
171. Based on the following information: compute (a) inventory turnover; (b) average daily cost of goods sold; and (c)
number of days’ sales in inventory for the current year. Use a 365-day year. (d) If an inventory turnover of 12 is average
for the industry, how is this company doing?
Item
Prior Year
Current Year
Cost of goods sold
$172,900
$215,000
Inventory
18,000
12,000
(a)
$215,000 ÷ [($18,000 + $12,000)/2] =
$215,000 ÷ $15,000 = 14.33 times
(b)
$215,000 ÷ 365 = $589.04
(c)
$15,000 ÷ $589.04 = 24.5 days
(d)
This company is doing worse than the overall industry.
172. The following data were taken from Castle, Inc.
Cost of goods sold
$894,000
Inventory, end of year
78,000
Inventory, beginning of the year
92,000
Determine the inventory turnover ratio and the number of days’ sales in inventory for Castle Inc. Round to two decimal
places.
Chapter 6 – Inventories
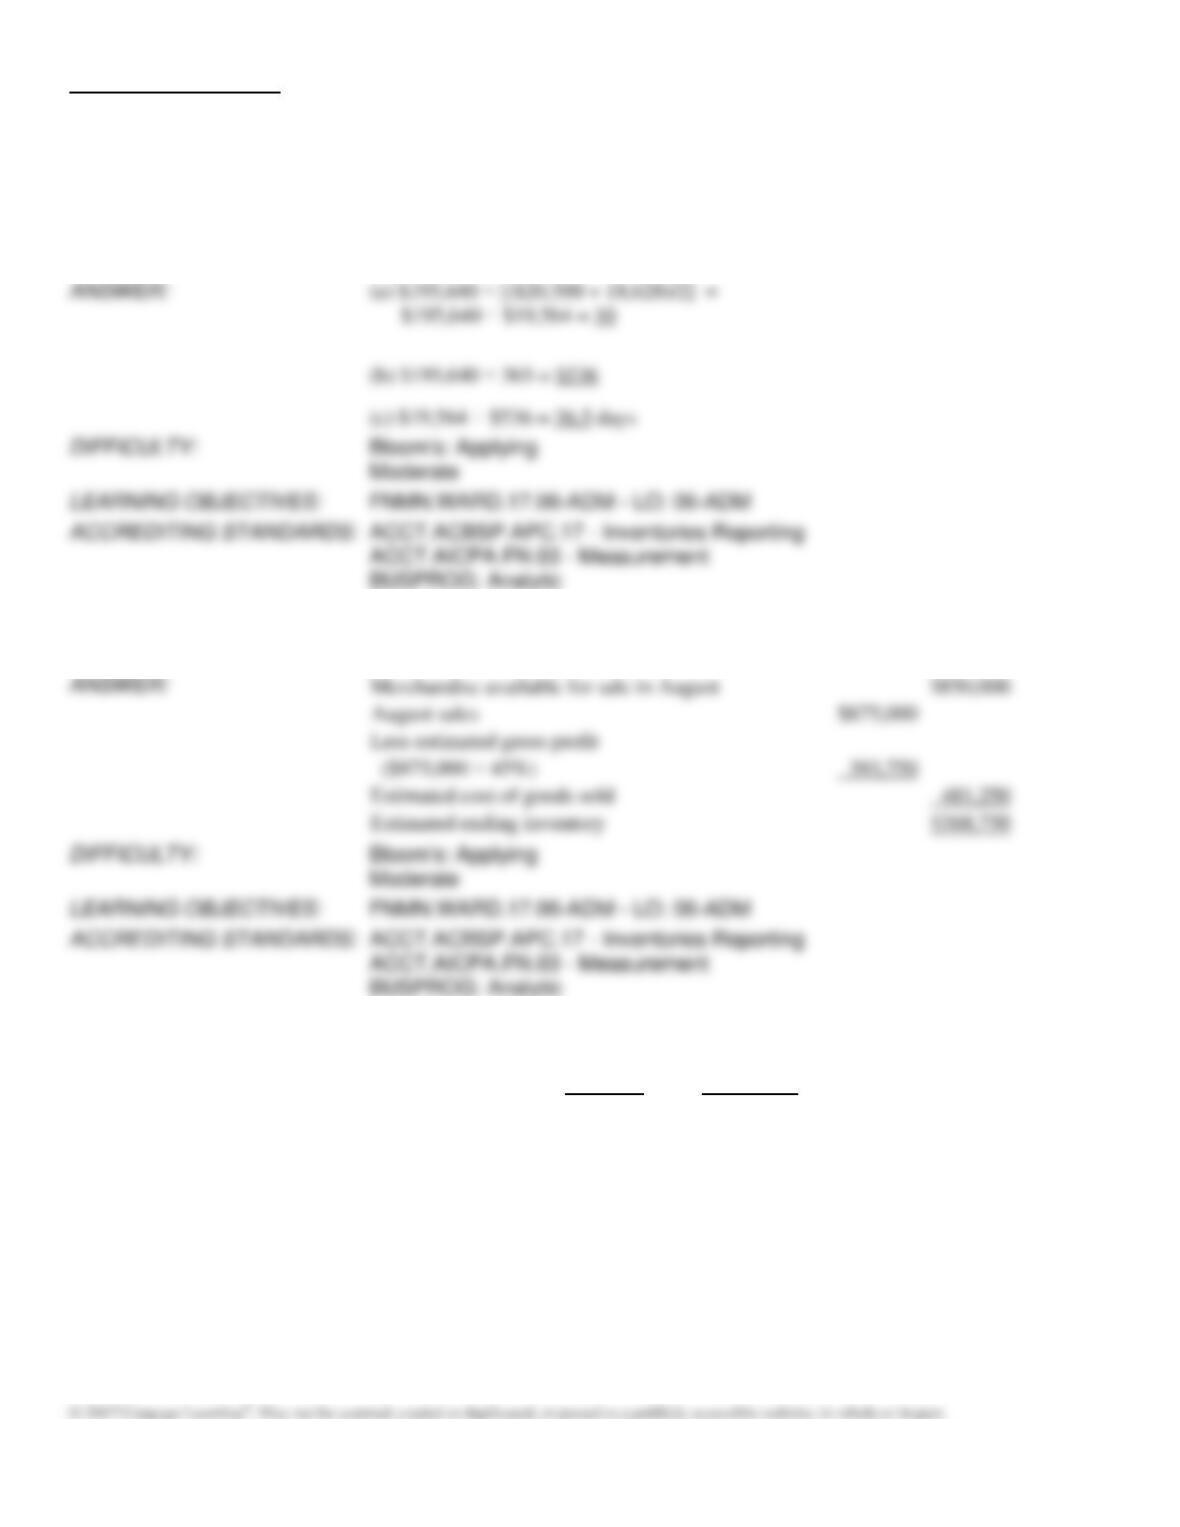
173. Based on the following information, compute (a) inventory turnover; (b) average daily cost of goods sold using a 365
day year; and (c) number of days’ sales in inventory.
Cost of goods sold $195,640
Inventory:
Beginning 20,500
Ending 18,628
(c) $19,564 ÷ $536 = 36.5 days
LEARNING OBJECTIVES:
174. During August, the first month of the fiscal year, sales totaled $875,000 and the cost of merchandise available for
sale totaled $850,000. Estimate the cost of the inventory as of August 31, based on an estimated gross profit rate of 45%.
Merchandise available for sale in August
August sales
Less estimated gross profit
Estimated ending inventory
LEARNING OBJECTIVES:
175. On the basis of the following data, estimate the cost of the inventory at March 31 by the retail method.
Cost
Retail
March 1
Inventory
$250,000
$ 350,000
March 1–31
Purchases (net)
850,000
1,650,000
March 1–31
Sales
845,000
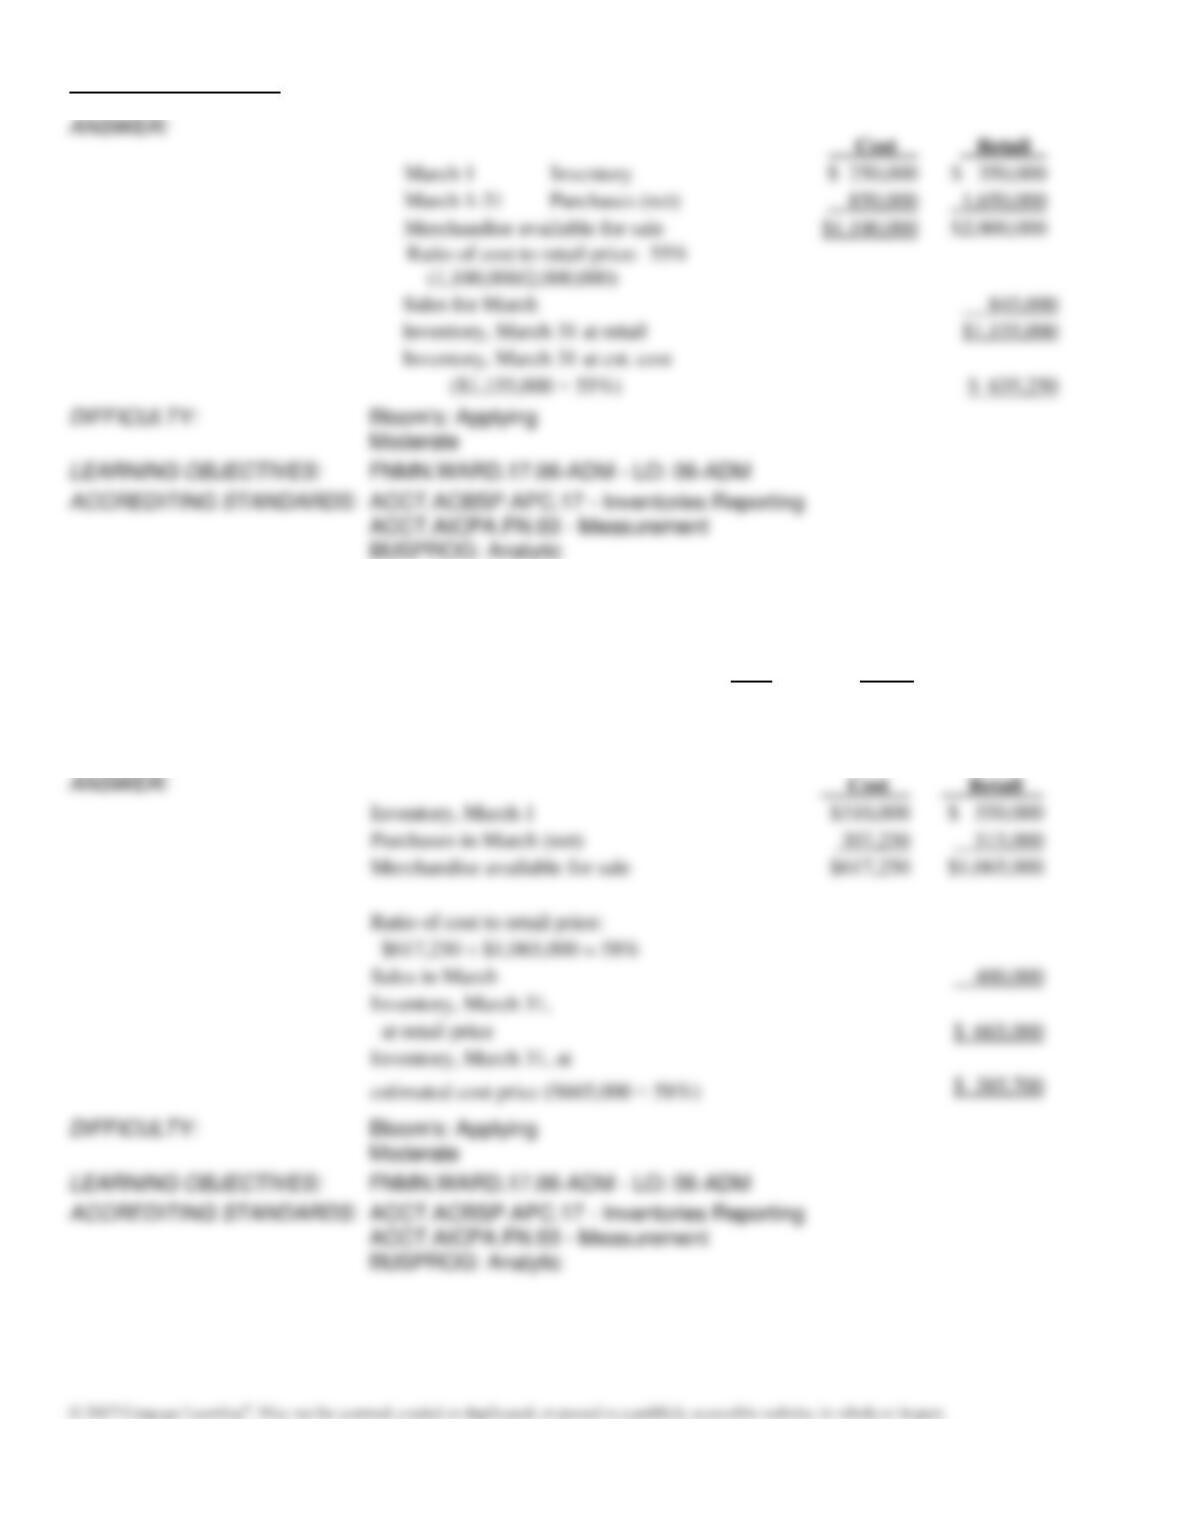
Chapter 6 – Inventories
Inventory
176. On the basis of the following data, determine the estimated cost of the inventory as of March 31 by the retail method,
presenting details of the computation in good order.
Cost
Retail
Mar. 1
Inventory
$310,000
$550,000
1–31
Purchases (net)
307,250
515,000
1–31
Sales
400,000
Chapter 6 – Inventories
Match each description to the appropriate document used for inventory control (a–c).
a.
Receiving report
b.
Vendor’s invoice
c.
Purchase order
DIFFICULTY:
Easy
Bloom’s: Remembering
LEARNING OBJECTIVES:
FNMN.WARD.17.06-01 – LO: 06–01
ACCREDITING STANDARDS:
ACCT.ACBSP.APC.17 – Inventories Reporting
ACCT.AICPA.FN.03 – Measurement
BUSPROG: Analytic
177. last document in the chain, use to compare all three for accuracy
178. authorizes the purchase of inventory from an approved vendor
179. establishes an initial record of the receipt of inventory
Match each description to the appropriate cost flow assumption (a–d).
a.
Weighted average
b.
First-in, first-out (FIFO)
c.
Last-in, first-out (LIFO)
d.
Specific identification
DIFFICULTY:
Easy
Bloom’s: Remembering
LEARNING OBJECTIVES:
FNMN.WARD.17.06-02 – LO: 06–02
ACCREDITING STANDARDS:
ACCT.ACBSP.APC.17 – Inventories Reporting
ACCT.AICPA.FN.03 – Measurement
BUSPROG: Analytic
180. The cost of the units sold and in ending inventory is a weighted average of the purchase costs.
181. Cost flow is assumed to be in the reverse order of costs incurred.
182. Cost flow matches the unit sold to the unit purchased.
183. Cost flow is in the order in which the costs were incurred.
Chapter 6 – Inventories
Match each description to the appropriate inventory system (a or b).
a.
Perpetual
b.
Periodic
DIFFICULTY:
Easy
Bloom’s: Remembering
LEARNING OBJECTIVES:
FNMN.WARD.17.06-03 – LO: 06–03
FNMN.WARD.17.06-04 – LO: 06–04
ACCREDITING STANDARDS:
ACCT.ACBSP.APC.17 – Inventories Reporting
ACCT.AICPA.FN.03 – Measurement
BUSPROG: Analytic
184. This system can be costly and time consuming if not computerized.
185. Average cost is rarely used with this system.
186. Under this system, only revenue is recorded when sales are made.
187. When using this system, a physical inventory is necessary to determine cost of goods sold.
Match each description to the appropriate cost flow assumption (a–c).
a.
FIFO
b.
LIFO
c.
Weighted average
DIFFICULTY:
Moderate
Bloom’s: Remembering
LEARNING OBJECTIVES:
FNMN.WARD.17.06-02 – LO: 06–02
FNMN.WARD.17.06-03 – LO: 06–03
FNMN.WARD.17.06-04 – LO: 06–04
FNMN.WARD.17.06-05 – LO: 06–05
ACCREDITING STANDARDS:
ACCT.ACBSP.APC.17 – Inventories Reporting
ACCT.AICPA.BB.01 – Industry
ACCT.AICPA.FN.03 – Measurement
BUSPROG: Analytic
188. Produces the same cost of goods sold under both the periodic and the perpetual inventory systems
189. Rarely used with a perpetual inventory system
190. Produces results that are similar to the specific identification method
Chapter 6 – Inventories
191. Widely used for tax purposes
192. Never results in either the highest or lowest possible net income
193. Produces the highest gross profit when costs are decreasing
194. Produces the highest ending inventory when costs are increasing
195. Assigns the same value to all inventory units
196. Prohibited under International Financial Reporting Standards (IFRS)
197. Does not follow the physical flow of goods in most cases
198. Cost of the latest purchases are assigned to ending inventory
Match each situation to its impact (a–c) on the current year’s net income.
a.
Net income for the current year will be overstated.
b.
Net income for the current year will be understated.
c.
There will be no error effect on net income.
DIFFICULTY:
Moderate
Bloom’s: Remembering
LEARNING OBJECTIVES:
FNMN.WARD.17.06-06 – LO: 06–06
ACCREDITING STANDARDS:
ACCT.ACBSP.APC.17 – Inventories Reporting
ACCT.AICPA.FN.03 – Measurement
BUSPROG: Analytic
199. Purchased merchandise was shipped FOB shipping point on the last day of the year. The cost of the merchandise
was not included in ending inventory.
200. Merchandise was purchased FOB destination on the last day of the year. The cost of the merchandise purchased was
not included in ending inventory.
201. Merchandise held on consignment was included in the count of ending inventory.
202. A consignor included merchandise in the hands of the consignee in ending inventory.
Chapter 6 – Inventories
203. Beginning inventory was understated.
204. Merchandise that was sold and shipped FOB destination on the last day of the year was not included in the seller’s
ending inventory.
205. Merchandise that was sold and shipped FOB shipping point on the last day of the year was not included in the
seller’s ending inventory.
206. The beginning inventory was recorded as $10,000, when actual inventory on hand was $12,000.